Strategy vault / Trend following
Deviation Based Trend Tracking Strategy
This strategy identifies and tracks trends based on price deviation indicators combined with Fibonacci retracement areas. Trading signals are generated when the price deviates further and further from one direction.
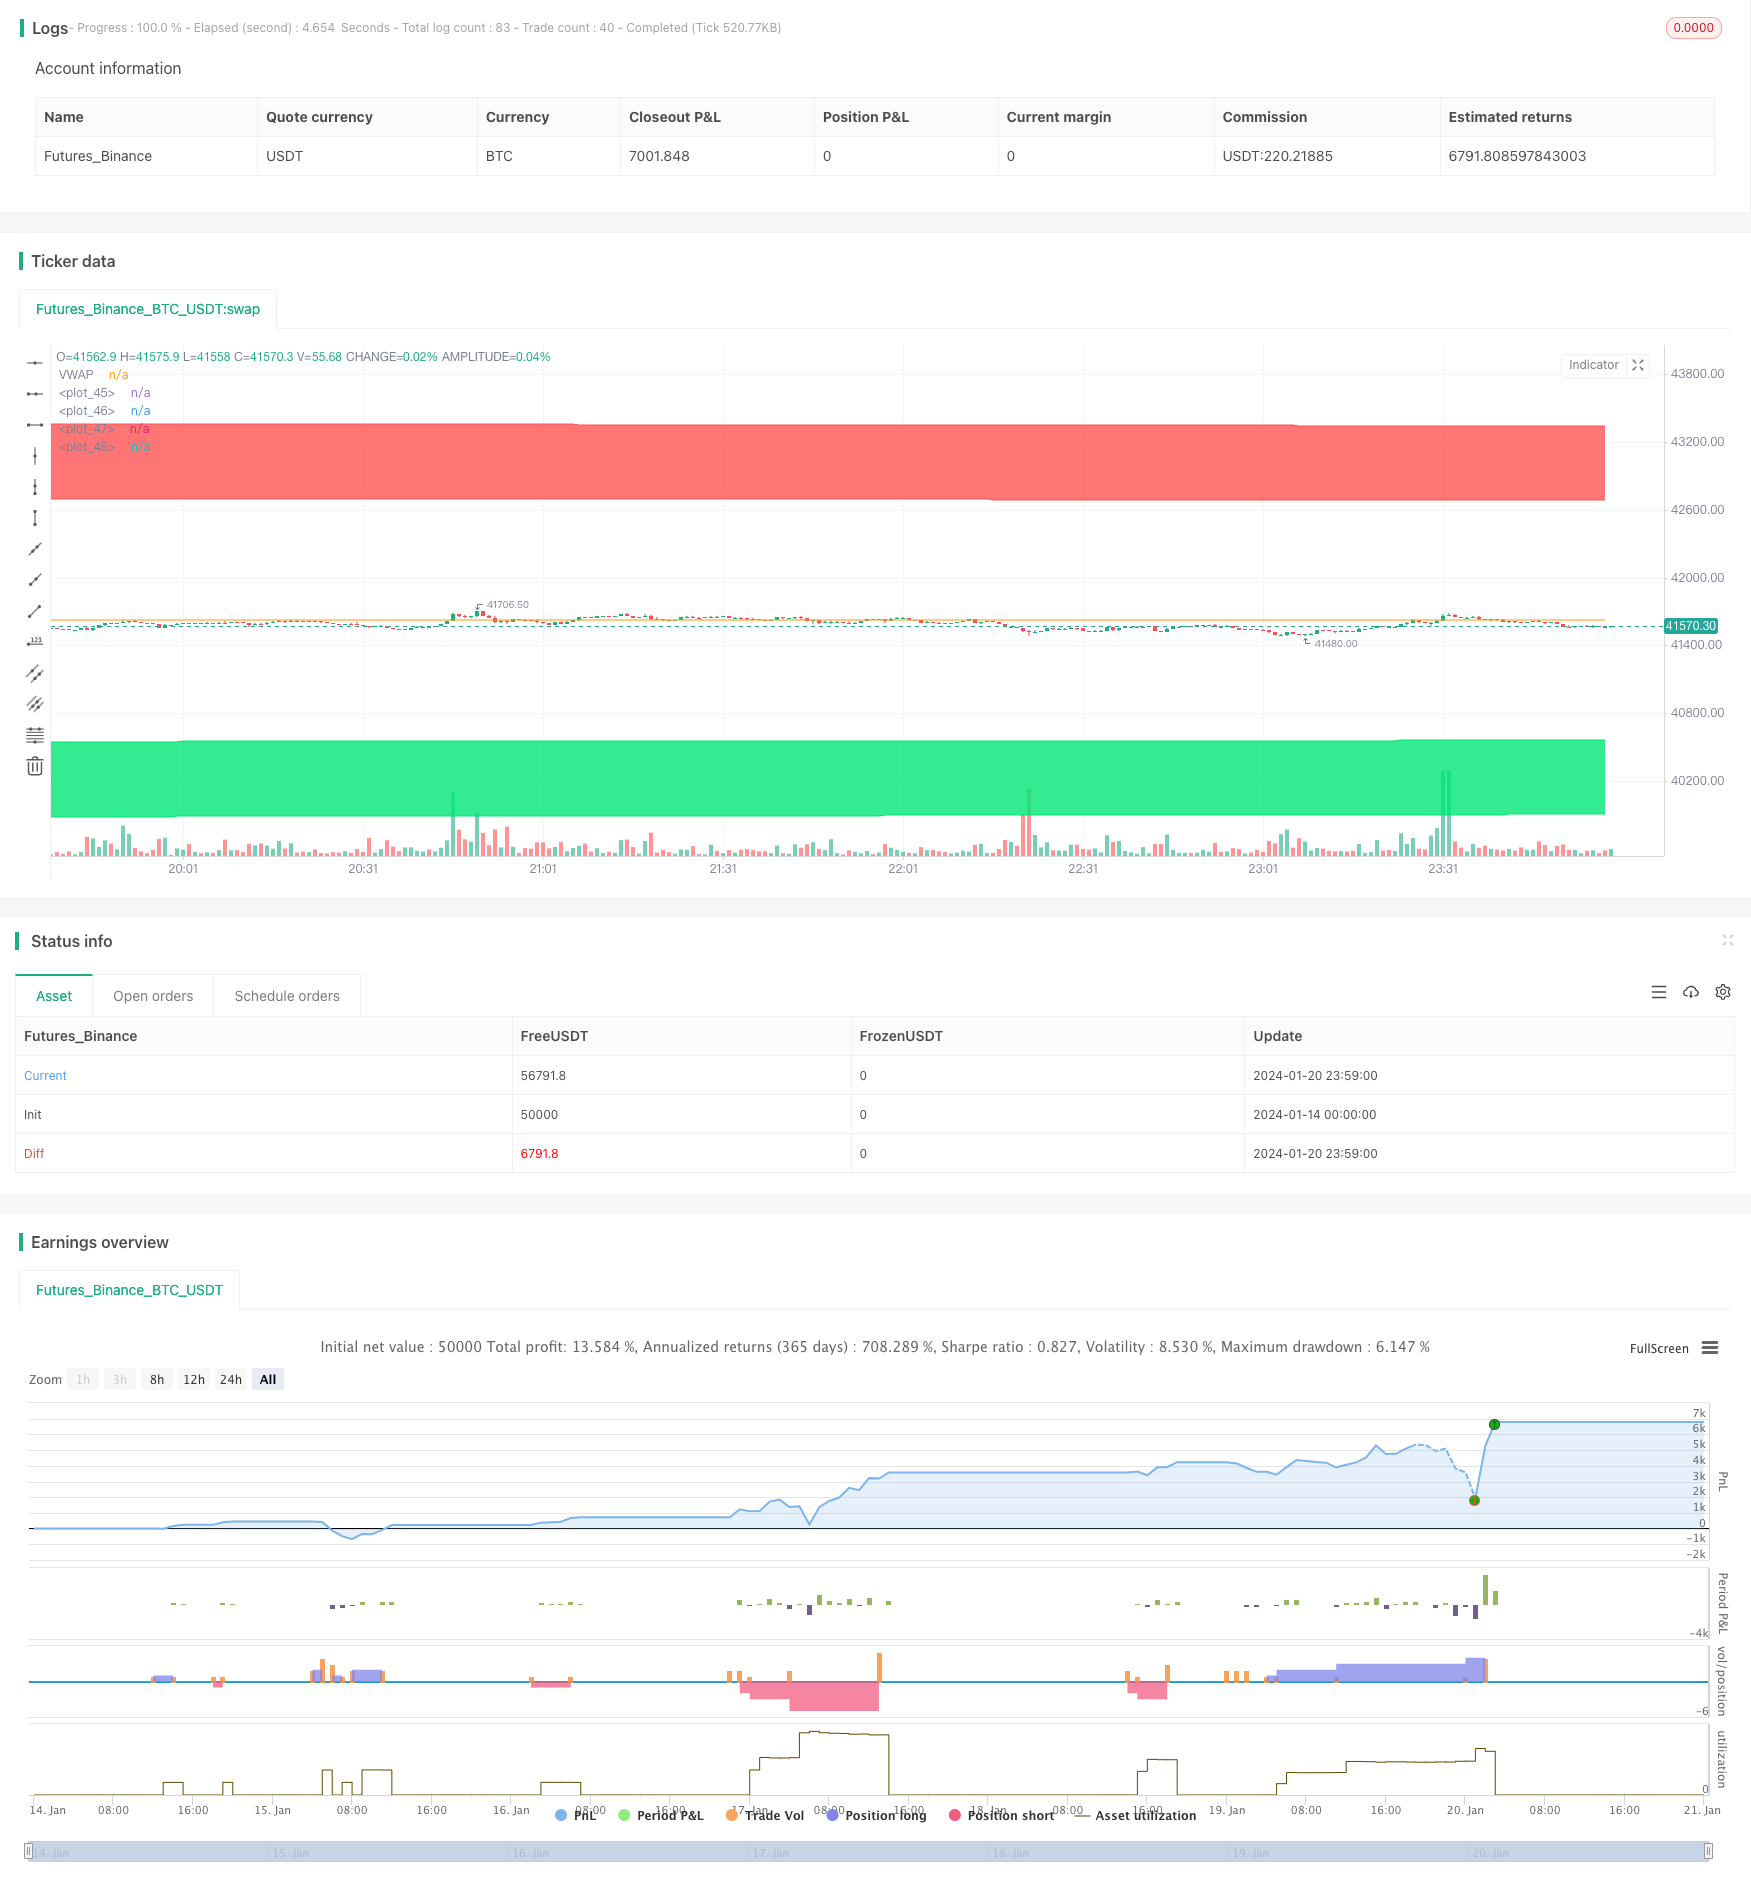
Overview
This strategy identifies and tracks trends based on price deviation indicators combined with Fibonacci retracement areas. Trading signals are generated when the price deviates further and further from one direction.
Strategy Logic
The strategy uses VWAP as the midpoint line of the price. Then the upper and lower bands of 1.618 and 2.618 standard deviation of price fluctuations are calculated. A long signal is generated when the price breaks through the lower band upwards. A short signal is generated when the price breaks through the upper band downwards.
The stop loss EXIT signals after opening long or short positions are: the stop loss line for long positions is the lower band, and for short positions is the upper band.
Specifically, it involves the following steps:
Calculate VWAP as the midpoint line of the price
Calculate the standard deviation sd of the price as an indicator of price volatility
Calculate the upper and lower bands based on sd. The upper bands are VWAP + 1.618sd and VWAP + 2.618sd. The lower bands are VWAP - 1.618sd and VWAP - 2.618sd.
A long signal is generated when the price breaks through the 1.618 lower band upwards. A short signal is generated when the price breaks through the 1.618 upper band downwards.
Long stop loss EXIT: price breaks through 2.618 lower band; Short stop loss EXIT: price breaks through 2.618 upper band.
Advantage Analysis
The strategy has the following advantages:
Price deviation indicators can effectively determine price trends and track trends
Fibonacci retracement areas make entry and stop loss exits clearer
VWAP as the midpoint line of the price also enhances the reference value of the indicator
Parameters can be adjusted to suit different products and timeframes
Risk Analysis
The strategy also has some risks:
It may incur greater losses during trend reversals
Improper parameter settings can also affect strategy performance
There is a higher stop loss risk during violent price fluctuations
Countermeasures:
Appropriately shorten the holding period and stop losses in time
Optimize parameters to find the best parameter combination
Increase position sizing management to control single loss
Optimization Directions
The strategy can also be optimized in the following areas:
Incorporate trend indicators to avoid counter trend trading
Add position sizing management mechanisms
Optimize parameter settings
Backtest and optimize over multiple timeframes
Summary
This strategy identifies and tracks trends based on the price deviation concept combined with VWAP and Fibonacci standard deviation bands. Compared to using single indicators like moving averages, this strategy has clearer judgments and risk control. Through parameter adjustment and optimization, the strategy can be adapted to different products and timeframes to achieve better performance.
Parameters
| Name | Default | What it controls |
|---|---|---|
| v_input_1 | 1.618 | Fibo extension 1 |
| v_input_2 | 2.618 | Fibo extension 2 |
| v_input_3 | W | Resolution VWAP |
| v_input_4 | 150 | Deviation value min. |
Source Pine Script
/*backtest
start: 2024-01-14 00:00:00
end: 2024-01-21 00:00:00
period: 1m
basePeriod: 1m
exchanges: [{"eid":"Futures_Binance","currency":"BTC_USDT"}]
*/

// This source code is subject to the terms of the Mozilla Public License 2.0 at https://mozilla.org/MPL/2.0/
// © Mysteriown

//@version=4
strategy(title="VWAP + Fibo Dev Extensions Strategy", overlay=true, pyramiding=5, commission_value=0.08)

// -------------------------------------
// ------- Inputs Fibos Values ---------
// -------------------------------------

fib1 = input(title="Fibo extension 1", type=input.float, defval=1.618)
fib2 = input(title="Fibo extension 2", type=input.float, defval=2.618)
reso = input(title="Resolution VWAP", type=input.resolution, defval="W")
dev = input(title="Deviation value min.", type=input.integer, defval=150)


// -------------------------------------
// -------- VWAP Calculations ----------
// -------------------------------------

t = time(reso)
debut = na(t[1]) or t > t[1]

addsource = hlc3 * volume
addvol = volume
addsource := debut ? addsource : addsource + addsource[1]
addvol := debut ? addvol : addvol + addvol[1]
VWAP = addsource / addvol

sn = 0.0
sn := debut ? sn : sn[1] + volume * (hlc3 - VWAP[1]) * (hlc3 - VWAP)
sd = sqrt(sn / addvol)

Fibp2 = VWAP + fib2 * sd
Fibp1 = VWAP + fib1 * sd
Fibm1 = VWAP - fib1 * sd
Fibm2 = VWAP - fib2 * sd


// -------------------------------------
// -------------- Plots ----------------
// -------------------------------------

plot(VWAP, title="VWAP", color=color.orange)
pFibp2 = plot(Fibp2, color=color.red)
pFibp1 = plot(Fibp1, color=color.red)
pFibm1 = plot(Fibm1, color=color.lime)
pFibm2 = plot(Fibm2, color=color.lime)

fill(pFibp2,pFibp1, color.red)
fill(pFibm2,pFibm1, color.lime)


// -------------------------------------
// ------------ Positions --------------
// -------------------------------------

bull = crossunder(low[1],Fibm1[1]) and low[1]>=Fibm2[1] and low>Fibm2 and low<Fibm1 and sd>dev
bear = crossover(high[1],Fibp1[1]) and high[1]<=Fibp2[1] and high<Fibp2 and high>Fibp1 and sd>dev

//plotshape(bear, title='Bear', style=shape.triangledown, location=location.abovebar, color=color.red, offset=0)
//plotshape(bull, title='Bull', style=shape.triangleup, location=location.belowbar, color=color.green, offset=0)


// -------------------------------------
// --------- Strategy Orders -----------
// -------------------------------------

strategy.entry("Long", true, when = bull)
strategy.close("Long", when = crossover(high,VWAP) or crossunder(low,Fibm2))

strategy.entry("Short", false, when = bear)
strategy.close("Short", when = crossunder(low,VWAP) or crossover(high,Fibp2))Published by ChaoZhang on the FMZ strategy square · last modified 2024-01-22. Collected in the Quant Trading Vault. Unvalidated research: re-test with your own data and costs before trusting it.
Build this with AgenKit
A spec is not a trading system. Paste this into your coding agent and AgenKit runs a specialist team — architecture, test-first build, risk gates, review — with paper trading on by default.
/agenkit build a production-grade trading bot with a backtest engine, risk controls and paper trading by default from strategies/Deviation-Based-Trend-Tracking-Strategy.md- npx agenkit install engineering-kit in your project
- Paste the command into your agent and approve each phase
- Get tests, backtest, risk controls and a paper-trading switch
Understand it first
Before you run this, read the lesson behind the idea and how to backtest it honestly. Specs like this one are the survivors of an unknown number of trials; deflate their results accordingly.
Related specs
- Multi Period Trend Confirmation Dynamic Risk Control Quantitative Trading StrategyPine Script · Trend following · 1h
- Multi Period Trend Following and Volume Analysis Adaptive Risk StrategyPine Script · Trend following · 1d
- Multi indicator Decision Based Short Term Trend StrategyPine Script · Trend following · 1h
- 200 EMA VWAP MFI Trend Following StrategyPine Script · Trend following · 1d
- Automated Fibonacci Retracement Trading System StrategyPine Script · Trend following · 1d
- Fixed Range Volume Profile And Anchored VWAP Trend Identification Strategy With Dynamic Stop LossPine Script · Trend following · 1h