Strategy vault / DCA & fixed investment
Dollar Cost Averaging After Downtrend Strategy
The main idea of this strategy is to regularly track low average prices after short-term declines end. Specifically, the strategy will identify the end of a short-term decline at the end of each month, so as to…
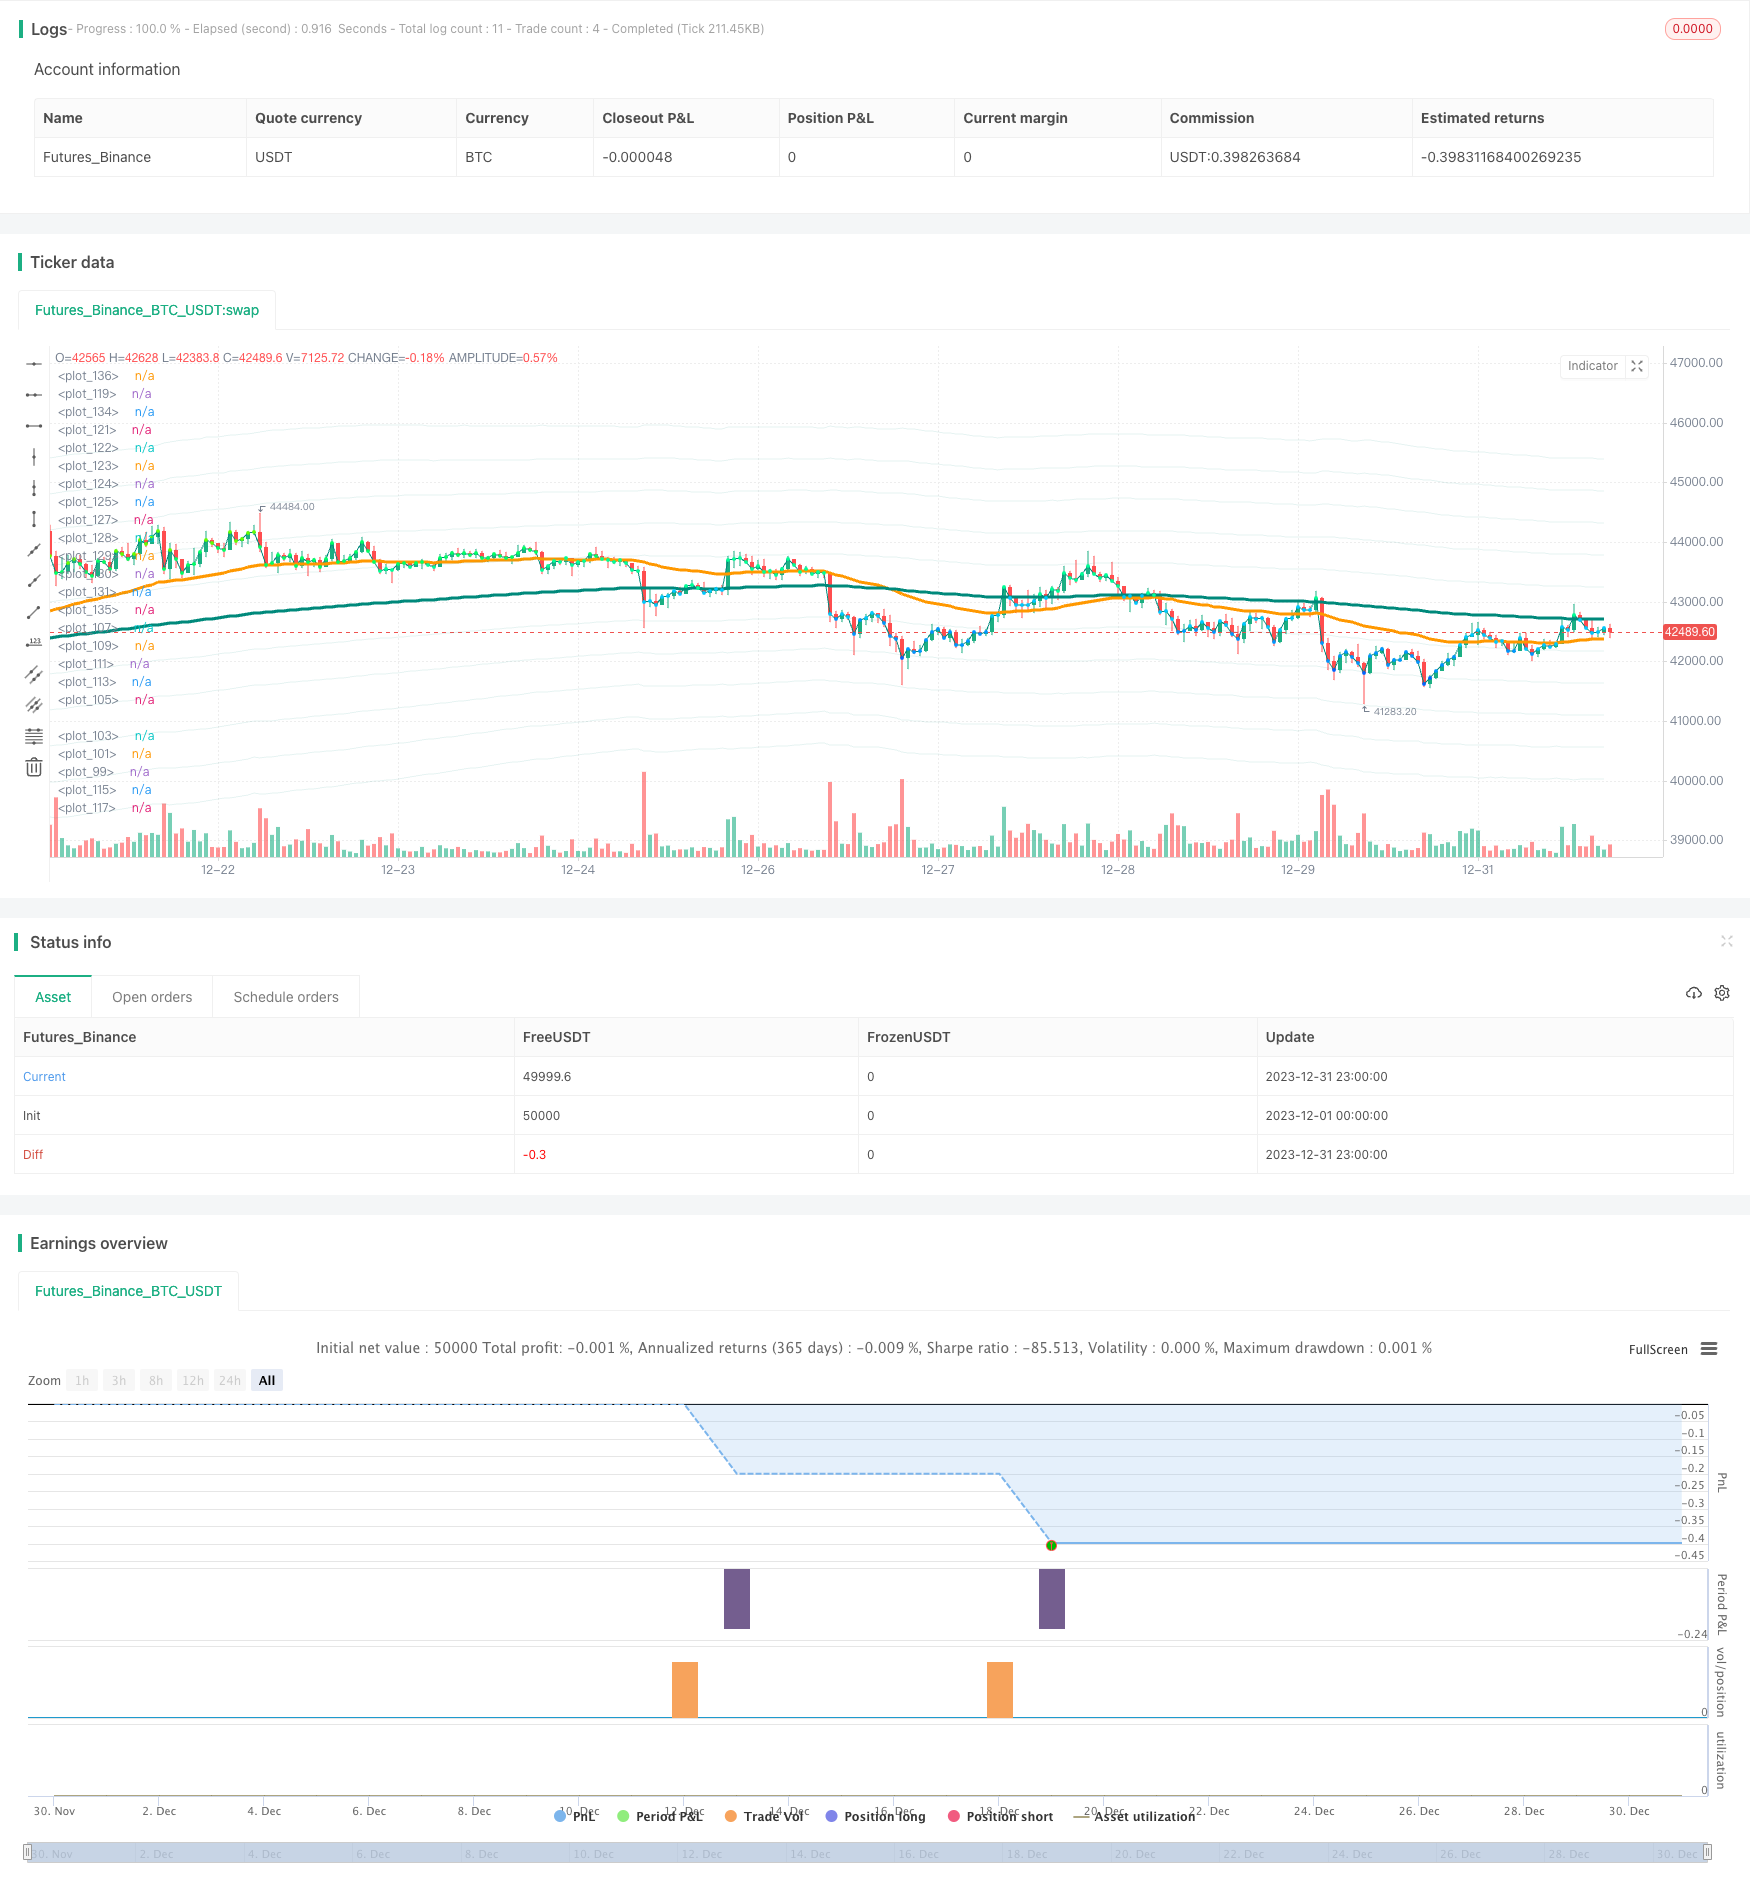
Overview
The main idea of this strategy is to regularly track low average prices after short-term declines end. Specifically, the strategy will identify the end of a short-term decline at the end of each month, so as to regularly add positions; at the same time, clear positions when the last K-line closes.
Strategy Principle
Regular tracking signal judgment: after 24*30 K-lines (representing one month), it is determined that the regular tracking point has been reached and the first signal is output.
End of short-term decline judgment: use the MACD indicator to determine the trend. When MACD divergence occurs and MACD goes below the signal line, it is determined that the short-term decline has ended.
Entry rules: when the regular tracking signal and the end of the short-term decline signal are triggered at the same time, a tracking signal is released and long positions are opened.
Exit rules: when the last K-line closes, clear all positions.
The above is the basic trading flow and principles of the strategy. It is worth noting that the strategy defaults to tracking $1,000 per month in backtests, which will be expanded to 33 months, that is, a total investment of $33,000.
Advantage Analysis
The biggest advantage of this strategy is that it can regularly build positions at low levels. From a long-term perspective, it can obtain a relatively affordable average cost price to generate high returns. In addition, using the MACD indicator to identify short-term buying points is also quite reliable and clear, which can avoid getting into a dead end to some extent, and this can also avoid losses to some extent.
In general, this is a cost averaging strategy that is more suitable for medium and long term holders to regularly purchase batches to obtain satisfactory returns.
Risks and Solutions
The main risk of the strategy is the inability to accurately determine the end of the short-term decline. The MACD indicator's judgment of the end of the decline may lag, which will lead to the failure to enter at the optimal point. In addition, the dispersed investment of funds also increases operating costs.
Consider adding more indicators to determine trends, such as Bollinger Bands, KDJ, etc. These indicators can anticipate reversal timing in advance. At the same time, the amount of funds invested each month can be optimized to reduce the impact of operating costs on returns.
Optimization Directions
The strategy can be further optimized in the following directions:
Optimize the regular tracking cycle, such as tracking once every two months, to reduce the problem of excessive frequent trading.
Incorporate more indicators to determine the end of a short-term decline, making the entry point closer to the lowest point.
Optimize the amount of funds invested each month to find the optimal configuration.
Try to incorporate stop loss strategies to avoid excessive losses when prices fall too deep.
Test the impact of different holding periods on returns to find the optimal holding days.
Summary
The overall idea of this dollar cost averaging after downtrend strategy is clear and easy to understand. By combining regular replenishment and short-term judgment, it can obtain a more affordable average cost price. Medium and long-term holdings of this strategy can generate stable returns and is suitable for investors pursuing long-term investment value. At the same time, there are some directions that can be optimized to further improve the strategy so that its performance can move up one level.
Parameters
| Name | Default | What it controls |
|---|---|---|
| v_input_1 | 2017 | Start year |
| v_input_2 | true | Start month |
| v_input_3 | true | Start day |
| v_input_4 | 2050 | end year |
| v_input_5 | true | end month |
| v_input_6 | true | end day |
Source Pine Script
/*backtest
start: 2023-12-01 00:00:00
end: 2023-12-31 23:59:59
period: 1h
basePeriod: 15m
exchanges: [{"eid":"Futures_Binance","currency":"BTC_USDT"}]
*/

// This source code is subject to the terms of the Mozilla Public License 2.0 at https://mozilla.org/MPL/2.0/
// © BHD_Trade_Bot

// @version=5
strategy(
 shorttitle            = 'DCA After Downtrend v2',
 title                 = 'DCA After Downtrend v2 (by BHD_Trade_Bot)',
 overlay               = true,
 calc_on_every_tick    = false,
 calc_on_order_fills   = false,
 use_bar_magnifier     = false,
 pyramiding            = 1000,
 initial_capital       = 0,
 default_qty_type      = strategy.cash,
 default_qty_value     = 1000,
 commission_type       = strategy.commission.percent,
 commission_value      = 1.1)


// Backtest Time Period
start_year   = input(title='Start year'   ,defval=2017)
start_month  = input(title='Start month'  ,defval=1)
start_day    = input(title='Start day'    ,defval=1)
start_time   = timestamp(start_year, start_month, start_day, 00, 00)

end_year     = input(title='end year'     ,defval=2050)
end_month    = input(title='end month'    ,defval=1)
end_day      = input(title='end day'      ,defval=1)
end_time     = timestamp(end_year, end_month, end_day, 23, 59)

window() => time >= start_time and time <= end_time ? true : false
h1_last_bar = (math.min(end_time, timenow) - time)/1000/60/60 < 2


// EMA
ema50 = ta.ema(close, 50)
ema200 = ta.ema(close, 200)

// EMA_CD
emacd = ema50 - ema200
emacd_signal = ta.ema(emacd, 20)
hist = emacd - emacd_signal

// BHD Unit
bhd_unit = ta.rma(high - low, 200) * 2
bhd_upper = ema200 + bhd_unit
bhd_upper2 = ema200 + bhd_unit * 2
bhd_upper3 = ema200 + bhd_unit * 3
bhd_upper4 = ema200 + bhd_unit * 4
bhd_upper5 = ema200 + bhd_unit * 5

bhd_lower = ema200 - bhd_unit
bhd_lower2 = ema200 - bhd_unit * 2
bhd_lower3 = ema200 - bhd_unit * 3
bhd_lower4 = ema200 - bhd_unit * 4
bhd_lower5 = ema200 - bhd_unit * 5

// Count n candles after x long entries
var int nPastCandles = 0
var int entryNumber = 0
if window()
    nPastCandles := nPastCandles + 1


// ENTRY CONDITIONS

// 24 * 30 per month
entry_condition1 = nPastCandles > entryNumber * 24 * 30

// End of downtrend
entry_condition2 = emacd < 0 and hist < 0 and hist > hist[2]

ENTRY_CONDITIONS = entry_condition1 and entry_condition2


if ENTRY_CONDITIONS
    entryNumber := entryNumber + 1
    entryId = 'Long ' + str.tostring(entryNumber)
    strategy.entry(entryId, strategy.long)


// CLOSE CONDITIONS

// Last bar
CLOSE_CONDITIONS = barstate.islast or h1_last_bar

if CLOSE_CONDITIONS
    strategy.close_all()


// Draw
colorRange(src) =>
    if src > bhd_upper5
        color.rgb(255,0,0)
    else if src > bhd_upper4
        color.rgb(255,150,0)
    else if src > bhd_upper3
        color.rgb(255,200,0)
    else if src > bhd_upper2
        color.rgb(100,255,0)
    else if src > bhd_upper
        color.rgb(0,255,100)
    else if src > ema200
        color.rgb(0,255,150)
    else if src > bhd_lower
        color.rgb(0,200,255)
    else if src > bhd_lower2
        color.rgb(0,150,255)
    else if src > bhd_lower3
        color.rgb(0,100,255)
    else if src > bhd_lower4
        color.rgb(0,50,255)
    else
        color.rgb(0,0,255)

bhd_upper_line = plot(bhd_upper, color=color.new(color.teal, 90))
bhd_upper_line2 = plot(bhd_upper2, color=color.new(color.teal, 90))
bhd_upper_line3 = plot(bhd_upper3, color=color.new(color.teal, 90))
bhd_upper_line4 = plot(bhd_upper4, color=color.new(color.teal, 90))
bhd_upper_line5 = plot(bhd_upper5, color=color.new(color.teal, 90))

bhd_lower_line = plot(bhd_lower, color=color.new(color.teal, 90))
bhd_lower_line2 = plot(bhd_lower2, color=color.new(color.teal, 90))
bhd_lower_line3 = plot(bhd_lower3, color=color.new(color.teal, 90))
bhd_lower_line4 = plot(bhd_lower4, color=color.new(color.teal, 90))
bhd_lower_line5 = plot(bhd_lower5, color=color.new(color.teal, 90))
// fill(bhd_upper_line5, bhd_lower_line5, color=color.new(color.teal, 95))

plot(ema50, color=color.orange, linewidth=3)
plot(ema200, color=color.teal, linewidth=3)
plot(close, color=color.teal, linewidth=1)
plot(close, color=colorRange(close), linewidth=3, style=plot.style_circles)
Published by ChaoZhang on the FMZ strategy square · last modified 2024-01-17. Collected in the Quant Trading Vault. Unvalidated research: re-test with your own data and costs before trusting it.
Build this with AgenKit
A spec is not a trading system. Paste this into your coding agent and AgenKit runs a specialist team — architecture, test-first build, risk gates, review — with paper trading on by default.
/agenkit build a production-grade trading bot with a backtest engine, risk controls and paper trading by default from strategies/Dollar-Cost-Averaging-After-Downtrend-Strategy.md- npx agenkit install engineering-kit in your project
- Paste the command into your agent and approve each phase
- Get tests, backtest, risk controls and a paper-trading switch
Understand it first
Before you run this, read the lesson behind the idea and how to backtest it honestly. Specs like this one are the survivors of an unknown number of trials; deflate their results accordingly.
Related specs
- Multi Indicator Confirmation EMA Breakout with DCA and Dynamic Take Profit StrategyPine Script · DCA & fixed investment · 1d
- Mean Reversion Bollinger Band Dollar Cost Averaging Investment StrategyPine Script · DCA & fixed investment · 1d
- Bollinger Band and RSI Mixing with DCA StrategyPine Script · DCA & fixed investment · 1d
- DCA Dual Moving Average Turtle Trading StrategyPine Script · DCA & fixed investment · 10m
- EMA Crossover Smart DCA with Dual Trailing Stop SystemPine Script · DCA & fixed investment · 1d
- Quantized Gradual Weighted DCA Trading StrategyPine Script · DCA & fixed investment · 1d