Strategy vault / Mean reversion
Double Moving Average and MACD Combination Trading Strategy
The double moving average and MACD combination trading strategy is a quantitative trading strategy that utilizes both moving averages and momentum indicators for trade signal generation and validation. By combining…
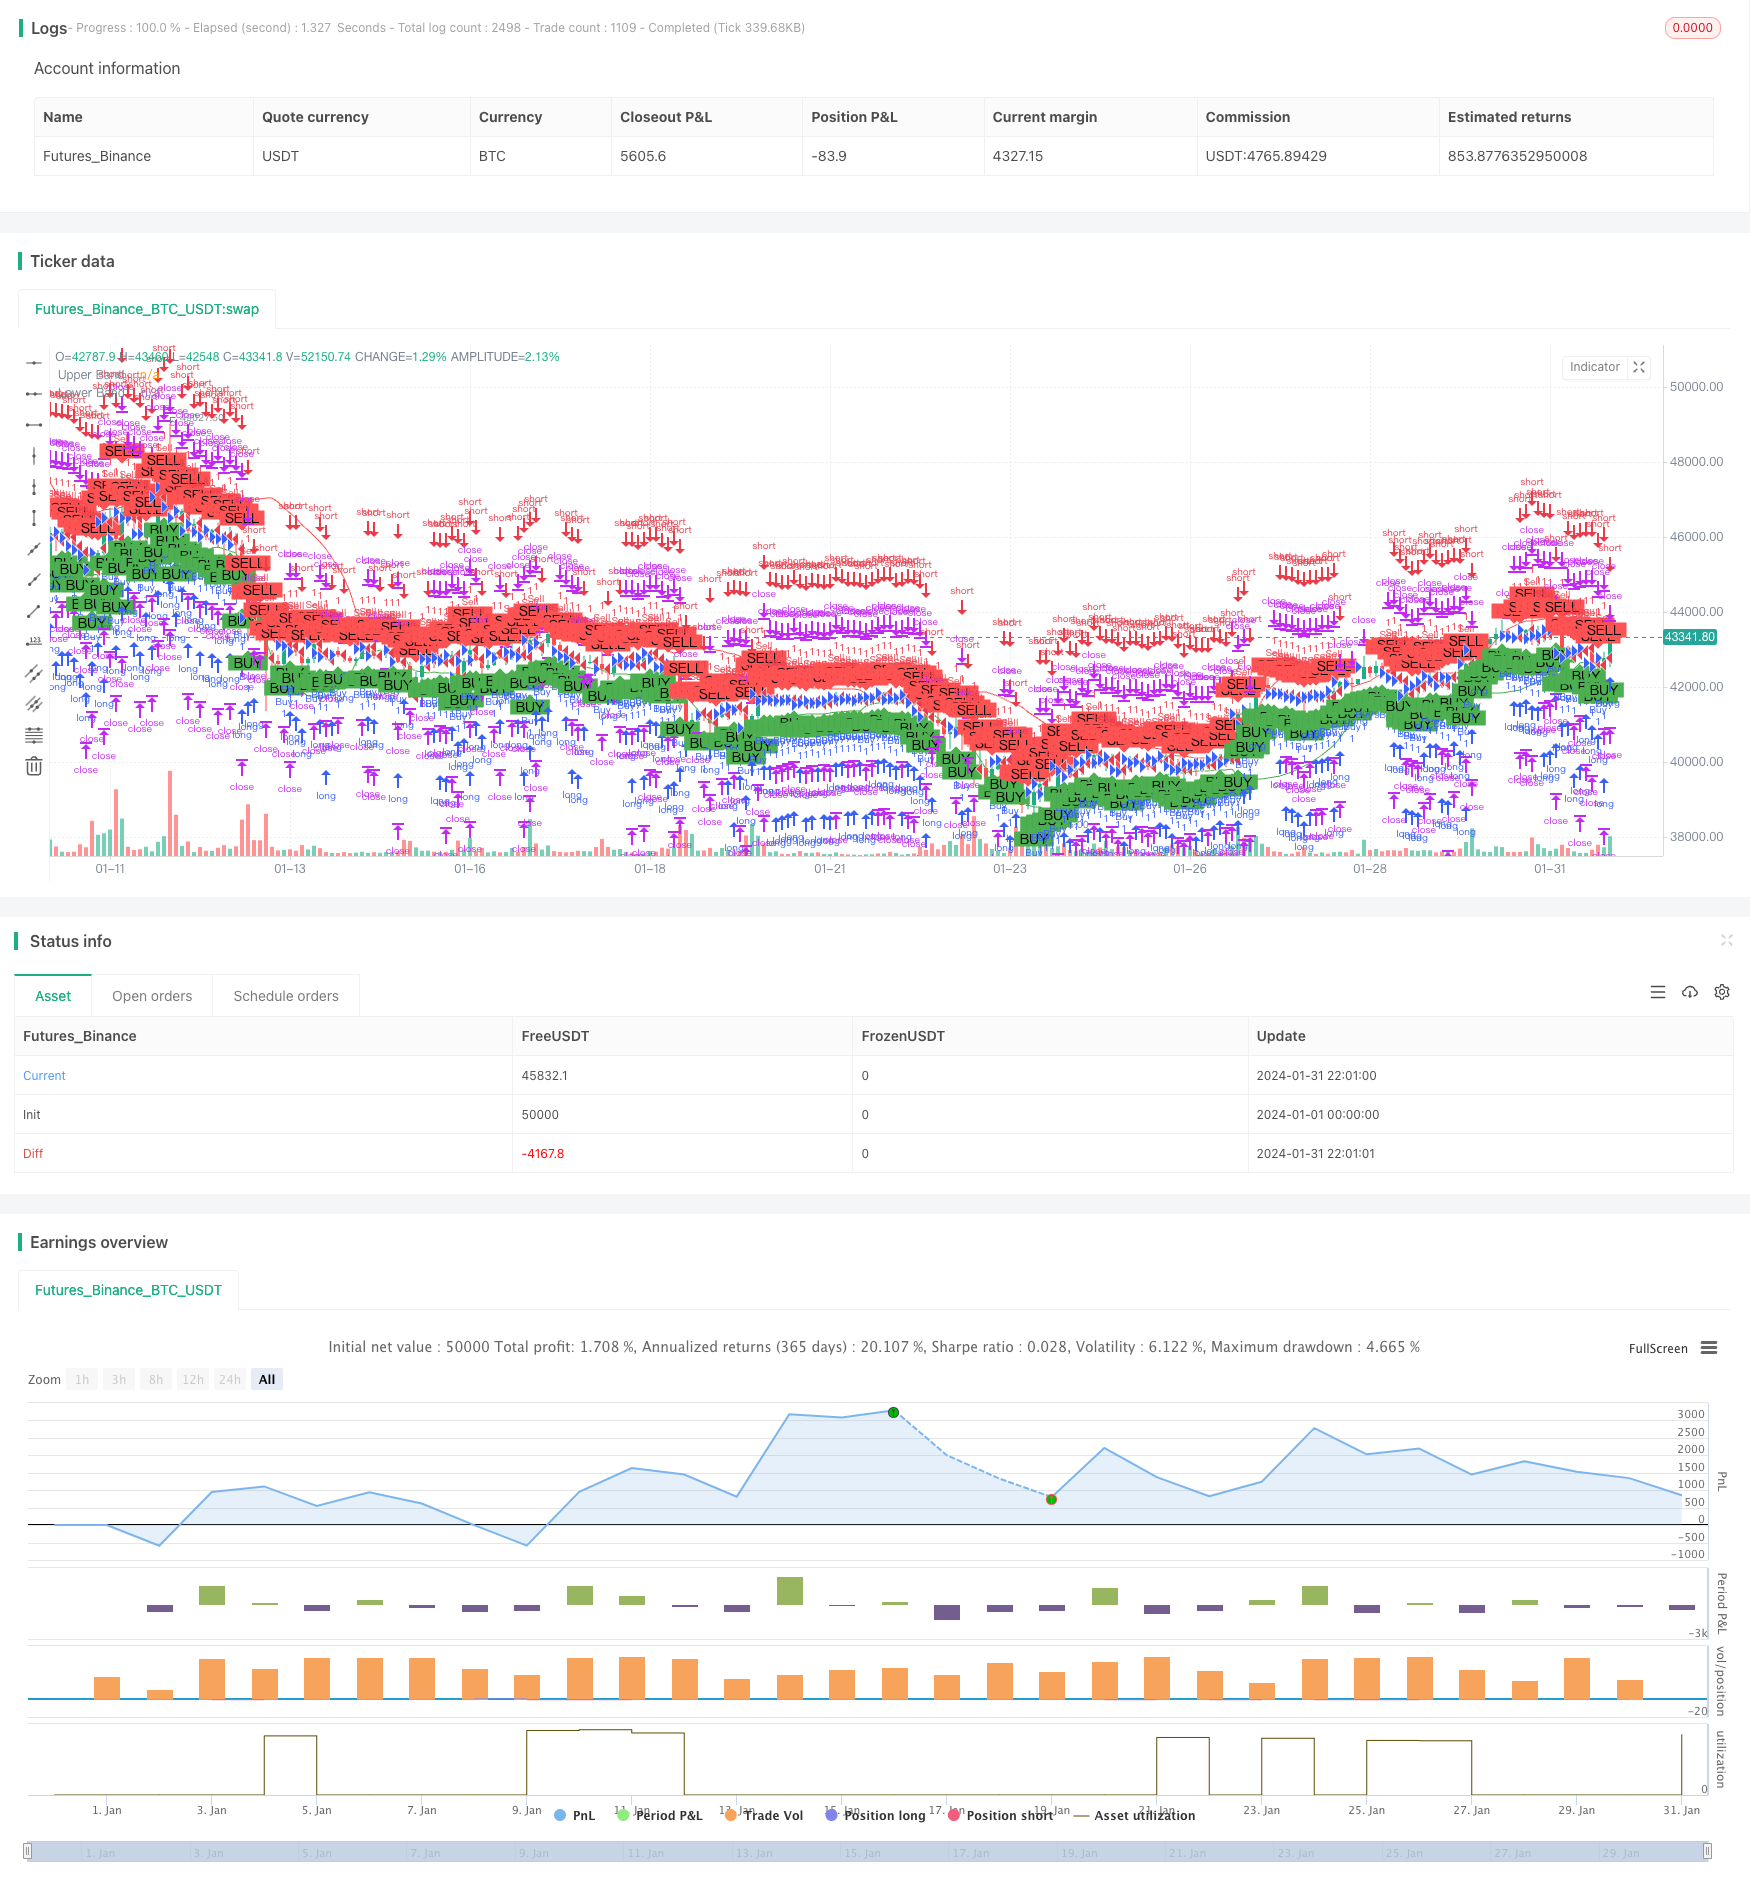
Overview
The double moving average and MACD combination trading strategy is a quantitative trading strategy that utilizes both moving averages and momentum indicators for trade signal generation and validation. By combining the trend-following capability of moving averages and the momentum characteristic of MACD, this strategy can effectively catch the contour of market trends through strict entry and exit criteria setting, while avoiding the risk of narrowed profit range or market fluctuation that may lead to reduced profit or even loss.
Strategy Logic
This strategy employs a combination of the 20-period simple moving average (SMA) and 5-period exponential moving average (EMA). The 20-period SMA can smooth market fluctuations effectively and determine mid- to long-term price trends, while the 5-period EMA assigns higher weights to recent prices and reacts sensitively to short-term price changes. Buy signals are generated when price crosses above the 5-period line while above the 20-period line, and sell signals are generated when price crosses below the 5-period line while below the 20-period line. Such double moving average combination ensures trade signals follow major trends while improving sensitivity and timeliness of signals through the introduction of short-term moving averages.
After trade signals are generated, the MACD indicator is introduced to validate the trend. Specifically, when buy signals are triggered, the MACD DIFF line needs to see a "golden cross" with the DEA line which is maintained for several periods to confirm an upward trend; conversely, when sell signals are triggered, a "dead cross" followed by a downward trend for several periods needs to be observed. This filters noise trades and avoids opening positions frequently during market consolidations.
Lastly, reasonable stop-loss levels are set for both long and short positions. The long stop-loss line is set below the lowest point since entry, while the short stop-loss line is set above the highest point since entry. The stop loss levels update dynamically with price fluctuations. Such stop loss method locks in profits to the largest extent and prevents unacceptable losses in case of serious market reversals.
Advantage Analysis
- Double moving averages effectively identify trading direction and avoid market noise interference
- MACD validation ensures established trend and prevents opening positions frequently during consolidations
- Strict stop loss strategy locks in profits to maximum extent and controls market risk
- Adjustable parameters allowing optimization based on market and product characterists
Risk Analysis
- Improper MACD parameter selection may miss shorter trends or intervene too frequently
- Moving average parameters need testing for optimum per product
- Stop loss may be penetrated in strong trending markets causing certain losses
MACD parameters can be adjusted for better cooperation. Also, moving average period parameters need optimization per product characterists. Finally, stop loss range can be loosened reasonably to allow full profit release for major directional moves.
Optimization Directions
Further optimizations can be pursued in the following directions for this strategy:
Introduce adaptive moving average algorithms. Dynamic period moving average combinations automatically adapt to markets without manual parameter tuning needs.
Incorporate machine learning models. Algorithms like deep learning can automatically identify market characterists of different products and output optimal parameter settings in real time.
Add supplementary filters. Other technical indicators can be introduced on top of current signals as auxiliary judgement standards, such as integrating volume factors.
Optimize stop loss strategies. More intelligent stop loss techniques like breakout stop loss and tracking stop loss should be researched, in order to obtain greater reward while controlling risk.
Summary
The double moving average and MACD combination strategy comprehensively considers aspects like trend, momentum, risk control beyond limitations of single technical indicators, and can effectively improve the stability of quantitative trading. This strategy adapts well to different market environments through parameter tuning and is well worth live application and continued optimization. Meanwhile, substantial room remains in incorporating more intelligent techniques for automated optimization and maximized strategy efficacy.
Parameters
| Name | Default | What it controls |
|---|---|---|
| v_input_1 | 3 | Risk-Reward Ratio |
Source Pine Script
/*backtest
start: 2024-01-01 00:00:00
end: 2024-01-31 23:59:59
period: 2h
basePeriod: 15m
exchanges: [{"eid":"Futures_Binance","currency":"BTC_USDT"}]
*/

//@version=5
strategy("Bollinger Band Strategy with Early Signal (v5)", overlay=true)

// Inputs
length = 20
mult = 1.5
src = close
riskRewardRatio = input(3.0, title="Risk-Reward Ratio")

// Calculating Bollinger Bands
basis = ta.ema(src, length)
dev = mult * ta.stdev(src, length)
upper = basis + dev
lower = basis - dev

// Plotting Bollinger Bands
plot(upper, "Upper Band", color=color.red)
plot(lower, "Lower Band", color=color.green)

// Tracking Two Candles Ago Crossing Bollinger Bands
var float twoCandlesAgoUpperCrossLow = na
var float twoCandlesAgoLowerCrossHigh = na

if (close[2] > upper[2])
    twoCandlesAgoUpperCrossLow := low[2]
if (close[2] < lower[2])
    twoCandlesAgoLowerCrossHigh := high[2]

// Entry Conditions
longCondition = (not na(twoCandlesAgoLowerCrossHigh)) and (high > twoCandlesAgoLowerCrossHigh)
shortCondition = (not na(twoCandlesAgoUpperCrossLow)) and (low < twoCandlesAgoUpperCrossLow)

// Plotting Entry Points
plotshape(longCondition, title="Buy Signal", location=location.belowbar, color=color.green, style=shape.labelup, text="BUY")
plotshape(shortCondition, title="Sell Signal", location=location.abovebar, color=color.red, style=shape.labeldown, text="SELL")

// Strategy Execution
if (longCondition)
    stopLoss = low - (high - low) * 0.05
    takeProfit = close + (close - stopLoss) * riskRewardRatio
    strategy.entry("Buy", strategy.long)
    strategy.exit("Exit Buy", "Buy", stop=stopLoss, limit=takeProfit)

if (shortCondition)
    stopLoss = high + (high - low) * 0.05
    takeProfit = close - (stopLoss - close) * riskRewardRatio
    strategy.entry("Sell", strategy.short)
    strategy.exit("Exit Sell", "Sell", stop=stopLoss, limit=takeProfit)
Published by ChaoZhang on the FMZ strategy square · last modified 2024-02-29. Collected in the Quant Trading Vault. Unvalidated research: re-test with your own data and costs before trusting it.
Build this with AgenKit
A spec is not a trading system. Paste this into your coding agent and AgenKit runs a specialist team — architecture, test-first build, risk gates, review — with paper trading on by default.
/agenkit build a production-grade trading bot with a backtest engine, risk controls and paper trading by default from strategies/Double-Moving-Average-and-MACD-Combination-Trading-Strategy.md- npx agenkit install engineering-kit in your project
- Paste the command into your agent and approve each phase
- Get tests, backtest, risk controls and a paper-trading switch
Understand it first
Before you run this, read the lesson behind the idea and how to backtest it honestly. Specs like this one are the survivors of an unknown number of trials; deflate their results accordingly.
Related specs
- Advanced 15 Minute Chart Trading Signal StrategyPine Script · Mean reversion · 3h
- CCTBBO Reversal Tracking StrategyPine Script · Mean reversion · 45m
- Bollinger Bands and VWAP based Quantitative Trading StrategyPine Script · Mean reversion · 1h
- MACD RSI and EMA StrategyPine Script · Mean reversion · 1d
- Multi Indicator Synergistic Trading Strategy with Bollinger Bands Fibonacci MACD and RSIPine Script · Mean reversion · 2h
- Reversal Catcher StrategyPine Script · Mean reversion · 1h