Double Rail Breakthrough Moving Average Crossover Strategy
The double rail breakthrough moving average crossover strategy is a trend-following quantitative trading strategy. The strategy uses a double rail mechanism to judge the market trend direction and combines moving…
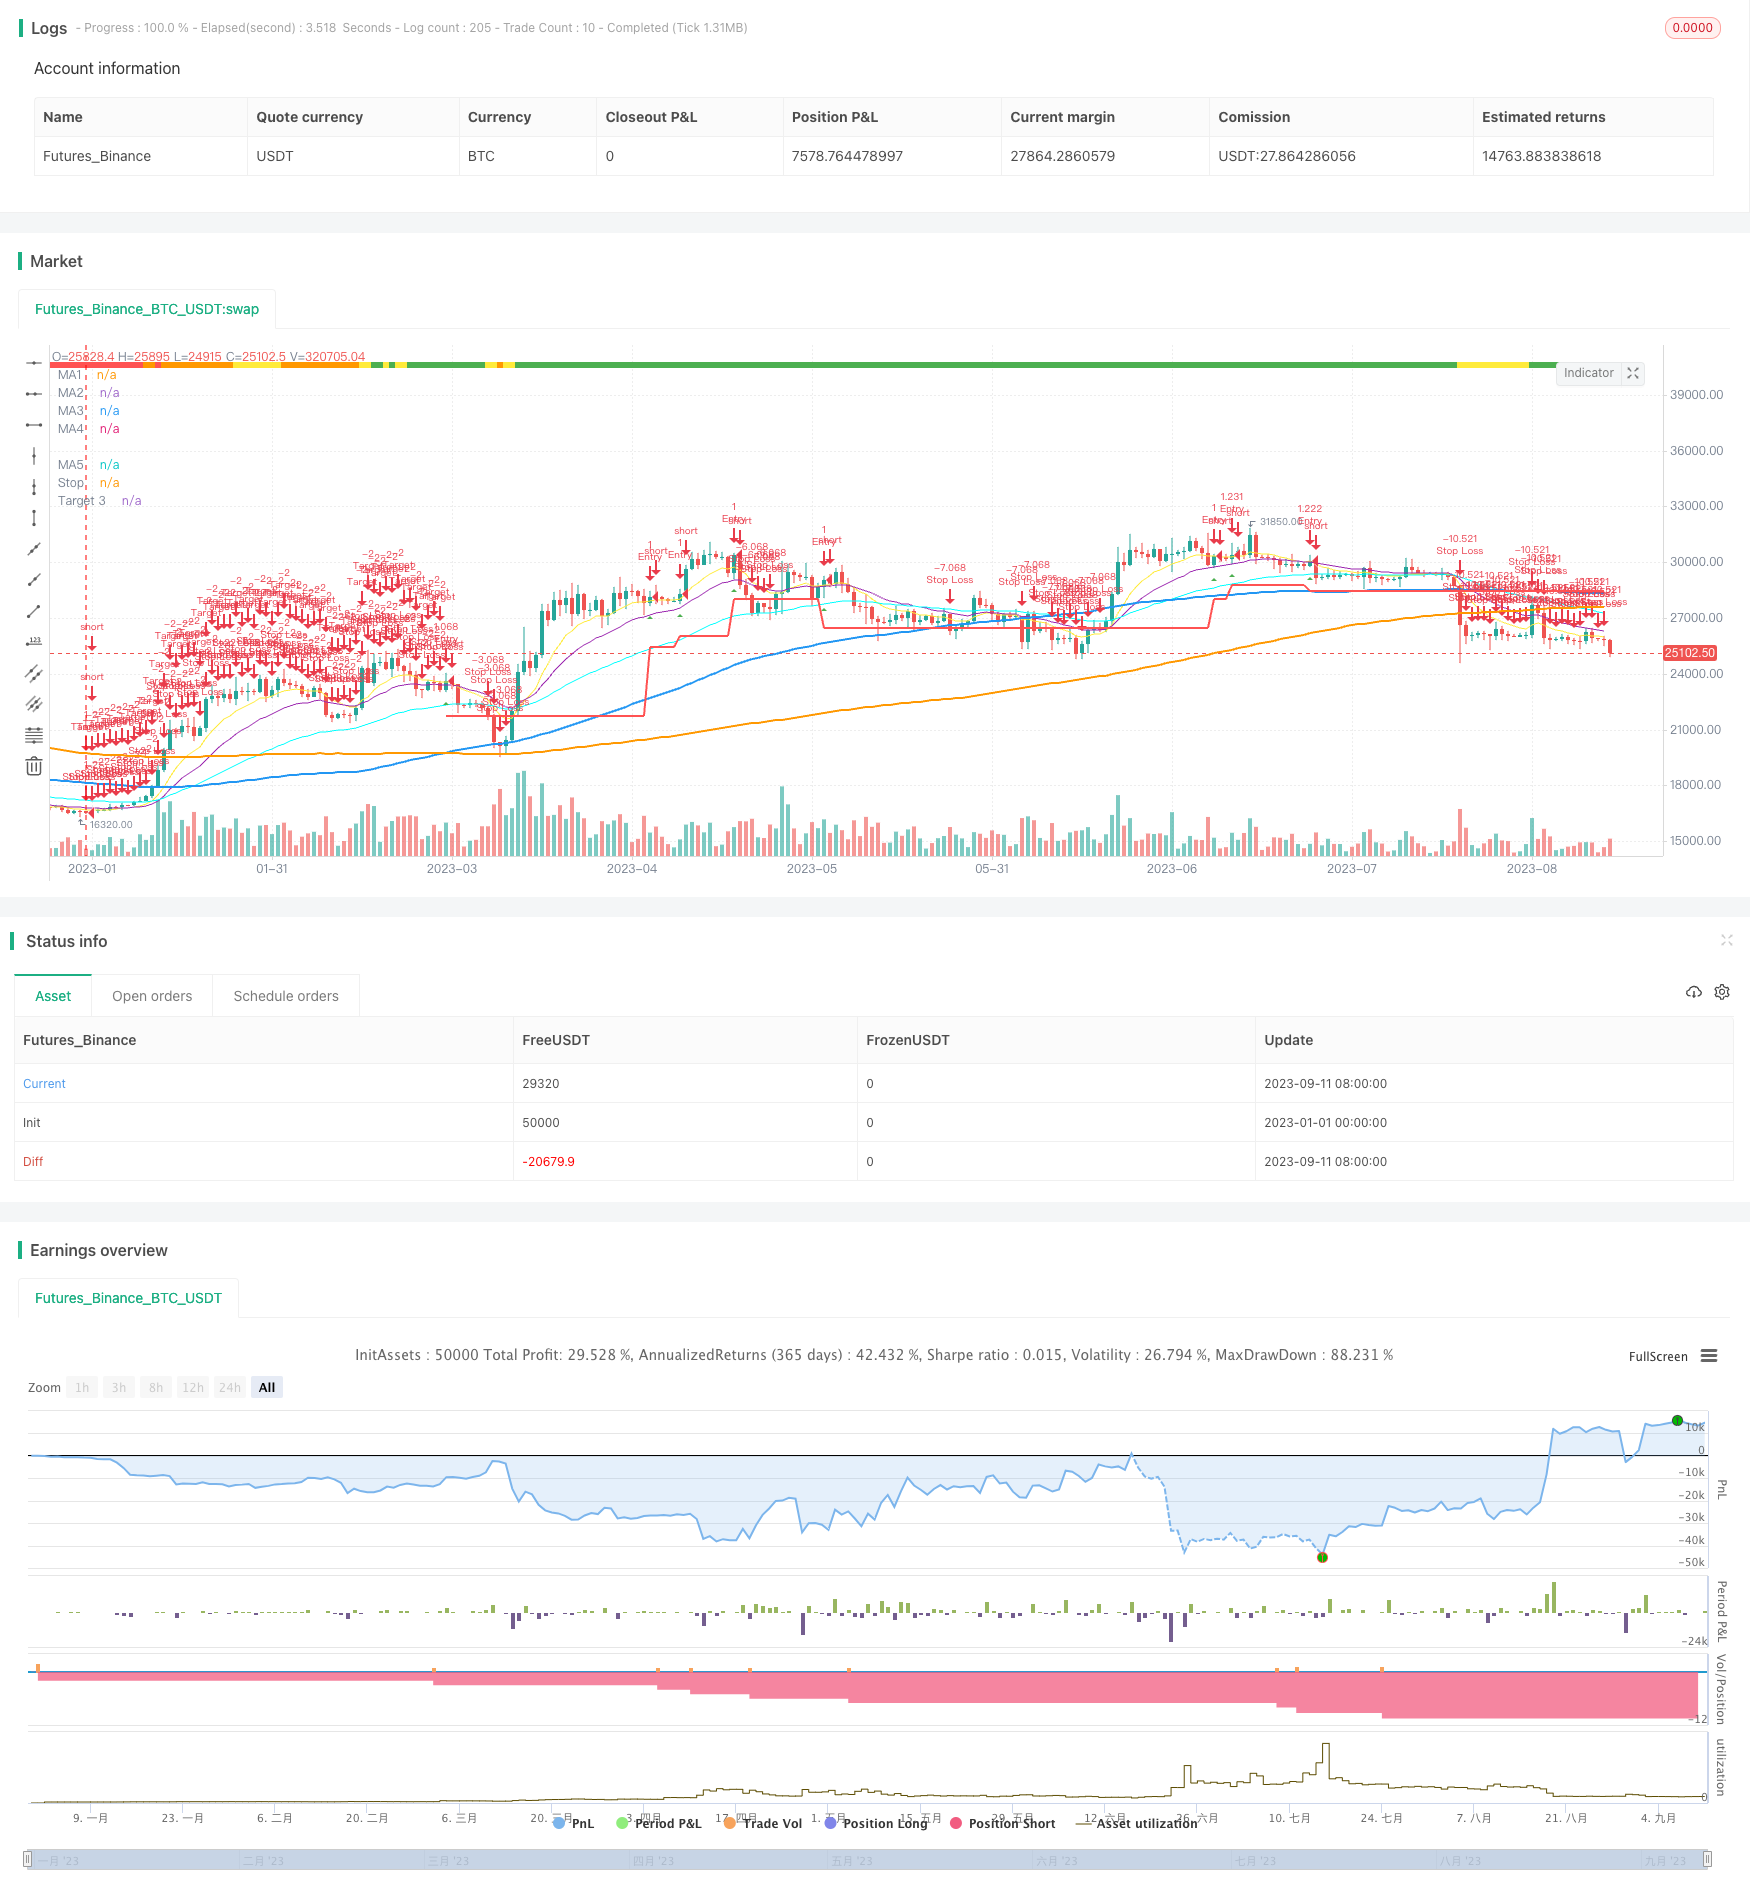
Overview
The double rail breakthrough moving average crossover strategy is a trend-following quantitative trading strategy. The strategy uses a double rail mechanism to judge the market trend direction and combines moving average crossover signals to enter the market. Specifically, the strategy uses moving averages of different cycles to build a double rail and judges the trend by whether the price breaks through the upper or lower rail; then it combines fast and slow moving average crossover signals to filter entry timing.
Strategy Principle
The double rail breakthrough moving average crossover strategy consists of the following parts:
Trend judgement module: Use moving averages of different cycles to build a double rail. When the price breaks through the upper rail, it is judged as an uptrend. When it breaks through the lower rail, it is judged as a downtrend.
Entry module: Go long when the fast moving average crosses above the medium and long moving average, and go short when it crosses below. It also needs to determine the trend direction.
Exit module: Close positions when the fast moving average crosses below the medium and long moving average.
The strategy first uses the Trend Required parameter to set the required trend strength. When the price breaks through the upper or lower rail, a trend is determined to have formed. Thereafter, go long when the fast moving average crosses above the medium and long moving average; go short when the fast moving average crosses below. Use the fast moving average crossing below the medium and long moving average as the exit signal after entering.
In addition, the strategy also has stop loss and take profit modules. The specific parameters can be adjusted and optimized to control risks and profits.
Advantage Analysis
Compared with single rail or single moving average strategies, the double rail breakthrough moving average crossover strategy combines trend judgment and entry timing selection, which can better grasp the market rhythm. The specific advantages are:
The double rail setting can more accurately determine the trend and avoid missing opportunities.
The moving average crossover filter can reduce the probability of doing reverse operations due to false breakouts.
Risk and return can be optimized by adjusting parameters.
The strategy logic is simple and clear, easy to understand and track.
Risk Analysis
The double rail breakthrough moving average crossover strategy also has some risks, mainly:
The double rail setting still cannot completely eliminate the probability of trend misjudgment.
Improper setting of moving average parameters may lead to excessively high trading frequency or reverse operations.
Overly loose stop loss points cannot effectively control single loss.
The corresponding solutions are:
Adjust double rail parameters appropriately to widen breakout judgment range.
Optimize moving average cycle portfolio to ensure reasonable trading frequency.
Test different levels of stop loss points to find optimal parameters.
Optimization Directions
The double rail breakthrough moving average crossover strategy also has the following optimizable directions:
Test different moving average cycle parameters to find optimal portfolio.
Try adding more moving averages to build a multi-moving average filtering system.
Test different stop loss algorithms, such as trailing stop loss, oscillating stop loss, etc.
Add compounding mechanism to optimize capital utilization efficiency.
Combine with other indicators for filtering, such as Bollinger Bands, KDJ, etc.
Summary
The double rail breakthrough moving average crossover strategy comprehensively considers trend judgment and entry timing selection, which can effectively grasp the market rhythm. Compared with single indicators, this strategy has the advantages of more accurate judgment and better filtering. By optimizing parameters and upgrading modules, it is expected to further improve the stability and profitability of the strategy.
Parameters
| Name | Default | What it controls |
|---|---|---|
| v_input_1 | 2015 | Start Year |
| v_input_2 | 0 | R Static or Percent: Static | Percent |
| v_input_3 | 2000 | R Size Static |
| v_input_4 | 3 | R Size Percent |
| v_input_5 | W | Trend Timeframe |
| v_input_6 | 26 | # of Bars for Trend |
| v_input_7 | 15 | Trend Growth % |
| v_input_8 | 0 | Trend Required: Orange | Yellow | Green | Red |
| v_input_9 | 10 | MA1 Period |
| v_input_10 | 0 | MA1 Type: EMA | SMA | WMA |
| v_input_11 | 20 | MA2 Period |
| v_input_12 | 0 | MA2 Type: EMA | SMA | WMA |
| v_input_13 | 50 | MA3 Period |
| v_input_14 | 0 | MA3 Type: EMA | SMA | WMA |
| v_input_15 | 100 | MA4 Period |
| v_input_16 | 0 | MA4 Type: SMA | EMA | WMA |
| v_input_17 | 200 | MA5 Period |
| v_input_18 | 0 | MA5 Type: SMA | EMA | WMA |
| v_input_19 | 0 | Enable Short MA Cross Filter: Yes | No |
| v_input_20 | 0 | Enable Long MA Cross Filter: Yes | No |
| v_input_21 | 2.5 | Stop ATR Multiple |
| v_input_22 | 3 | Target Multiple |
| v_input_23 | 0 | Enable ATR Stops: Yes | No |
| v_input_24 | 0 | Enable Stops: Yes | No |
| v_input_25 | 0 | Enable Targets: Yes | No |
| v_input_26 | 0 | Enable Early Exit: Yes | No |
Source Pine Script
/*backtest
start: 2023-01-01 00:00:00
end: 2023-09-12 00:00:00
period: 1d
basePeriod: 1h
exchanges: [{"eid":"Futures_Binance","currency":"BTC_USDT"}]
*/

//@version=4
//Author = Dustin Drummond https://www.tradingview.com/u/Dustin_D_RLT/
//Strategy based in part on original 10ema Basic Swing Trade Strategy by Matt Delong: https://www.tradingview.com/u/MattDeLong/
//Link to original 10ema Basic Swing Trade Strategy: https://www.tradingview.com/script/8yhGnGCM-10ema-Basic-Swing-Trade-Strategy/
//This is the Original EMAC - Exponential Moving Average Cross Strategy built as a class for reallifetrading dot com and so has all the default settings and has not been optimized
//I would not recomend using this strategy with the default settings and is for educational purposes only
//For the fully optimized version please come back around the same time tomorrow 6/16/21 for the EMAC - Exponential Moving Average Cross - Optimized
//EMAC - Exponential Moving Average Cross
strategy(title="EMAC - Exponential Moving Average Cross", shorttitle = "EMAC", overlay = true, calc_on_every_tick=false, default_qty_value = 100, initial_capital = 100000, default_qty_type = strategy.fixed, pyramiding = 0, process_orders_on_close=true)
//creates a time filter to prevent "too many orders error" and allows user to see Strategy results per year by changing input in settings in Stratey Tester
startYear = input(2015, title="Start Year", minval=1980, step=1)
timeFilter = (year >= startYear) and (month >= 1) and (dayofmonth >= 1)
//R Size (Risk Amount)
rStaticOrPercent = input(title="R Static or Percent", defval="Static", options=["Static", "Percent"])
rSizeStatic = input(2000, title="R Size Static", minval=1, step=100)
rSizePercent = input(3, title="R Size Percent", minval=.01, step=.01)
rSize = rStaticOrPercent == "Static" ? rSizeStatic : rStaticOrPercent == "Percent" ? (rSizePercent * .01 * strategy.equity) : 1
//Recent Trend Indicator "See the standalone version for detailed description"
res = input(title="Trend Timeframe", type=input.resolution, defval="W")
trend = input(26, minval=1, title="# of Bars for Trend")
trendMult = input(15, minval=0, title="Trend Growth %", step=.25) / 100
currentClose = security(syminfo.tickerid, res, close)
pastClose = security(syminfo.tickerid, res, close[trend])
//Trend Indicator
upTrend = (currentClose >= (pastClose * (1 + trendMult)))
downTrend = (currentClose <= (pastClose * (1 - trendMult)))
sidewaysUpTrend = (currentClose < (pastClose * (1 + trendMult)) and (currentClose > pastClose))
sidewaysDownTrend = (currentClose > (pastClose * (1 - trendMult)) and (currentClose < pastClose))
//Plot Trend on Chart
plotshape(upTrend, "Up Trend", style=shape.square, location=location.top, color=color.green, size=size.small)
plotshape(downTrend, "Down Trend", style=shape.square, location=location.top, color=color.red, size=size.small)
plotshape(sidewaysUpTrend, "Sideways Up Trend", style=shape.square, location=location.top, color=color.yellow, size=size.small)
plotshape(sidewaysDownTrend, "Sideways Down Trend", style=shape.square, location=location.top, color=color.orange, size=size.small)
//What trend signals to use in entrySignal
trendRequired = input(title="Trend Required", defval="Orange", options=["Green", "Yellow", "Orange", "Red"])
goTrend = trendRequired == "Orange" ? upTrend or sidewaysUpTrend or sidewaysDownTrend : trendRequired == "Yellow" ? upTrend or sidewaysUpTrend : trendRequired == "Green" ? upTrend : trendRequired == "Red" ? upTrend or sidewaysUpTrend or sidewaysDownTrend or downTrend : na
//MAs Inputs Defalt is 10 EMA, 20 EMA, 50 EMA, 100 SMA and 200 SMA
ma1Length = input(10, title="MA1 Period", minval=1, step=1)
ma1Type = input(title="MA1 Type", defval="EMA", options=["SMA", "EMA", "WMA"])
ma2Length = input(20, title="MA2 Period", minval=1, step=1)
ma2Type = input(title="MA2 Type", defval="EMA", options=["SMA", "EMA", "WMA"])
ma3Length = input(50, title="MA3 Period", minval=1, step=1)
ma3Type = input(title="MA3 Type", defval="EMA", options=["SMA", "EMA", "WMA"])
ma4Length = input(100, title="MA4 Period", minval=1, step=1)
ma4Type = input(title="MA4 Type", defval="SMA", options=["SMA", "EMA", "WMA"])
ma5Length = input(200, title="MA5 Period", minval=1, step=1)
ma5Type = input(title="MA5 Type", defval="SMA", options=["SMA", "EMA", "WMA"])
//MAs defined
ma1 = ma1Type == "EMA" ? ema(close, ma1Length) : ma1Type == "SMA" ? sma(close, ma1Length) : wma(close, ma1Length)
ma2 = ma2Type == "EMA" ? ema(close, ma2Length) : ma2Type == "SMA" ? sma(close, ma2Length) : wma(close, ma2Length)
ma3 = ma3Type == "EMA" ? ema(close, ma3Length) : ma3Type == "SMA" ? sma(close, ma3Length) : wma(close, ma3Length)
ma4 = ma4Type == "SMA" ? sma(close, ma4Length) : ma4Type == "EMA" ? ema(close, ma4Length) : wma(close, ma4Length)
ma5 = ma5Type == "SMA" ? sma(close, ma5Length) : ma5Type == "EMA" ? ema(close, ma5Length) : wma(close, ma5Length)
//Plot MAs
plot(ma1, title="MA1", color=color.yellow, linewidth=1, style=plot.style_line)
plot(ma2, title="MA2", color=color.purple, linewidth=1, style=plot.style_line)
plot(ma3, title="MA3", color=#00FFFF, linewidth=1, style=plot.style_line)
plot(ma4, title="MA4", color=color.blue, linewidth=2, style=plot.style_line)
plot(ma5, title="MA5", color=color.orange, linewidth=2, style=plot.style_line)
//Allows user to toggle on/off ma1 > ma2 filter
enableShortMAs = input(title="Enable Short MA Cross Filter", defval="Yes", options=["Yes", "No"])
shortMACross = enableShortMAs == "Yes" and ma1 > ma2 or enableShortMAs == "No"
//Allows user to toggle on/off ma4 > ma5 filter
enableLongMAs = input(title="Enable Long MA Cross Filter", defval="Yes", options=["Yes", "No"])
longMACross = enableLongMAs == "Yes" and ma4 >= ma5 or enableLongMAs == "No"
//Entry Signals
entrySignal = (strategy.position_size <= 0 and close[1] < ma1[1] and close > ma1 and close > ma2 and close > ma3 and shortMACross and ma1 > ma3 and longMACross and goTrend)
secondSignal = (strategy.position_size > 0 and close[1] < ma1[1] and close > ma1 and close > ma2 and close > ma3 and shortMACross and ma1 > ma3 and longMACross and goTrend)
plotshape(entrySignal, style=shape.triangleup, location=location.belowbar, color=color.green, size=size.small)
plotshape(secondSignal, style=shape.triangleup, location=location.belowbar, color=color.lime, size=size.small)
//ATR for Stops
atrValue = (atr(14))
//to test ATR enable next line
//plot(atrValue, linewidth=1, color=color.black, style=plot.style_line)
atrMult = input(2.5, minval=.25, step=.25, title="Stop ATR Multiple")
//Only target3Mult is used in current strategy target1 and target2 might be used in the future with pyramiding
//target1Mult = input(1.0, minval=.25, step=.25, title="Targert 1 Multiple")
//target2Mult = input(2.0, minval=.25, step=.25, title="Targert 2 Multiple")
target3Mult = input(3.0, minval=.25, step=.25, title="Target Multiple")
enableAtrStop = input(title="Enable ATR Stops", defval="Yes", options=["Yes", "No"])
//Intitial Recomended Stop Location
atrStop = entrySignal and ((high - (atrMult * atrValue)) < low) ? (high - (atrMult * atrValue)) : low
//oneAtrStop is used for testing only enable next 2 lines to test
//oneAtrStop = entrySignal ? (high - atrValue) : na
//plot(oneAtrStop, "One ATR Stop", linewidth=2, color=color.orange, style=plot.style_linebr)
initialStop = entrySignal and enableAtrStop == "Yes" ? atrStop : entrySignal ? low : na
//Stops changed to stoploss to hold value for orders the next line is old code "bug"
//plot(initialStop, "Initial Stop", linewidth=2, color=color.red, style=plot.style_linebr)
//Set Initial Stop and hold value "debug code"
stoploss = valuewhen(entrySignal, initialStop, 0)
plot(stoploss, title="Stop", linewidth=2, color=color.red)
enableStops = input(title="Enable Stops", defval="Yes", options=["Yes", "No"])
yesStops = enableStops == "Yes" ? 1 : enableStops == "No" ? 0 : na
//Calculate size of trade based on R Size
//Original buggy code:
//positionSize = (rSize/(close - initialStop))
//Added a minimum order size of 1 "debug code"
positionSize = (rSize/(close - initialStop)) > 1 ? (rSize/(close - initialStop)) : 1
//Targets
//Enable or Disable Targets
enableTargets = input(title="Enable Targets", defval="Yes", options=["Yes", "No"])
yesTargets = enableTargets == "Yes" ? 1 : enableTargets == "No" ? 0 : na
//Only target3 is used in current strategy target1 and target2 might be used in the future with pyramiding
//target1 = entrySignal ? (close + ((close - initialStop) * target1Mult)) : na
//target2 = entrySignal ? (close + ((close - initialStop) * target2Mult)) : na
target3 = entrySignal ? (close + ((close - initialStop) * target3Mult)) : na
//plot(target1, "Target 1", linewidth=2, color=color.green, style=plot.style_linebr)
//plot(target2, "Target 2", linewidth=2, color=color.green, style=plot.style_linebr)
plot(target3, "Target 3", linewidth=2, color=color.green, style=plot.style_linebr)
//Set Target and hold value "debug code"
t3 = valuewhen(entrySignal, target3, 0)
//To test t3 and see plot enable next line
//plot(t3, title="Target", linewidth=2, color=color.green)
//MA1 Cross Exit
enableEarlyExit = input(title="Enable Early Exit", defval="Yes", options=["Yes", "No"])
earlyExit = enableEarlyExit == "Yes" ? 1 : enableEarlyExit == "No" ? 0 : na
ma1CrossExit = strategy.position_size > 0 and close < ma1
//Entry Order
strategy.order("Entry", long = true, qty = positionSize, when = (strategy.position_size <= 0 and entrySignal and timeFilter))
//Early Exit Order
strategy.close_all(when = ma1CrossExit and timeFilter and earlyExit, comment = "MA1 Cross Exit")
//Stop and Target Orders
//strategy.cancel orders are needed to prevent bug with Early Exit Order
strategy.order("Stop Loss", false, qty = strategy.position_size, stop=stoploss, oca_name="Exit",when = timeFilter and yesStops, comment = "Stop Loss")
strategy.cancel("Stop Loss", when = ma1CrossExit and timeFilter and earlyExit)
strategy.order("Target", false, qty = strategy.position_size, limit=t3, oca_name="Exit",  when = timeFilter and yesTargets, comment = "Target")
strategy.cancel("Target", when = ma1CrossExit and timeFilter and earlyExit)Published by ChaoZhang on the FMZ strategy square · last modified 2023-12-07. Collected in the Quant Trading Vault. Unvalidated research: re-test with your own data and costs before trusting it.
Build this with AgenKit
A spec is not a trading system. Paste this into your coding agent and AgenKit runs a specialist team — architecture, test-first build, risk gates, review — with paper trading on by default.
/agenkit build a production-grade trading bot with a backtest engine, risk controls and paper trading by default from strategies/Double-Rail-Breakthrough-Moving-Average-Crossover-Strategy.md- npx agenkit install engineering-kit in your project
- Paste the command into your agent and approve each phase
- Get tests, backtest, risk controls and a paper-trading switch
Understand it first
Before you run this, read the lesson behind the idea and how to backtest it honestly. Specs like this one are the survivors of an unknown number of trials; deflate their results accordingly.
Related specs
- BB Breakout StrategyPine Script · Breakout · 1d
- Donchian Channel and Larry Williams Large Trade Index StrategyPine Script · Breakout · 1m
- Dual Breakout Volatility Channel StrategyPine Script · Breakout · 1h
- Dual MA Momentum Breakout StrategyPine Script · Breakout · 1h
- EMA and Bollinger Bands Breakout StrategyPine Script · Breakout · 1h
- Flexible Long Short Trading Strategy Based on Keltner ChannelsPine Script · Breakout · 1d