Dow Theory Trend Adaptive Momentum Strategy
The Dow Theory Trend Adaptive Momentum Strategy is an advanced trading method based on classic Dow Theory principles that guides trading decisions by identifying key turning points in market trends. This strategy…
Overview
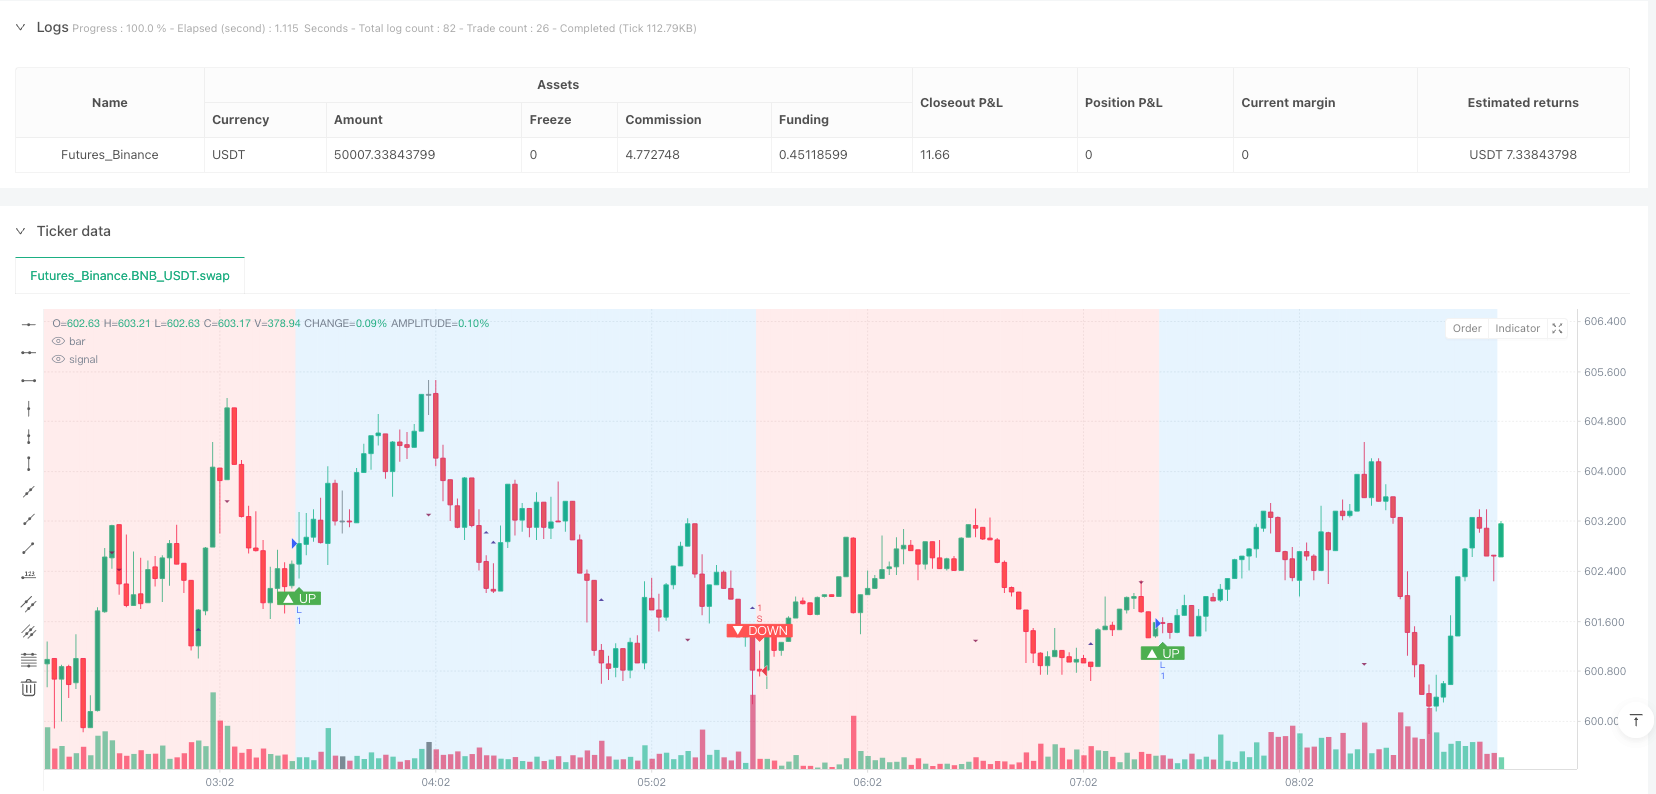
The Dow Theory Trend Adaptive Momentum Strategy is an advanced trading method based on classic Dow Theory principles that guides trading decisions by identifying key turning points in market trends. This strategy focuses on detecting and confirming the fundamental dynamics of price trends, using higher highs and higher lows to define uptrends and lower highs and lower lows to define downtrends. This approach aims to provide a systematic approach to capture market trends and respond promptly when trends change.
Strategy Principle
The core principle of this strategy is based on the classic trend identification method based on Dow Theory. The strategy usesta.pivothigh()andta.pivotlow()function to detect key turning points. Specific implementation includes the following key steps:
- Turning point detection: Use the pivotLookback parameter to determine the number of bars on the left and right sides, which is used to identify high points and low points.
- Trend Confirmation: An uptrend is confirmed only when the conditions of higher highs and higher lows are met simultaneously; similarly, a downtrend is confirmed only when the conditions of lower highs and lower lows are met simultaneously.
- Trend persistence: If the trend transition condition is not met, the strategy will maintain the previous trend state, allowing for smoother trend following.
Strategy Advantages
- Dynamic trend identification: By continuously analyzing key turning points, the strategy can dynamically capture changes in market trends.
- Flexible Trading Modes: Offers three trading modes: automatic, long-only, and short-only, to meet the needs of different traders.
- Risk management: Built-in stop-loss and take-profit mechanisms can effectively control the risk of a single transaction.
- Visualization Trend: Intuitively display the trend direction through background color and markers, making it easier for traders to quickly understand the market status.
- Low latency: Compared with traditional moving average strategies, this method can respond to trend changes faster.
Strategy Risks
- Lagging risk: Due to the use of turning point detection, the strategy has inherent lag risk and may not be able to capture the earliest signal of the trend.
- Volatility Market Risk: In markets with low volatility, frequent small price movements may lead to unnecessary trades.
- Parameter sensitivity: The choice of pivotLookback parameters has a greater impact on strategy performance and needs to be adjusted for different markets and time frames.
- Transaction costs: Frequent transactions may result in higher transaction costs, especially if the commission rate is high.
Strategy optimization direction
- Introduce additional filters: combine trend strength indicators (such as ATR) to filter weak trend signals.
- Dynamic Parameter Adjustment: Develop an adaptive pivotLookback parameter mechanism based on market volatility.
- Multi-time frame verification: Cross-validate trend signals on different time frames to improve signal reliability.
- Machine learning enhanced: Explore using machine learning algorithms to optimize trend recognition and entry timing.
- Risk management optimization: dynamically adjust stop-loss and take-profit distance based on market volatility.
Summary
The Dow Theory Trend Adaptive Momentum Strategy is a powerful trend following method that provides traders with a systematic trend identification tool through innovative turning point analysis technology. Although there are some inherent risks, its flexibility and dynamic nature make it a valuable approach in modern quantitative trading strategies. Successful application of this strategy requires a deep understanding of how it works and continuous optimization and adjustment based on specific market circumstances.
Overview
The Dow Theory Trend Adaptive Momentum Strategy is an advanced trading approach based on classic Dow Theory principles, designed to guide trading decisions by identifying key turning points in market trends. The strategy focuses on detecting and confirming the fundamental dynamics of price trends, using Higher Highs and Higher Lows to define uptrends, and Lower Highs and Lower Lows to define downtrends. This method aims to provide a systematic approach to capturing market trends and responding promptly when trends change.
Strategy Principles
The core principle of this strategy is based on the classic Dow Theory trend identification method. The strategy detects key turning points using ta.pivothigh() and ta.pivotlow() functions. Specific implementation includes the following key steps:
- Turning Point Detection: Use the pivotLookback parameter to determine the number of bars on both sides for identifying highs and lows.
- Trend Confirmation: An uptrend is confirmed only when both Higher Highs and Higher Lows conditions are met; similarly, a downtrend is confirmed only when both Lower Highs and Lower Lows conditions are satisfied.
- Trend Persistence: If trend conversion conditions are not met, the strategy maintains the previous trend state, achieving smoother trend tracking.
Strategy Advantages
- Dynamic Trend Identification: By continuously analyzing key turning points, the strategy can dynamically capture market trend changes.
- Flexible Trading Modes: Provides three trading modes - automatic, long-only, and short-only - to meet different traders' needs.
- Risk Management: Built-in stop-loss and take-profit mechanisms effectively control the risk of individual trades.
- Trend Visualization: Intuitively displays trend direction through background colors and markers, making it easy for traders to understand market conditions.
- Low Latency: Compared to traditional moving average strategies, this method can respond to trend changes more quickly.
Strategy Risks
- Lag Risk: Due to using pivot point detection, the strategy inherently carries a lag risk and may not capture the earliest trend signals.
- Ranging Market Risk: In markets with unclear fluctuations, frequent small price changes may lead to unnecessary trades.
- Parameter Sensitivity: The choice of pivotLookback parameter significantly impacts strategy performance and requires adjustment for different markets and timeframes.
- Trading Costs: Frequent trading may result in high transaction costs, especially with higher commission rates.
Strategy Optimization Directions
- Introduce Additional Filters: Combine trend strength indicators (such as ATR) to filter weak trend signals.
- Dynamic Parameter Adjustment: Develop an adaptive pivotLookback parameter mechanism based on market volatility.
- Multi-Timeframe Verification: Cross-verify trend signals across different timeframes to improve signal reliability.
- Machine Learning Enhancement: Explore using machine learning algorithms to optimize trend identification and entry timing.
- Risk Management Optimization: Dynamically adjust stop-loss and take-profit distances based on market volatility.
Conclusion
The Dow Theory Trend Adaptive Momentum Strategy is a powerful trend-following method that provides traders with a systematic trend identification tool through innovative turning point analysis techniques. Despite some inherent risks, its flexibility and dynamism make it a valuable approach in modern quantitative trading strategies. Successfully applying this strategy requires a deep understanding of its working principles and continuous optimization and adjustment based on specific market environments.
Source Pine Script
/*backtest
start: 2025-03-29 00:00:00
end: 2025-03-30 09:00:00
period: 2m
basePeriod: 2m
exchanges: [{"eid":"Futures_Binance","currency":"BNB_USDT"}]
*/

//@version=5
// strategy(title="Dow Theory Trend Strategy v3", shorttitle="Dow Trend Strat v3", overlay=true,
//      initial_capital=10000, default_qty_type=strategy.percent_of_equity, default_qty_value=10,
//      commission_type=strategy.commission.percent, commission_value=0.1, // Example strategy settings with commission
//      process_orders_on_close=true) // Consider processing on bar close for more stable backtests
strategy(title="Dow Theory Trend Strategy v3", shorttitle="Dow Trend Strat v3", overlay=true) // Basic strategy settings

// --- Settings ---
// Calculation Settings
pivotLookback = input.int(10, title="Pivot Lookback Period", minval=1, tooltip="ピボットハイ/ローをDetectionするためのAroundのバーのNumber", group="Calculation Settings")

// Display Settings
showPivotPoints = input.bool(true, title="Show Pivot Points", tooltip="ピボットハイ/ローのポイントをDisplayします", group="Display Settings")
showTrendChange = input.bool(true, title="Show Trend Change Signals", tooltip="トレンドConversionのシグナル(エントリーポイント)をDisplayします", group="Display Settings")

// Strategy Settings
// --- Manual Trend Override (Array Definitionを input InsideにChange) ---
manualTrendMode = input.string("Auto", title="Manual Trend Mode",
     options=["Auto", "Long Only", "Short Only"], // オプションをここでDirect Definition
     tooltip="Manually specify the trading direction (Auto: follows Dow Theory)う, Long Only: ロングのみ, Short Only: ショートのみ)",
     group="Strategy Settings")

// Risk Management Settings
useStopLoss = input.bool(true, title="Use Stop Loss", group="Risk Management")
stopLossTicks = input.float(100, title="Stop Loss (Ticks)", minval=1, group="Risk Management", tooltip="エントリーPriceからのストップロスまでのティック(Minimum Value Movementき)Number. Example:EURUSDで20 pips (tick=0.00001)なら200.")
useTakeProfit = input.bool(true, title="Use Take Profit", group="Risk Management")
takeProfitTicks = input.float(200, title="Take Profit (Ticks)", minval=1, group="Risk Management", tooltip="エントリーPriceからのテイクプロフィットまでのティック(Minimum Value Movementき)Number. Example:EURUSDで40 pips (tick=0.00001)なら400.")

// --- ピボットハイ/ローのDetection ---
pivotHighPrice = ta.pivothigh(high, pivotLookback, pivotLookback)
pivotLowPrice = ta.pivotlow(low, pivotLookback, pivotLookback)

// --- ピボットポイントのValueをMaintainするためのVariable ---
var float lastPivotHigh = na
var float prevPivotHigh = na
var float lastPivotLow = na
var float prevPivotLow = na
var int lastPivotHighBar = na
var int prevPivotHighBar = na
var int lastPivotLowBar = na
var int prevPivotLowBar = na

// --- NewしいピボットがConfirmしたかどうかのDetectionとValueのUpdate ---
if not na(pivotHighPrice)
    if na(lastPivotHigh) or pivotHighPrice != lastPivotHigh
        prevPivotHigh := lastPivotHigh
        prevPivotHighBar := lastPivotHighBar
        lastPivotHigh := pivotHighPrice
        lastPivotHighBar := bar_index - pivotLookback

if not na(pivotLowPrice)
    if na(lastPivotLow) or pivotLowPrice != lastPivotLow
        prevPivotLow := lastPivotLow
        prevPivotLowBar := lastPivotLowBar
        lastPivotLow := pivotLowPrice
        lastPivotLowBar := bar_index - pivotLookback

// --- ダウTheoryにBaseづくトレンドJudgment (Improved version) ---
var int trendDirection = 0
bool hasEnoughPivots = not na(lastPivotHigh) and not na(prevPivotHigh) and not na(lastPivotLow) and not na(prevPivotLow)

if hasEnoughPivots
    isHigherHigh = lastPivotHigh > prevPivotHigh
    isHigherLow = lastPivotLow > prevPivotLow
    isUptrendConfirmed = isHigherHigh and isHigherLow

    isLowerHigh = lastPivotHigh < prevPivotHigh
    isLowerLow = lastPivotLow < prevPivotLow
    isDowntrendConfirmed = isLowerHigh and isLowerLow

    if isUptrendConfirmed
        trendDirection := 1
    else if isDowntrendConfirmed
        trendDirection := -1
    else
        trendDirection := trendDirection[1]

// --- トレンドConversionのDetection ---
bool trendChanged = ta.change(trendDirection) != 0
bool changedToUp = trendChanged and trendDirection == 1
bool changedToDown = trendChanged and trendDirection == -1

// --- Drawing Process ---
bgcolor(trendDirection == 1 ? color.new(color.blue, 85) : trendDirection == -1 ? color.new(color.red, 85) : color.new(color.gray, 90), title="Trend Background")
plotshape(showPivotPoints and not na(pivotHighPrice), title="Pivot High", location=location.abovebar, color=color.new(color.maroon, 20), style=shape.triangledown, size=size.tiny, offset=-pivotLookback)
plotshape(showPivotPoints and not na(pivotLowPrice), title="Pivot Low", location=location.belowbar, color=color.new(color.navy, 20), style=shape.triangleup, size=size.tiny, offset=-pivotLookback)
plotshape(showTrendChange and changedToUp, title="Uptrend Start Signal", location=location.belowbar, color=color.new(color.green, 0), style=shape.labelup, text="▲ UP", textcolor=color.white, size=size.small)
plotshape(showTrendChange and changedToDown, title="Downtrend Start Signal", location=location.abovebar, color=color.new(color.red, 0), style=shape.labeldown, text="▼ DOWN", textcolor=color.white, size=size.small)

// --- ストラテジーロジック ---
bool allowLong = manualTrendMode == "Auto" or manualTrendMode == "Long Only"
bool allowShort = manualTrendMode == "Auto" or manualTrendMode == "Short Only"

if (changedToUp and allowLong)
    strategy.entry("L", strategy.long, comment="Go Long")
    if (useStopLoss or useTakeProfit)
        float slValue = useStopLoss and stopLossTicks > 0 ? stopLossTicks : na
        float tpValue = useTakeProfit and takeProfitTicks > 0 ? takeProfitTicks : na
        strategy.exit("LX", from_entry="L", loss=slValue, profit=tpValue, comment_loss="SL Long", comment_profit="TP Long")

if (changedToDown and allowShort)
    strategy.entry("S", strategy.short, comment="Go Short")
    if (useStopLoss or useTakeProfit)
        float slValue = useStopLoss and stopLossTicks > 0 ? stopLossTicks : na
        float tpValue = useTakeProfit and takeProfitTicks > 0 ? takeProfitTicks : na
        strategy.exit("SX", from_entry="S", loss=slValue, profit=tpValue, comment_loss="SL Short", comment_profit="TP Short")

// --- デバッグUse ---
// plot(trendDirection, title="Trend Direction Value")Published by ianzeng123 on the FMZ strategy square · last modified 2025-04-03. Collected in the Quant Trading Vault. Unvalidated research: re-test with your own data and costs before trusting it.
Build this with AgenKit
A spec is not a trading system. Paste this into your coding agent and AgenKit runs a specialist team — architecture, test-first build, risk gates, review — with paper trading on by default.
/agenkit build a production-grade trading bot with a backtest engine, risk controls and paper trading by default from strategies/Dow-Theory-Trend-Adaptive-Momentum-Strategy.md- npx agenkit install engineering-kit in your project
- Paste the command into your agent and approve each phase
- Get tests, backtest, risk controls and a paper-trading switch
Understand it first
Before you run this, read the lesson behind the idea and how to backtest it honestly. Specs like this one are the survivors of an unknown number of trials; deflate their results accordingly.
Related specs
- Dynamic Trend Momentum Optimization Strategy with G Channel IndicatorPine Script · Momentum · 1h
- KST EMA Momentum Trend Following StrategyPine Script · Momentum · 1d
- Multi Timeframe Momentum Confluence Automated Trading StrategyPine Script · Momentum · 1h
- Multi factor Adaptive Momentum Tracking StrategyPine Script · Momentum · 3m
- Pivot and Momentum StrategyPine Script · Momentum · 1d
- Advanced Automated Trading System Multi indicator Momentum and Support Resistance Trend AnalysisPine Script · Momentum · 1d