Strategy vault / Mean reversion
DPD RSI BB Quantitative Strategy
The DPD-RSI-BB quantitative strategy combines three indicators - DPD, RSI and Bollinger Bands for stock trading. It uses DPD to determine the trend, RSI to judge overbought and oversold levels, and Bollinger Bands to…
Overview
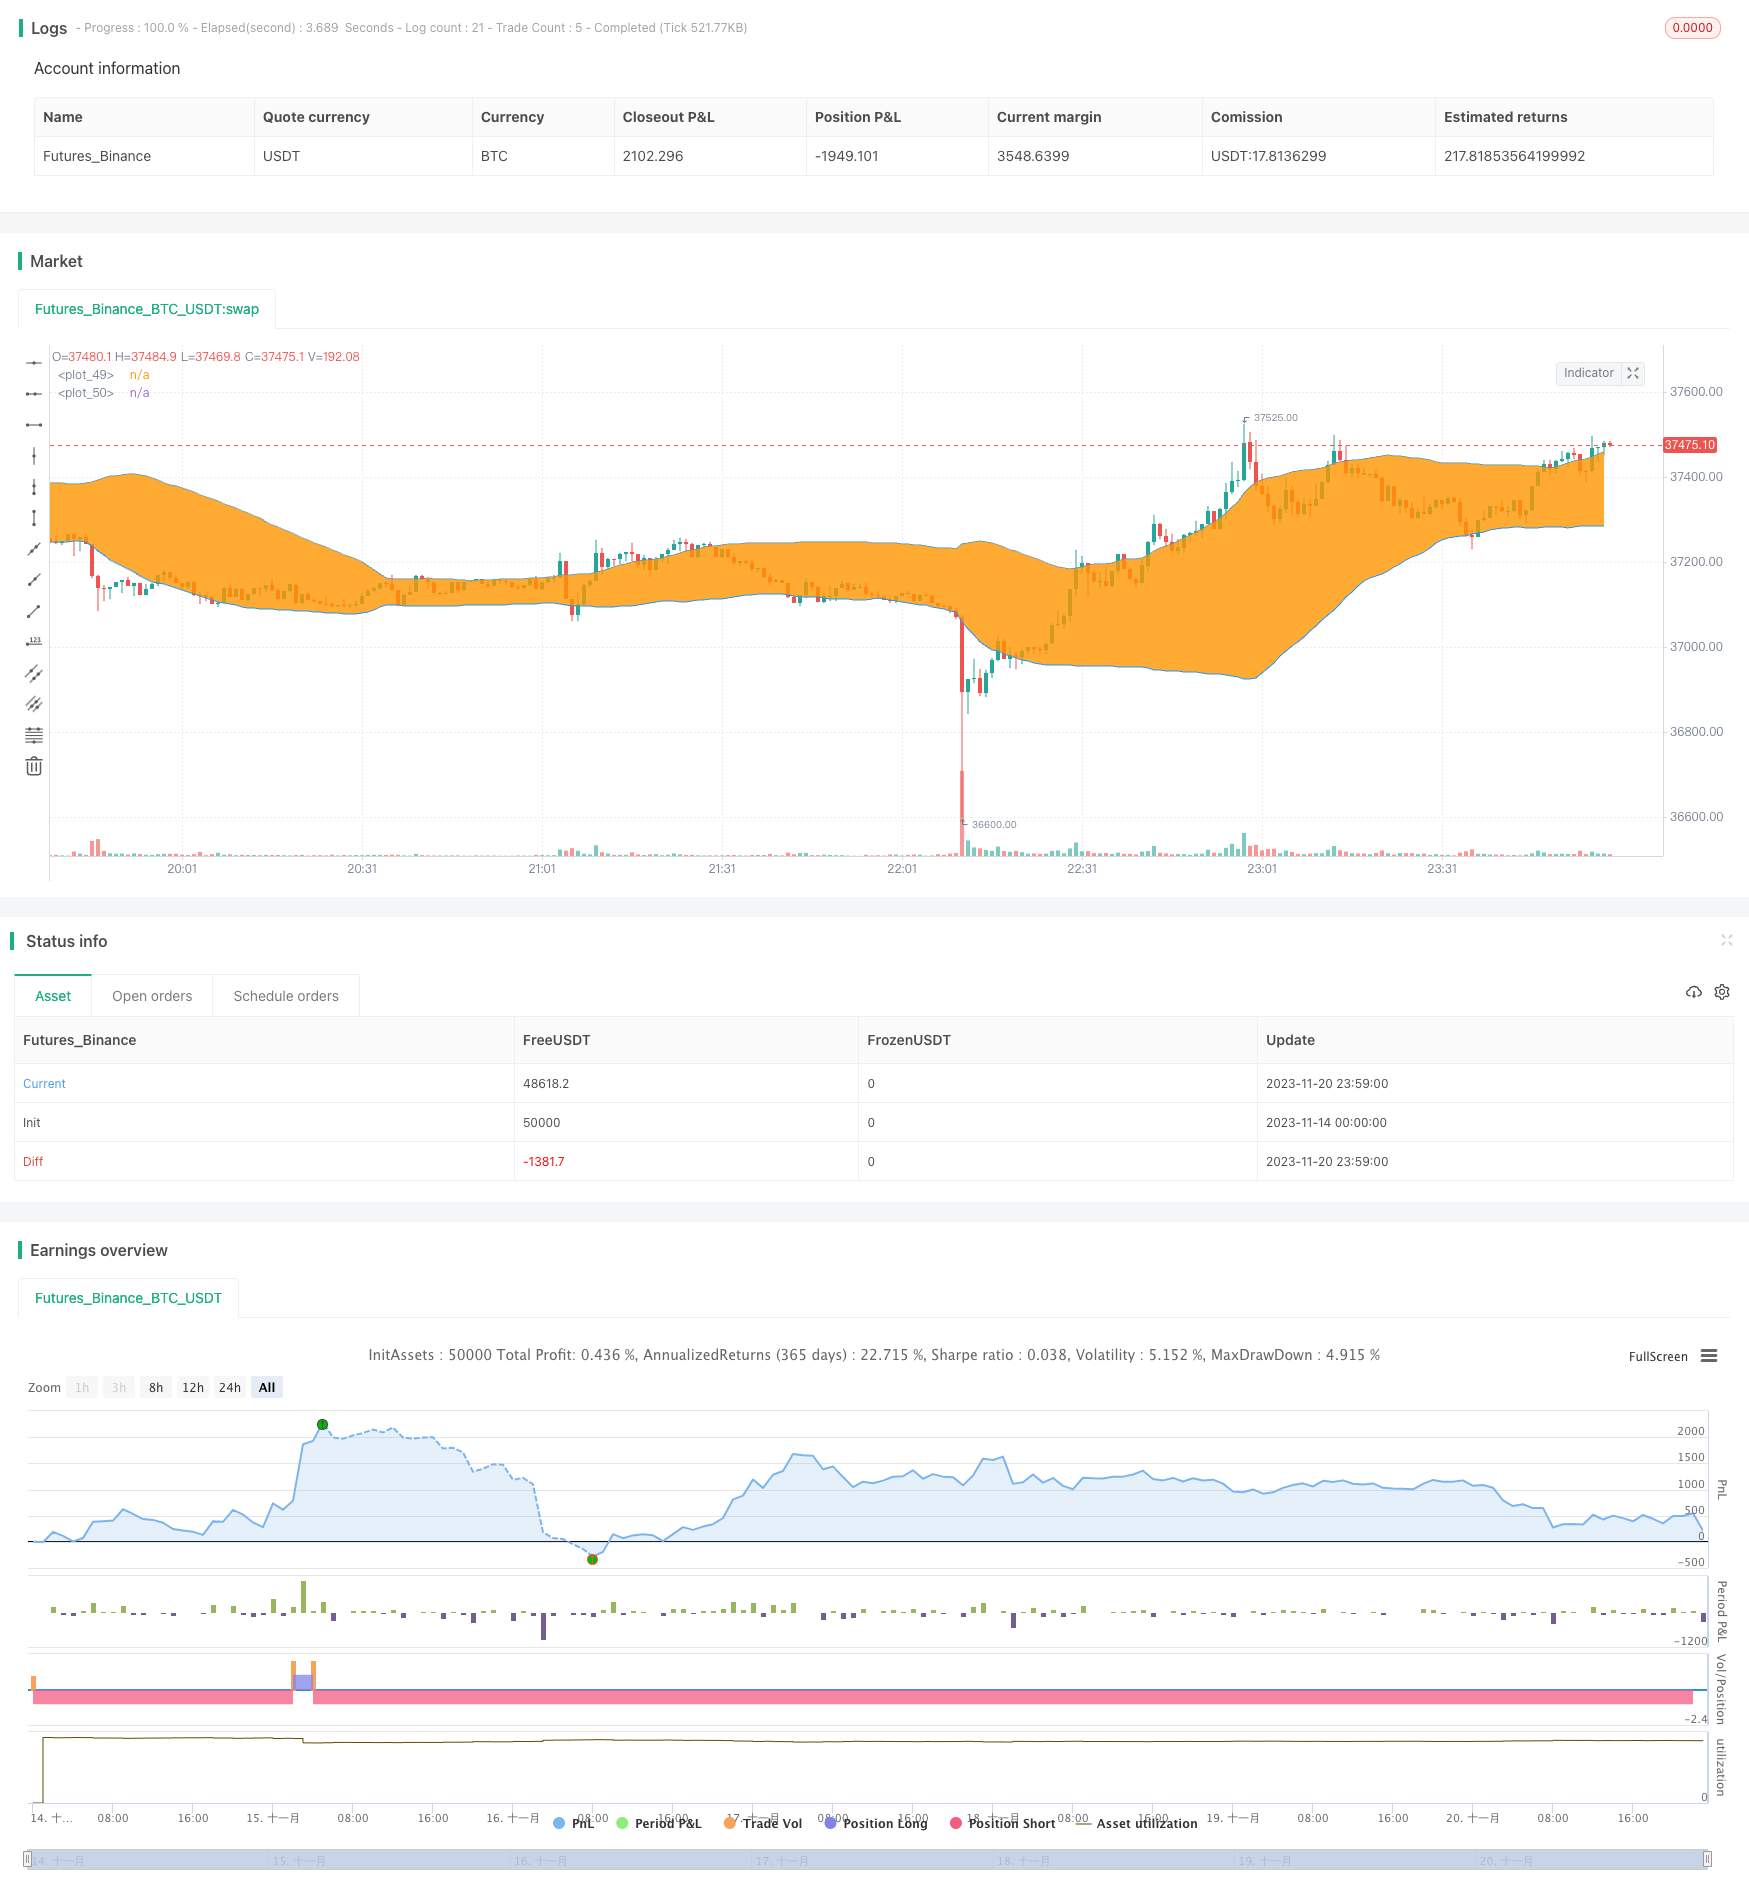
The DPD-RSI-BB quantitative strategy combines three indicators - DPD, RSI and Bollinger Bands for stock trading. It uses DPD to determine the trend, RSI to judge overbought and oversold levels, and Bollinger Bands to identify support and resistance levels for entering the market.
Strategy Logic
The strategy consists of the following main components:
DPD indicator to determine the trend
It builds the DEMA line using double EMA averages and calculates the price differential percentage against DEMA as a trend determination indicator. A low difference percentage is used as a bullish signal.
RSI indicator to judge overbought and oversold conditions
It calculates the RSI value over a certain period. RSI above the upper limit is judged as an overbought zone and RSI below the lower limit is judged as an oversold zone.
Bollinger Bands to identify support and resistance
It calculates the middle band, upper band and lower band over a certain period. Price approaching the upper band signals a bearish outlook, while price approaching the lower band signals a bullish outlook.
Comprehensive judgment
When the DPD price differential percentage is lower than the threshold, RSI is lower than the oversold zone's lower limit, and price is lower than the Bollinger upper band, a bullish signal is generated. When RSI is higher than the overbought zone's upper limit, DPD differential percentage is higher than the threshold, and price is higher than the Bollinger upper band, a bearish signal is generated.
Advantage Analysis
The strategy has the following advantages:
Comprehensive judgment using multiple indicators avoids false signals from a single indicator.
Using the RSI indicator to judge overbought and oversold conditions allows setting stop loss and take profit points beforehand.
The DPD indicator can better determine price trends, while Bollinger Bands can identify support and resistance levels.
Flexible parameter settings allow optimizations for different stocks.
Risks and Optimization
The strategy also has some risks:
The combination of multiple indicators makes the strategy rather complex with difficulty in parameter tuning.
Indicators like DPD and RSI have certain lags, which may miss the best entry timing.
Parameters need to be optimized to suit different cycles and stock characteristics.
The following aspects can be optimized:
Adjust indicator parameters to optimize entry and exit points.
Add stop loss mechanisms to strictly control per trade loss.
Test on different stocks and cycle parameters to evaluate strategy performance.
Conclusion
The DPD-RSI-BB strategy combines multiple indicators for judgments to avoid false signals from a single indicator. Through parameter optimization, it can become a relatively strong stock trading strategy. But due to its complexity, it may still fail to completely hedge against market risks and should be used with caution.
Parameters
| Name | Default | What it controls |
|---|---|---|
| v_input_1 | -1 | buyper |
| v_input_2 | false | sellper |
| v_input_3 | 50 | Dema Length |
| v_input_4 | 6 | lengthrsi |
| v_input_5 | 20 | overSold |
| v_input_6 | 60 | overBought |
| v_input_7 | 50 | lengthbb |
| v_input_8 | 1.5 | multlow |
| v_input_9 | 1.5 | multup |
| v_input_10 | 2018 | yearfrom |
| v_input_11 | 2039 | yearuntil |
| v_input_12 | 6 | monthfrom |
| v_input_13 | 12 | monthuntil |
| v_input_14 | true | dayfrom |
| v_input_15 | 31 | dayuntil |
Source Pine Script
/*backtest
start: 2023-11-14 00:00:00
end: 2023-11-21 00:00:00
period: 1m
basePeriod: 1m
exchanges: [{"eid":"Futures_Binance","currency":"BTC_USDT"}]
*/

//@version= 2
strategy("DPD+RSI+BB ",overlay=true)
price=close


//############### DPD  #################


buyper =input(-1,step=0.1)
sellper=input(0,step=0.1)
demalen = input(50,title="Dema Length")
e1= ema(close,demalen)
e2=ema(e1,demalen)
demaprice  =   2 * e1 - e2
demadifper =  ((price-demaprice)/price)*100


//############## DPD #####################

//############# RSI ####################


lengthrsi = input(6)
overSold = input( 20 )
overBought = input( 60 )

vrsi = rsi(price, lengthrsi)

//########## RSI #######################

//############### BB #################

lengthbb = input(50, minval=1)
multlow = input(1.5, minval=0.001, maxval=50,step=0.1)
multup = input(1.5,minval=0.001,maxval=50,step=0.1)

basisup = sma(close, lengthbb)
basislow = sma(close, lengthbb)

devup = multup * stdev(close, lengthbb)

devlow = multlow*stdev(close,lengthbb)

upperbb = basisup + devup
lowerbb = basislow - devlow

p1 = plot(upperbb, color=blue)
p2 = plot(lowerbb, color=blue)
fill(p1, p2)


//########### BB ###################


yearfrom = input(2018)
yearuntil =input(2039)
monthfrom =input(6)
monthuntil =input(12)
dayfrom=input(1)
dayuntil=input(31)


if (  (demadifper<buyper) and crossover(vrsi,overSold) and  (price < upperbb) and   year >= yearfrom and year <= yearuntil and month>=monthfrom and month <=monthuntil and dayofmonth>=dayfrom and dayofmonth < dayuntil)
    strategy.entry("BUY", strategy.long, stop=close, oca_name="TREND",  comment="BUY")

else
    strategy.cancel(id="BUY")


if (   price>upperbb and vrsi>overBought and demadifper>sellper   and  year >= yearfrom and year <= yearuntil and month>=monthfrom and month <=monthuntil and dayofmonth>=dayfrom and dayofmonth < dayuntil )

    strategy.entry("SELL", strategy.short,stop=close, oca_name="TREND",  comment="SELL")
else
    strategy.cancel(id="SELL")
Published by ChaoZhang on the FMZ strategy square · last modified 2023-11-22. Collected in the Quant Trading Vault. Unvalidated research: re-test with your own data and costs before trusting it.
Build this with AgenKit
A spec is not a trading system. Paste this into your coding agent and AgenKit runs a specialist team — architecture, test-first build, risk gates, review — with paper trading on by default.
/agenkit build a production-grade trading bot with a backtest engine, risk controls and paper trading by default from strategies/DPD-RSI-BB-Quantitative-Strategy.md- npx agenkit install engineering-kit in your project
- Paste the command into your agent and approve each phase
- Get tests, backtest, risk controls and a paper-trading switch
Understand it first
Before you run this, read the lesson behind the idea and how to backtest it honestly. Specs like this one are the survivors of an unknown number of trials; deflate their results accordingly.
Related specs
- Advanced Quantitative Trading Strategy Combining RSI Divergence and Moving AveragesPine Script · Mean reversion · 1h
- Bollinger Bands Trend Reversal StrategyPine Script · Mean reversion · 10m
- MACD RSI and EMA StrategyPine Script · Mean reversion · 1d
- Multi Indicator Dynamic Trend Capture and Mean Reversion StrategyPine Script · Mean reversion · 1d
- Advanced 15 Minute Chart Trading Signal StrategyPine Script · Mean reversion · 3h
- Advanced Momentum EMA Trend Following with RSI Overbought Oversold Trading StrategyPine Script · Mean reversion · 1d