Strategy vault / Machine learning
Dual B Intelligent Tracking Strategy
This is a trading strategy that uses Bollinger Bands. The strategy aims to identify opportunities when prices fluctuate violently using Bollinger Bands and make corresponding buy or sell decisions. The strategy…
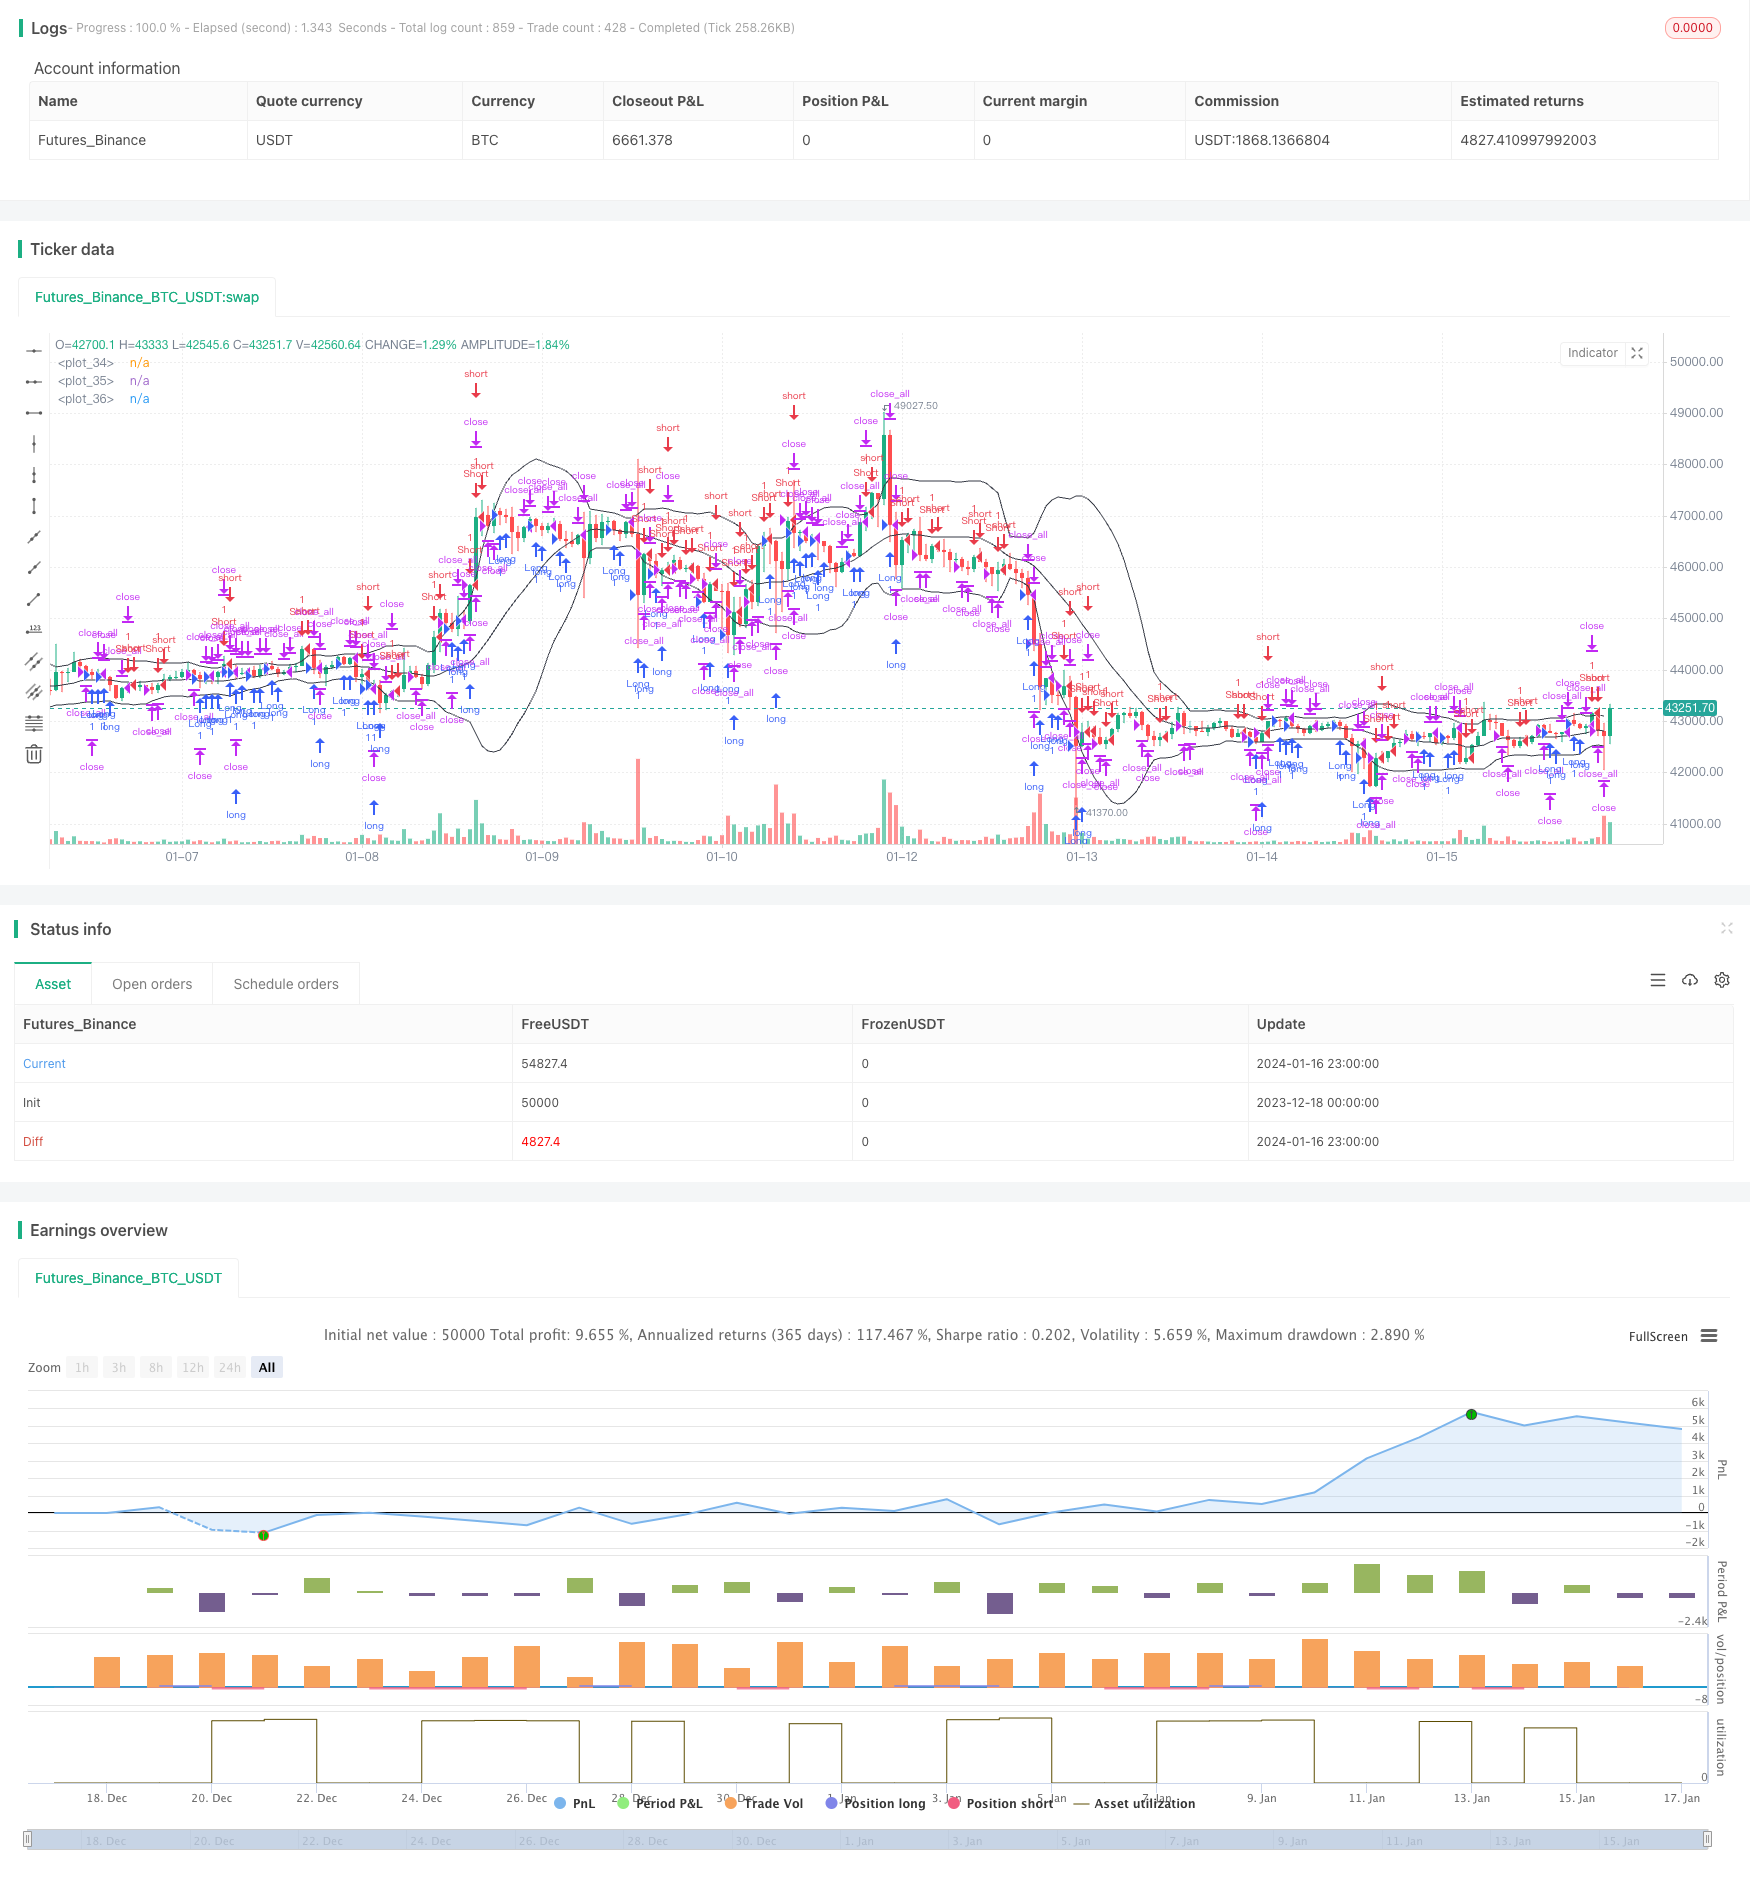
This is a trading strategy that uses Bollinger Bands. The strategy aims to identify opportunities when prices fluctuate violently using Bollinger Bands and make corresponding buy or sell decisions.
Strategy Principle
The strategy calculates the upper band, middle band and lower band of Bollinger Bands to determine if the current price is within the volatile range and hence make decisions on opening or closing positions. When the price approaches the upper band, it is regarded as the extreme point for longs and the strategy chooses to close long positions. When the price falls near the lower band, it is regarded as the extreme point for shorts and the strategy chooses to open long positions.
In addition, the strategy also introduces trend reversal factors. If there is a reversal signal, it will also trigger corresponding buy or sell decisions. Specifically, the logic of the strategy is as follows:
- Calculate the upper, middle and lower Bollinger Bands
- Judge if the price breaks through the bands and reversal signals
- Breaking through the middle band as trend signal
- Near the upper or lower band as reversal signals
- Send out buy, sell or close orders
The above is the basic trading logic of this strategy. By utilizing the characteristics of Bollinger Bands and combining trend and reversal factors, the strategy attempts to catch reversal points when volatility increases.
Advantages of the Strategy
Compared with ordinary moving average strategies, this strategy has the following advantages:
- More sensitive, able to capture opportunities when prices fluctuate violently
- Combine both trend and reversal factors to avoid losses from premature reversals
- Has a certain FILTER effect to avoid unnecessary buys/sells in non-volatile areas
- Judge the major trend direction through the middle band to reduce trading frequency
- Increase reversal filter conditions to reduce misjudgements
In general, this strategy combines Bollinger Bands and price bars relatively well. It trades at reasonable reversal points to ensure a certain level of profits while controlling risks.
Risks and Optimization
However, there are still some risks with this strategy:
- Improper BB parameters fail to fully capture price fluctuations
- Inaccurate reversal signal judgement, missing reversals or misjudging reversals
- Poor effectiveness of middle band signals when trend is unclear
Accordingly, future optimizations can focus on:
- Adaptive optimization of BB parameters based on different products
- Increase machine learning models to judge reversal probability
- Switch to other indicators when trend is unclear
- Combine more price patterns to filter trading signals
Conclusion
In conclusion, this is a typical Bollinger Bands trading strategy template. It avoids excessive ineffective trades common for using Bollinger Bands alone by introducing trend reversal judgement to filter signals, which can theoretically lead to good strategy performance. But parameters and signal filtering still need further optimization and improvement for robustness and to reduce misjudgements.
Parameters
| Name | Default | What it controls |
|---|---|---|
| v_input_1 | true | Long |
| v_input_2 | true | Short |
| v_input_3 | 20 | Bollinger Length |
| v_input_4 | 2 | Bollinger Mult |
| v_input_5_ohlc4 | 0 | Bollinger Source: ohlc4 | high | low | open | hl2 | hlc3 | hlcc4 | close |
| v_input_6 | true | Use trend entry |
| v_input_7 | true | Use counter-trend entry |
| v_input_8 | 2018 | From Year |
| v_input_9 | 2100 | To Year |
| v_input_10 | true | From Month |
| v_input_11 | 12 | To Month |
| v_input_12 | true | From day |
| v_input_13 | 31 | To day |
| v_input_14 | true | Show Bollinger Bands |
Source Pine Script
/*backtest
start: 2023-12-18 00:00:00
end: 2024-01-17 00:00:00
period: 1h
basePeriod: 15m
exchanges: [{"eid":"Futures_Binance","currency":"BTC_USDT"}]
*/

//Noro
//2018

//@version=3
strategy("Noro's Bollinger Strategy v1.2", shorttitle = "Bollinger str 1.2", overlay = true )

//Settings
needlong = input(true, defval = true, title = "Long")
needshort = input(true, defval = true, title = "Short")

length = input(20, defval = 20, minval = 1, maxval = 1000, title = "Bollinger Length")
mult = input(2.0, defval = 2.0, minval = 0.001, maxval = 50, title = "Bollinger Mult")
source = input(ohlc4, defval = ohlc4, title = "Bollinger Source")

uset = input(true, defval = true, title = "Use trend entry")
usect = input(true, defval = true, title = "Use counter-trend entry")

fromyear = input(2018, defval = 2018, minval = 1900, maxval = 2100, title = "From Year")
toyear = input(2100, defval = 2100, minval = 1900, maxval = 2100, title = "To Year")
frommonth = input(01, defval = 01, minval = 01, maxval = 12, title = "From Month")
tomonth = input(12, defval = 12, minval = 01, maxval = 12, title = "To Month")
fromday = input(01, defval = 01, minval = 01, maxval = 31, title = "From day")
today = input(31, defval = 31, minval = 01, maxval = 31, title = "To day")
showbands = input(true, defval = true, title = "Show Bollinger Bands")

//Bollinger Bands
basis = sma(source, length)
dev = mult * stdev(source, length)
upper = basis + dev
lower = basis - dev

//Lines
col = showbands ? black : na
plot(upper, linewidth = 1, color = col)
plot(basis, linewidth = 1, color = col)
plot(lower, linewidth = 1, color = col)

//Body
body = abs(close - open)
abody = ema(body, 30)

//Signals
bar = close > open ? 1 : close < open ? -1 : 0
up1 = bar == -1 and close >= basis and close < upper and (close < strategy.position_avg_price or strategy.position_size == 0) and uset
dn1 = bar == 1 and close <= basis and close > lower and (close > strategy.position_avg_price or strategy.position_size == 0) and uset
up2 = close <= lower and usect
dn2 = close >= upper and usect
exit = (strategy.position_size > 0 and close > open) or (strategy.position_size < 0 and close < open) and body > abody / 2

//Trading
if up1 or up2
    strategy.entry("Long", strategy.long, needlong == false ? 0 : na)

if dn1 or dn2
    strategy.entry("Short", strategy.short, needshort == false ? 0 : na)

if exit
strategy.close_all()Published by ChaoZhang on the FMZ strategy square · last modified 2024-01-18. Collected in the Quant Trading Vault. Unvalidated research: re-test with your own data and costs before trusting it.
Build this with AgenKit
A spec is not a trading system. Paste this into your coding agent and AgenKit runs a specialist team — architecture, test-first build, risk gates, review — with paper trading on by default.
/agenkit build a production-grade trading bot with a backtest engine, risk controls and paper trading by default from strategies/Dual-B-Intelligent-Tracking-Strategy.md- npx agenkit install engineering-kit in your project
- Paste the command into your agent and approve each phase
- Get tests, backtest, risk controls and a paper-trading switch
Understand it first
Before you run this, read the lesson behind the idea and how to backtest it honestly. Specs like this one are the survivors of an unknown number of trials; deflate their results accordingly.
Related specs
- Dual Moving Average Matching Strategy Based on Bollinger BandsPine Script · Machine learning · 1h
- EMA and RSI Quantitative Trading StrategyPine Script · Machine learning · 1h
- Triple Moving Average Combined with MACD Quantitative StrategyPine Script · Machine learning · 1d
- Multi indicator Assisted StrategyPine Script · Machine learning · 1d
- Bull Bear Power Trading Strategy with Volume Percentile Based Dynamic Take Profit SystemPine Script · Machine learning · 1d
- Dynamic Price Swing Oscillator StrategyPine Script · Machine learning · 1m