Strategy vault / Mean reversion
Dual Channel Tracking Reversal Strategy
The Dual Channel Tracking Reversal strategy is a reversal trading strategy that combines Bollinger Bands, Keltner Channels, and momentum indicators. It identifies price compression zones through the synthesis of…
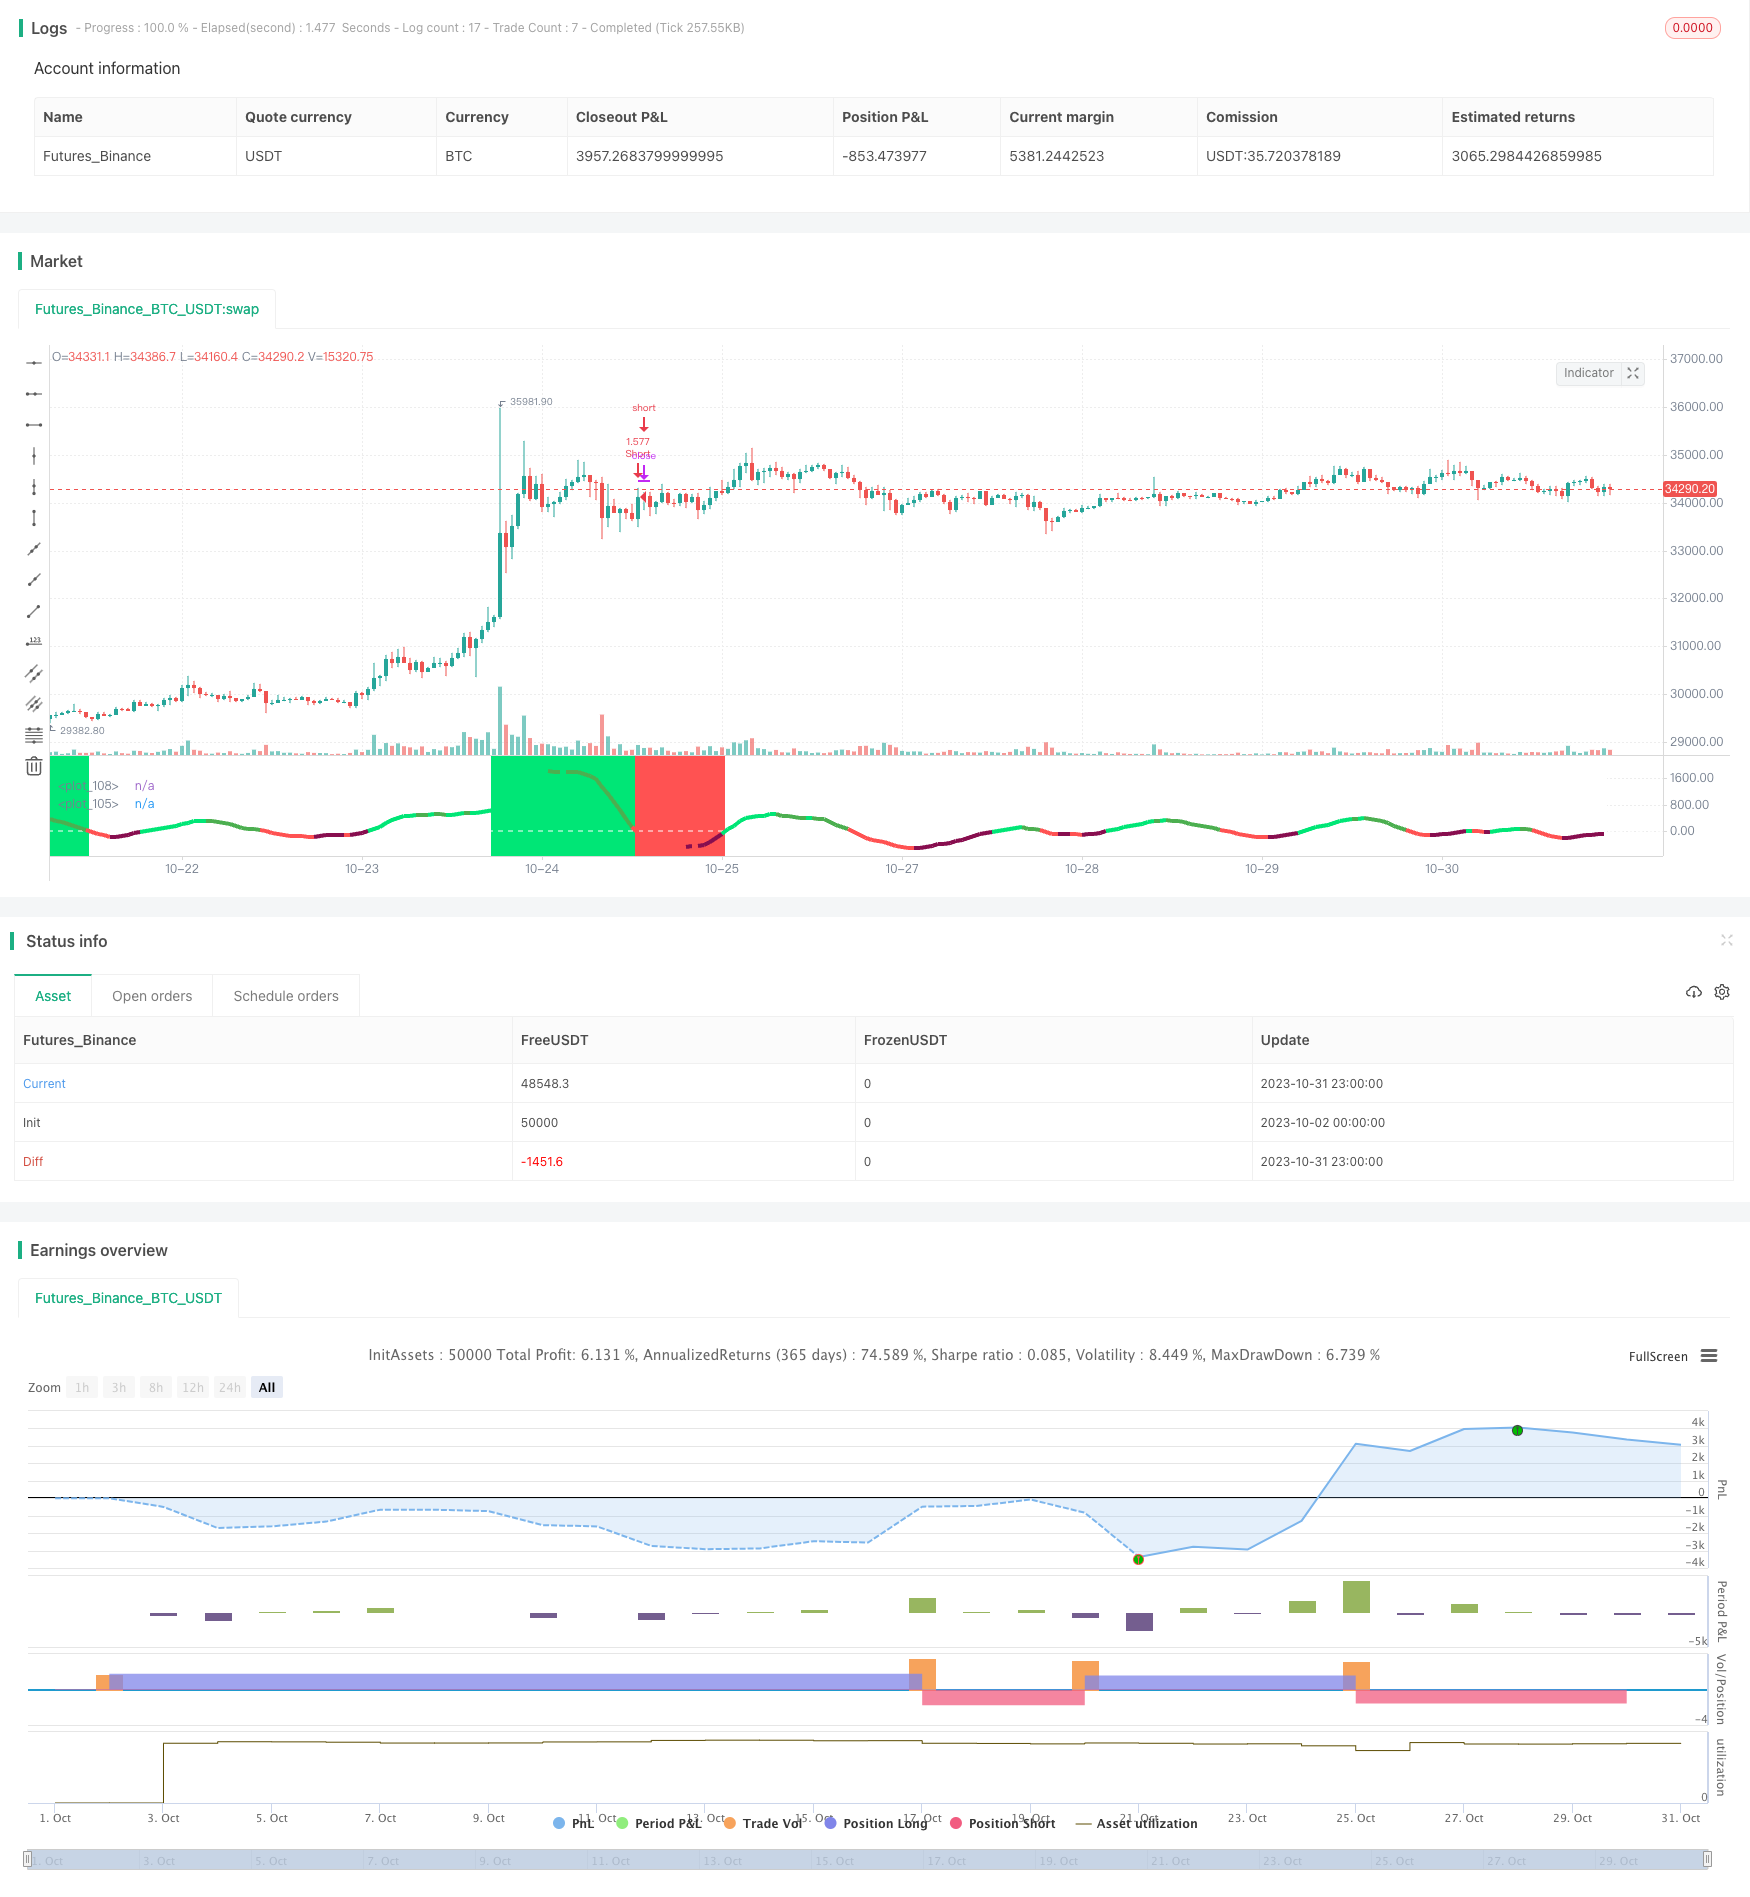
Overview
The Dual Channel Tracking Reversal strategy is a reversal trading strategy that combines Bollinger Bands, Keltner Channels, and momentum indicators. It identifies price compression zones through the synthesis of Bollinger Bands and Keltner Channels, and utilizes momentum indicators to determine reversal signals for entry and exit.
Strategy Logic
Calculate the middle, upper and lower bands for Bollinger Bands
- Middle band uses SMA of close
- Upper and lower bands are middle band ± adjustable standard deviation multiple
Calculate the middle, upper and lower bands for Keltner Channels
- Middle band uses SMA of close
- Upper and lower bands are middle band ± adjustable ATR multiple
Determine if Bollinger Bands are inside Keltner Channels
- Squeeze on when lower BB > lower KC and upper BB < upper KC
- Squeeze off otherwise
Calculate the linear regression slope val of close against BB and KC midpoints
- val > 0 indicates close is increasing, val < 0 means decreasing
Calculate the ROC and EMA of ROC for close
- Determine if change rate exceeds adjustable threshold
- Above threshold indicates existing trend
When in squeeze, long when val > 0 and ROC exceeds threshold
- Vice versa for short
Set stop loss and take profit conditions
Advantages
Improved accuracy by combining dual channel system for reversal
Avoid false signals using linear regression and change rate
Flexible adjustable parameters for optimization across products
Effective risk control per trade with stop loss/take profit
Sufficient backtest data to validate strategy viability
Risks and Solutions
Squeeze does not always lead to effective reversal
- Optimize parameters and tighten squeeze criteria
False breakouts generate wrong signals
- Add linear regression to determine trend direction
Stop loss too wide leading to excessive single loss
- Optimize stop loss points and control per trade loss
Insufficient test periods
- Expand testing into more periods to prove long-term viability
Enhancement Opportunities
Parameter optimization for more products
Add machine learning for support/resistance identification
Incorporate volume change to improve breakout validity
Perform multi-timeframe analysis for trend persistence
Optimize dynamic stop loss/take profit
Conclusion
The Dual Channel Tracking Reversal strategy utilizes indicators like Bollinger Bands and Keltner Channels for reversal trading. With parameter optimization, it can be adapted across different products to identify breakout validity to some extent. But reversal trading still carries inherent risks, requiring further incorporation of machine learning etc. to improve accuracy for steady excess returns.
Parameters
| Name | Default | What it controls |
|---|---|---|
| v_input_1 | 2012 | Backtest Start Year |
| v_input_2 | true | Backtest Start Month |
| v_input_3 | true | Backtest Start Day |
| v_input_4 | 2019 | Backtest Stop Year |
| v_input_5 | 12 | Backtest Stop Month |
| v_input_6 | 31 | Backtest Stop Day |
| v_input_7 | 20 | BB Length |
| v_input_8 | 2 | BB MultFactor |
| v_input_9 | 22 | KC Length |
| v_input_10 | 1.5 | KC MultFactor |
| v_input_11 | true | Use TrueRange (KC) |
| v_input_12 | 30 | roclength |
| v_input_13 | 7 | pcntChange |
| v_input_14 | 100 | Stop Loss % |
| v_input_15 | 5000 | Take Profit % |
Source Pine Script
/*backtest
start: 2023-10-02 00:00:00
end: 2023-11-01 00:00:00
period: 1h
basePeriod: 15m
exchanges: [{"eid":"Futures_Binance","currency":"BTC_USDT"}]
*/

//@version=4
// Credit for the initial Squeeze Momentum code to LazyBear, rate of change code is from Kiasaki
strategy("Squeeze X BF ?", overlay=false, initial_capital=10000, default_qty_type=strategy.percent_of_equity, default_qty_value=100, commission_type=strategy.commission.percent, commission_value=0.0)

/////////////// Time Frame ///////////////
testStartYear = input(2012, "Backtest Start Year")
testStartMonth = input(1, "Backtest Start Month")
testStartDay = input(1, "Backtest Start Day")
testPeriodStart = timestamp(testStartYear,testStartMonth,testStartDay, 0, 0)

testStopYear = input(2019, "Backtest Stop Year")
testStopMonth = input(12, "Backtest Stop Month")
testStopDay = input(31, "Backtest Stop Day")
testPeriodStop = timestamp(testStopYear,testStopMonth,testStopDay, 0, 0)

testPeriod() => true

/////////////// Squeeeeze ///////////////
length = input(20, title="BB Length")
mult = input(2.0,title="BB MultFactor")
lengthKC=input(22, title="KC Length")
multKC = input(1.5, title="KC MultFactor")

useTrueRange = input(true, title="Use TrueRange (KC)")

// Calculate BB
source = close
basis = sma(source, length)
dev = mult * stdev(source, length)
upperBB = basis + dev
lowerBB = basis - dev

// Calculate KC
ma = sma(source, lengthKC)
range = useTrueRange ? tr : (high - low)
rangema = sma(range, lengthKC)
upperKC = ma + rangema * multKC
lowerKC = ma - rangema * multKC

sqzOn  = (lowerBB > lowerKC) and (upperBB < upperKC)
sqzOff = (lowerBB < lowerKC) and (upperBB > upperKC)
noSqz  = (sqzOn == false) and (sqzOff == false)

val = linreg(source - avg(avg(highest(high, lengthKC), lowest(low, lengthKC)),sma(close,lengthKC)), lengthKC,0)

///////////// Rate Of Change /////////////
roclength = input(30, minval=1), pcntChange = input(7, minval=1)
roc = 100 * (source - source[roclength]) / source[roclength]
emaroc = ema(roc, roclength / 2)
isMoving() => emaroc > (pcntChange / 2) or emaroc < (0 - (pcntChange / 2))

/////////////// Strategy ///////////////
long = val > 0 and isMoving()
short = val < 0 and isMoving()

last_long = 0.0
last_short = 0.0
last_long := long ? time : nz(last_long[1])
last_short := short ? time : nz(last_short[1])

long_signal = crossover(last_long, last_short)
short_signal = crossover(last_short, last_long)

last_open_long_signal = 0.0
last_open_short_signal = 0.0
last_open_long_signal := long_signal ? open : nz(last_open_long_signal[1])
last_open_short_signal := short_signal ? open : nz(last_open_short_signal[1])

last_long_signal = 0.0
last_short_signal = 0.0
last_long_signal := long_signal ? time : nz(last_long_signal[1])
last_short_signal := short_signal ? time : nz(last_short_signal[1])

in_long_signal = last_long_signal > last_short_signal
in_short_signal = last_short_signal > last_long_signal

last_high = 0.0
last_low = 0.0
last_high := not in_long_signal ? na : in_long_signal and (na(last_high[1]) or high > nz(last_high[1])) ? high : nz(last_high[1])
last_low := not in_short_signal ? na : in_short_signal and (na(last_low[1]) or low < nz(last_low[1])) ? low : nz(last_low[1])

sl_inp = input(100.0, title='Stop Loss %') / 100
tp_inp = input(5000.0, title='Take Profit %') / 100

take_level_l = strategy.position_avg_price * (1 + tp_inp)
take_level_s = strategy.position_avg_price * (1 - tp_inp)

since_longEntry = barssince(last_open_long_signal != last_open_long_signal[1])
since_shortEntry = barssince(last_open_short_signal != last_open_short_signal[1])

slLong = in_long_signal ? strategy.position_avg_price * (1 - sl_inp) : na
slShort = strategy.position_avg_price * (1 + sl_inp)
long_sl = in_long_signal ? slLong : na
short_sl = in_short_signal ? slShort : na

/////////////// Execution ///////////////
if testPeriod()
    strategy.entry("Long",  strategy.long, when=long)
    strategy.entry("Short", strategy.short, when=short)
    strategy.exit("Long Ex", "Long", stop=long_sl, limit=take_level_l, when=since_longEntry > 0)
    strategy.exit("Short Ex", "Short", stop=short_sl, limit=take_level_s, when=since_shortEntry > 0)

/////////////// Plotting ///////////////
bcolor = iff(val > 0, iff(val > nz(val[1]), color.lime, color.green), iff(val < nz(val[1]), color.red, color.maroon))
plot(val, color=bcolor, linewidth=4)
bgcolor(not isMoving() ? color.white : long ? color.lime : short ? color.red : na, transp=70)
bgcolor(long_signal ? color.lime : short_signal ? color.red : na, transp=50)
hline(0, color = color.white)Published by ChaoZhang on the FMZ strategy square · last modified 2023-11-02. Collected in the Quant Trading Vault. Unvalidated research: re-test with your own data and costs before trusting it.
Build this with AgenKit
A spec is not a trading system. Paste this into your coding agent and AgenKit runs a specialist team — architecture, test-first build, risk gates, review — with paper trading on by default.
/agenkit build a production-grade trading bot with a backtest engine, risk controls and paper trading by default from strategies/Dual-Channel-Tracking-Reversal-Strategy.md- npx agenkit install engineering-kit in your project
- Paste the command into your agent and approve each phase
- Get tests, backtest, risk controls and a paper-trading switch
Understand it first
Before you run this, read the lesson behind the idea and how to backtest it honestly. Specs like this one are the survivors of an unknown number of trials; deflate their results accordingly.
Related specs
- CCTBBO Reversal Tracking StrategyPine Script · Mean reversion · 45m
- Bollinger Bands Trend Reversal StrategyPine Script · Mean reversion · 10m
- MACD RSI and EMA StrategyPine Script · Mean reversion · 1d
- Kuberan Strategy The Confluence Approach for Market MasteryPine Script · Mean reversion · 5m
- Mean Reversion Trading Strategy Based on Bollinger Bands and Golden RatioPine Script · Mean reversion · 1h
- EMA Percentage Channel with Bollinger Band Range Trading StrategyPine Script · Mean reversion · 3m