Strategy vault / Trend following
Dual EMA Crossover Strategy 442537
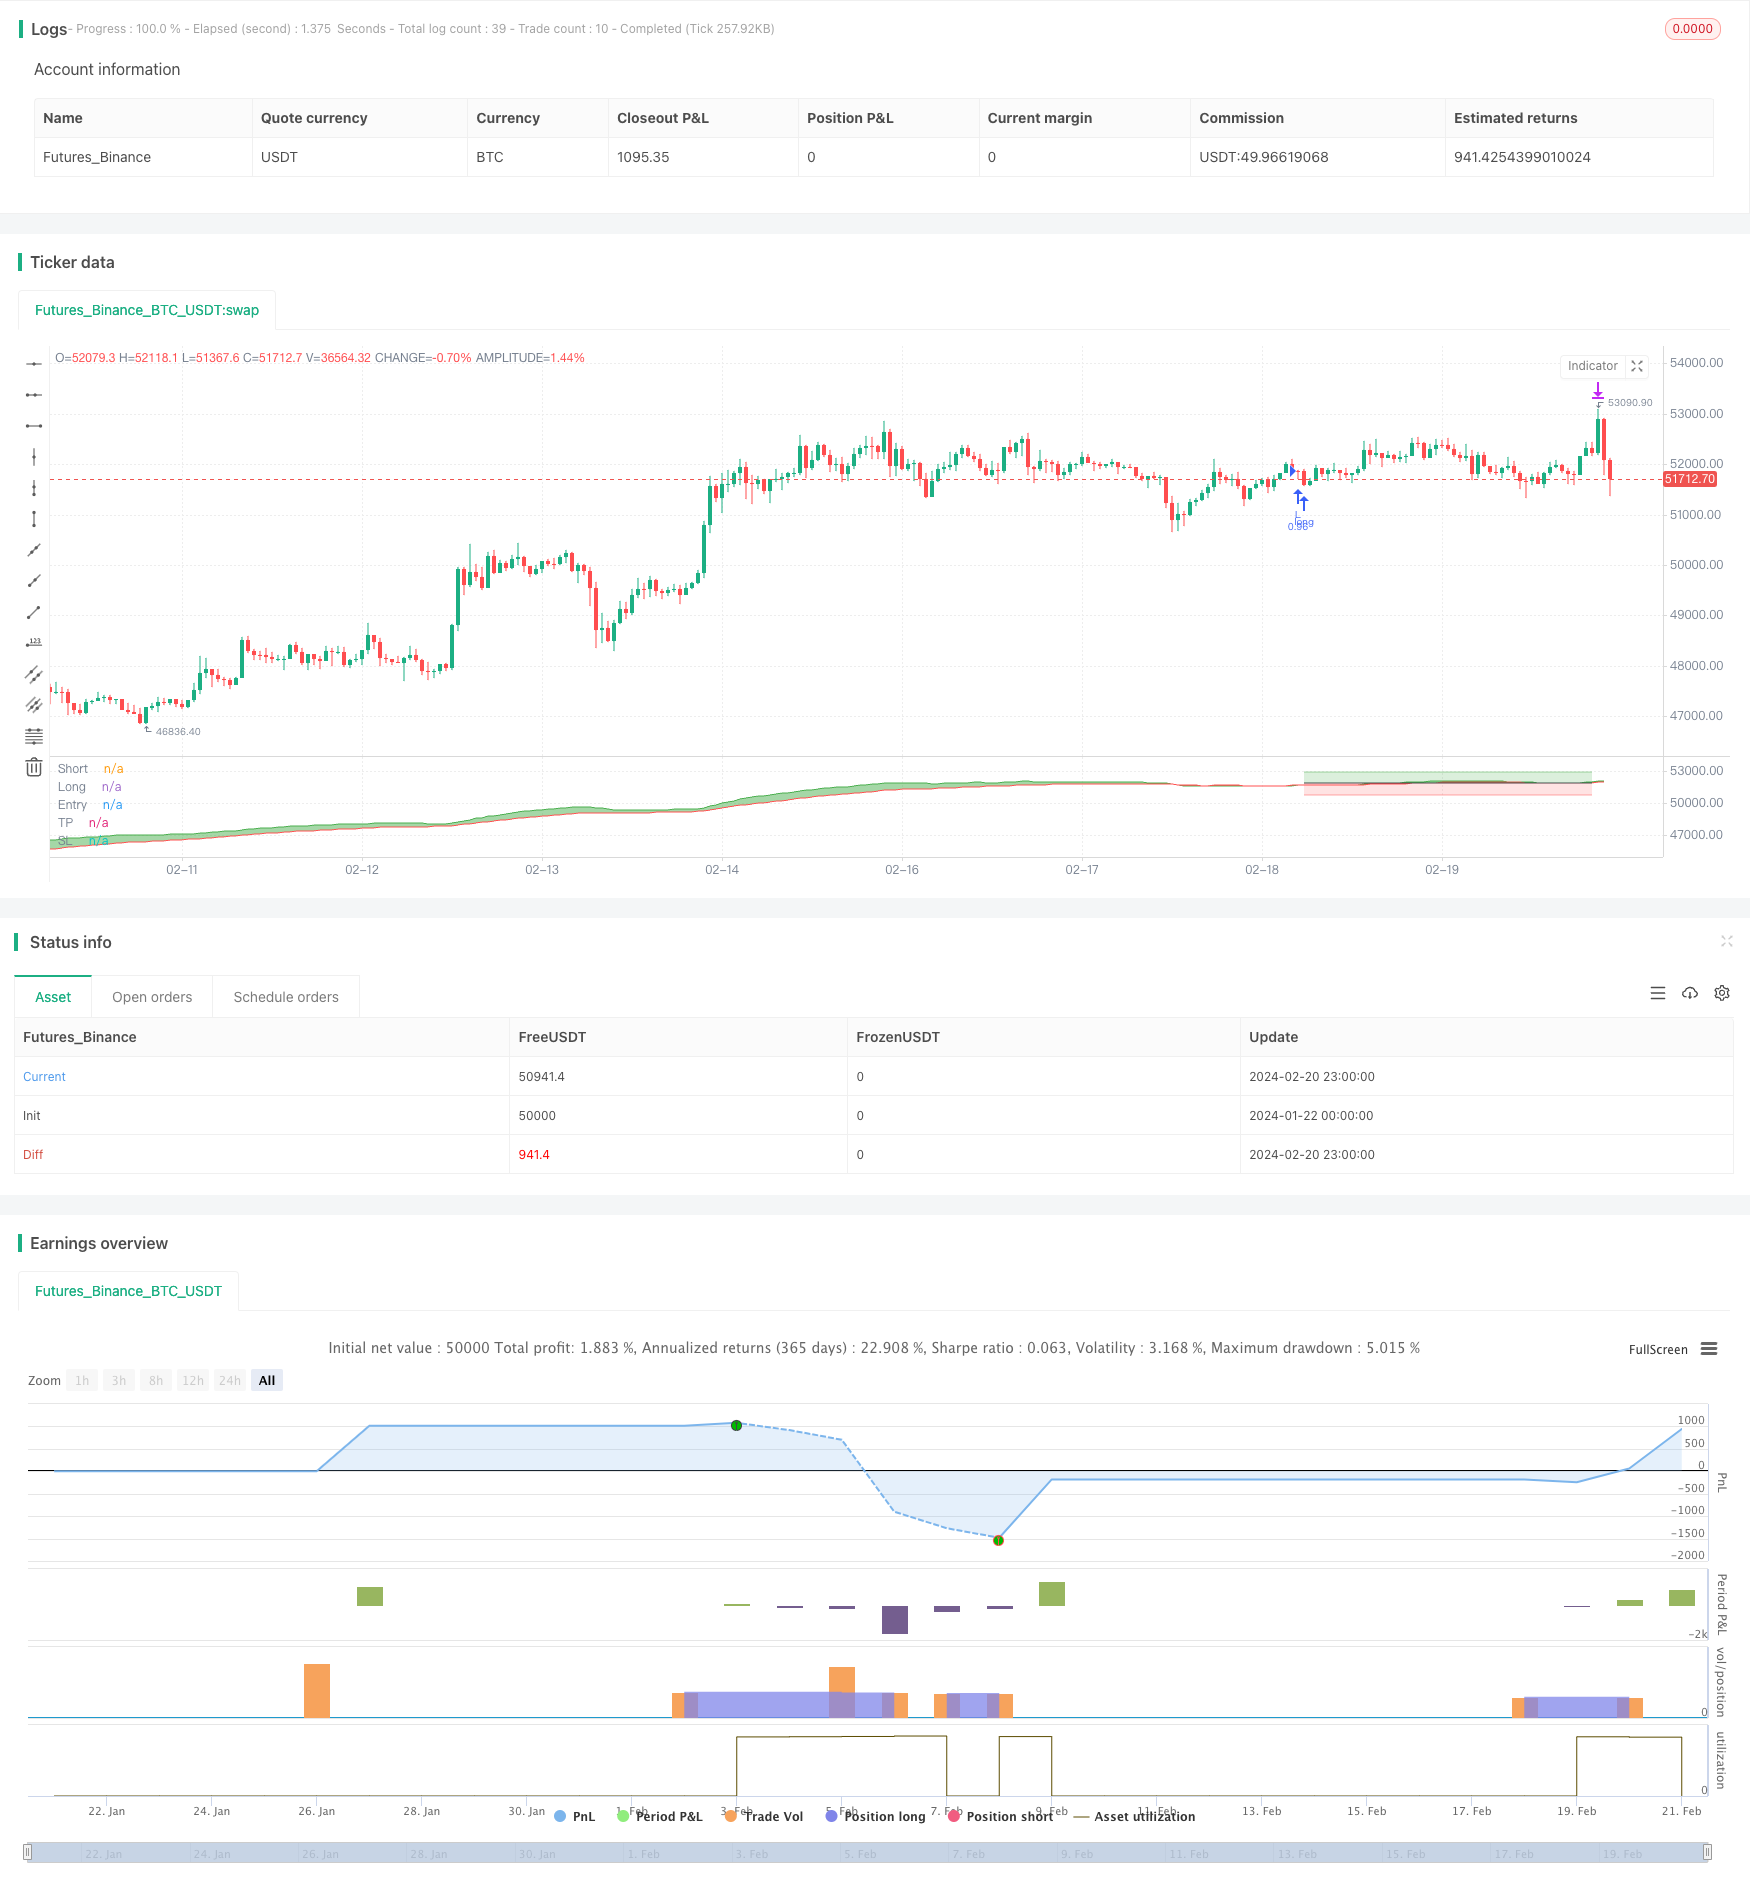
The Dual EMA Crossover Strategy is a quantitative trading strategy that opens and closes positions based on the crossover of two EMA lines with different periods. This strategy is simple, effective, easy to…
Overview
The Dual EMA Crossover Strategy is a quantitative trading strategy that opens and closes positions based on the crossover of two EMA lines with different periods. This strategy is simple, effective, easy to understand, and commonly used in quantitative trading.
Strategy Logic
The strategy uses two EMA lines, one is a 25-period EMA line as the fast line, and the other is a 50-period EMA line as the slow line. When the fast line crosses above the slow line, go long. When the fast line crosses below the slow line, go short.
After going long, set the take profit to 2% of the entry price and the stop loss to 2% of the entry price. When the price reaches the take profit or stop loss, close the position. Going short is the same.
The core of this strategy is to use the crossover of the EMA fast and slow lines to judge market trends and reversals. When the fast line crosses above, it is judged as a bull market and goes long. When the fast line crosses below, it is judged as a bear market and goes short. Take profit and stop loss are set to lock in profits and control risks.
Advantage Analysis
The Dual EMA Crossover Strategy has the following advantages:
- The idea is clear and the logic is simple, easy to understand and implement.
- The fast and slow lines work together to capture medium and short-term trends.
- It can follow the trend in a timely manner and seize market turning points.
- The risk control is in place with reasonable take profit and stop loss settings.
In general, this strategy judges the market clearly, utilizes the advantages of the EMA itself, and obtains good medium and short-term returns while controlling risks.
Risk Analysis
The Dual EMA Crossover Strategy also has some risks:
- In case of violent market fluctuations, EMA crossover signals may be inaccurate, with a probability of misjudgement.
- Unreasonable take profit and stop loss points may miss bigger moves or take on greater losses.
- The impact of trading fees and slippage cannot be ignored either.
These risks can be optimized and solved in the following ways:
- Combine other indicators to judge the market and avoid misjudged EMA crossover signals.
- Test and optimize the take profit and stop loss points to strike a balance between returns and risks.
- Choose trading platforms with low fees and appropriately increase position sizes.
Optimization Directions
The main optimization directions for this strategy include:
- Optimize the EMA period parameters to find the best parameter combination.
- Increase other indicators for judgement to form a trading combination and improve accuracy.
- Dynamically adjust take profit and stop loss points. For example, when the loss reaches a certain level, expand the stop loss point, and when the profit reaches a certain level, move the take profit point.
- Distinguish bull and bear markets for directional trading.
These optimizations can improve return and win rates while keeping the strategy simple and clear.
Summary
In summary, the Dual EMA Crossover Strategy is a very practical quantitative trading strategy. It is easy to understand and implement, and effectively captures market trends. At the same time, it has room for optimization. Further improvements on return rates can be achieved through parameter tuning and combinations. The simplicity and directness of this strategy is worth learning and applying for investors.
Parameters
| Name | Default | What it controls |
|---|---|---|
| v_input_int_1 | 25 | (?[EMA]----------)Short |
| v_input_int_2 | 50 | Long |
| v_input_bool_1 | true | (?[TP & SL%]----------)Long - |
| v_input_float_1 | 2 | TP |
| v_input_float_2 | 2 | SL |
| v_input_bool_2 | false | Short - |
| v_input_float_3 | 2 | TP |
| v_input_float_4 | 2 | SL |
| v_input_1 | timestamp(0001-01-01) | (?[Backtest]----------)Start |
| v_input_2 | timestamp(9999-01-01) | End |
| v_input_bool_3 | false | Backtest BGcolor |
| v_input_bool_4 | false | Position BGcolor |
| v_input_string_1 | 0 | (?[IRISBOT]----------)Exchange: binance | bybit | upbit |
| v_input_string_2 | account1 | Account |
| v_input_string_3 | BTC/USDT | Symbol |
| v_input_string_4 | sema-x | Strategy |
| v_input_string_5 | token | Token |
| v_input_float_5 | 100 | Ratio(%) |
| v_input_float_6 | true | Leverage |
| v_input_bool_5 | false | View alert msg |
Source Pine Script
/*backtest
start: 2024-01-22 00:00:00
end: 2024-02-21 00:00:00
period: 1h
basePeriod: 15m
exchanges: [{"eid":"Futures_Binance","currency":"BTC_USDT"}]
*/

// SEMA-X(SEMA CROSS) [AB] : Simple EMA cross strategy Alert & Backtest
// 1. 2 EMA cross
// 2. Next candle entry
// 3. TP & SL

//@version=5
strategy("SEMA-X", "SEMA-X", overlay=false, margin_long=1,
 initial_capital=1000000, default_qty_type=strategy.percent_of_equity, default_qty_value=100,
 commission_type=strategy.commission.percent, commission_value=0.075, slippage=3)

//****************************************************************************//
// Input
//****************************************************************************//
// EMA length
emaLen25 = input.int(25, "Short", minval=1, confirm=true, group="[EMA]----------", inline="1")
emaLen50 = input.int(50, "Long",  minval=1, confirm=true, group="[EMA]----------", inline="1")

// TP & SL
isLong   = input.bool(true, "Long - ",    confirm=true, group="[TP & SL(%)]----------", inline="1")
tpLong   = input.float(2, "TP", minval=0, confirm=true, group="[TP & SL(%)]----------", inline="1")*0.01
slLong   = input.float(2, "SL", minval=0, confirm=true, group="[TP & SL(%)]----------", inline="1")*0.01
isShort  = input.bool(false, "Short - ",  confirm=true, group="[TP & SL(%)]----------", inline="2")
tpShort  = input.float(2, "TP", minval=0, confirm=true, group="[TP & SL(%)]----------", inline="2")*0.01
slShort  = input.float(2, "SL", minval=0, confirm=true, group="[TP & SL(%)]----------", inline="2")*0.01

// Backtest period
sTime = input(timestamp("0001-01-01"), "Start", group="[Backtest]----------")
eTime = input(timestamp("9999-01-01"), "End",   group="[Backtest]----------")
inDateRange   = true
periodBg      = input.bool(false, "Backtest BGcolor", confirm=true, group="[Backtest]----------", inline="1")
bgLong        = input.bool(false, "Position BGcolor", confirm=true, group="[Backtest]----------", inline="1")
periodBgColor = periodBg and inDateRange ? color.new(color.green, 95) : na
bgcolor(periodBgColor, title="Backtest BGcolor")
bgColorLong   = bgLong and strategy.position_size>0 ? color.new(color.green, 95) : na
bgcolor(bgColorLong, title="Position BGcolor")

// IRISBOT
exchange = input.string("binance",  "Exchange", confirm=true, group="[IRISBOT]----------", inline="2", options=["binance", "bybit", "upbit"])
account  = input.string("account1", "Account",  confirm=true, group="[IRISBOT]----------", inline="2")
symbol   = input.string("BTC/USDT", "Symbol",   confirm=true, group="[IRISBOT]----------", inline="3")
strategy = input.string("sema-x",   "Strategy", confirm=true, group="[IRISBOT]----------", inline="3")
token    = input.string("token",    "Token",    confirm=true, group="[IRISBOT]----------", inline="4")
stRatio  = input.float(100.0,       "Ratio(%)", confirm=true, group="[IRISBOT]----------", inline="5", tooltip="하나의 거래소에서 이 전략을 몇 % 비중으로 투자할 것인가?") * 0.01
leverage = input.float(1,           "Leverage", confirm=true, group="[IRISBOT]----------", inline="5")
isPlotMsg = input.bool(false, "View alert msg", confirm=true, group="[IRISBOT]----------", inline="6")

//****************************************************************************//
// Process
//****************************************************************************//
ema25=ta.ema(close, emaLen25)
ema50=ta.ema(close, emaLen50)

// Entry condition
longCondition  = isLong and ta.crossover(ema25, ema50)
shortCondition = isShort and ta.crossunder(ema25, ema50)

// Entry price
var price=0.0
var pricePlot=0.0
if (longCondition or shortCondition) and strategy.position_size == 0
    price:=close
pricePlot:=price
if (strategy.position_size==0)
    pricePlot:=na

// Amount
amount = str.tostring(stRatio*100)

// IRISBOT alert msg (for auto trading, you can change this for autoview, tvextbot, thanksbot, etc webhookbot)
msgLong  = '{"exchange":"'+exchange+'","account":"'+account+'","strategy":"'+strategy+'","symbol":"'+symbol+'","type":"market","side":"buy","amount":"'+amount+'%","leverage":"'+str.tostring(leverage)+'","token":"'+token+'"}'
msgShort = '{"exchange":"'+exchange+'","account":"'+account+'","strategy":"'+strategy+'","symbol":"'+symbol+'","type":"market","side":"sell","amount":"'+amount+'%","leverage":"'+str.tostring(leverage)+'","token":"'+token+'"}'
msgExit  = '{"exchange":"'+exchange+'","account":"'+account+'","strategy":"'+strategy+'","symbol":"'+symbol+'","type":"market","side":"close","token":"'+token+'"}'

// Entry signal
if inDateRange
    strategy.entry("L", strategy.long,  when=longCondition,  comment="L", alert_message=msgLong)
    strategy.entry("S", strategy.short, when=shortCondition, comment="S", alert_message=msgShort)
    strategy.exit("XL", "L", profit=price*tpLong/syminfo.mintick,  loss=price*slLong/syminfo.mintick,  comment="X", alert_message=msgExit)
    strategy.exit("XS", "S", profit=price*tpShort/syminfo.mintick, loss=price*slShort/syminfo.mintick, comment="X", alert_message=msgExit)

//****************************************************************************//
// Plot
//****************************************************************************//
// Alert msg plot
var msgTable = table.new(position = position.bottom_right, columns = 2, rows = 3, bgcolor = color.new(color.blue, 80), border_width = 1)
if isPlotMsg
    if isLong
        table.cell(msgTable, 0, 0, "Long",  text_halign = text.align_left)
        table.cell(msgTable, 1, 0, msgLong,  text_halign = text.align_left)

    if isShort
        table.cell(msgTable, 0, 1, "Short", text_halign = text.align_left, bgcolor=color.new(color.red, 80))
        table.cell(msgTable, 1, 1, msgShort, text_halign = text.align_left, bgcolor=color.new(color.red, 80))

    if isLong or isShort
        table.cell(msgTable, 0, 2, "Exit",  text_halign = text.align_left, bgcolor=color.new(color.purple, 80))
        table.cell(msgTable, 1, 2, msgExit,  text_halign = text.align_left, bgcolor=color.new(color.purple, 80))

// EMA
e0=plot(ema25, "Short", color.green)
e1=plot(ema50, "Long", color.red)
fill(e0, e1, ema25>ema50 ? color.new(color.green, 50) : color.new(color.red, 50), "EMA BG")

// TP & SL
p0=plot(pricePlot, "Entry", color.black, style=plot.style_linebr)
p1=plot(pricePlot*(strategy.position_size>0 ? 1+tpLong : 1-tpShort), "TP", color.new(color.green, 50), style=plot.style_linebr)
p2=plot(pricePlot*(strategy.position_size>0 ? 1-slLong : 1+slShort), "SL", color.new(color.red, 50), style=plot.style_linebr)
fill(p0, p1, color.new(color.green, 80), "TP BG")
fill(p0, p2, color.new(color.red, 80), "SL BG")Published by ChaoZhang on the FMZ strategy square · last modified 2024-02-22. Collected in the Quant Trading Vault. Unvalidated research: re-test with your own data and costs before trusting it.
Build this with AgenKit
A spec is not a trading system. Paste this into your coding agent and AgenKit runs a specialist team — architecture, test-first build, risk gates, review — with paper trading on by default.
/agenkit build a production-grade trading bot with a backtest engine, risk controls and paper trading by default from strategies/Dual-EMA-Crossover-Strategy-442537.md- npx agenkit install engineering-kit in your project
- Paste the command into your agent and approve each phase
- Get tests, backtest, risk controls and a paper-trading switch
Understand it first
Before you run this, read the lesson behind the idea and how to backtest it honestly. Specs like this one are the survivors of an unknown number of trials; deflate their results accordingly.
Related specs
- 200 EMA VWAP MFI Trend Following StrategyPine Script · Trend following · 1d
- 4 EMA Trend StrategyPine Script · Trend following · 1d
- ADX MA and EMA Long Only Trend Tracking StrategyPine Script · Trend following · 1d
- ATR Dynamic Trend Following and EMA Crossover Trading StrategyPine Script · Trend following · 1d
- ATR and Moving Average Crossover Hybrid StrategyPine Script · Trend following · 1h
- ATR and T3 Moving Average StrategyPine Script · Trend following · 5m