Strategy vault / Trend following
Dual EMA Intelligent Tracking Strategy
This strategy is a dual EMA indicator-based trend tracking strategy. By calculating the fast EMA line and slow EMA line and determining golden cross and death cross, it realizes low buying high selling to…
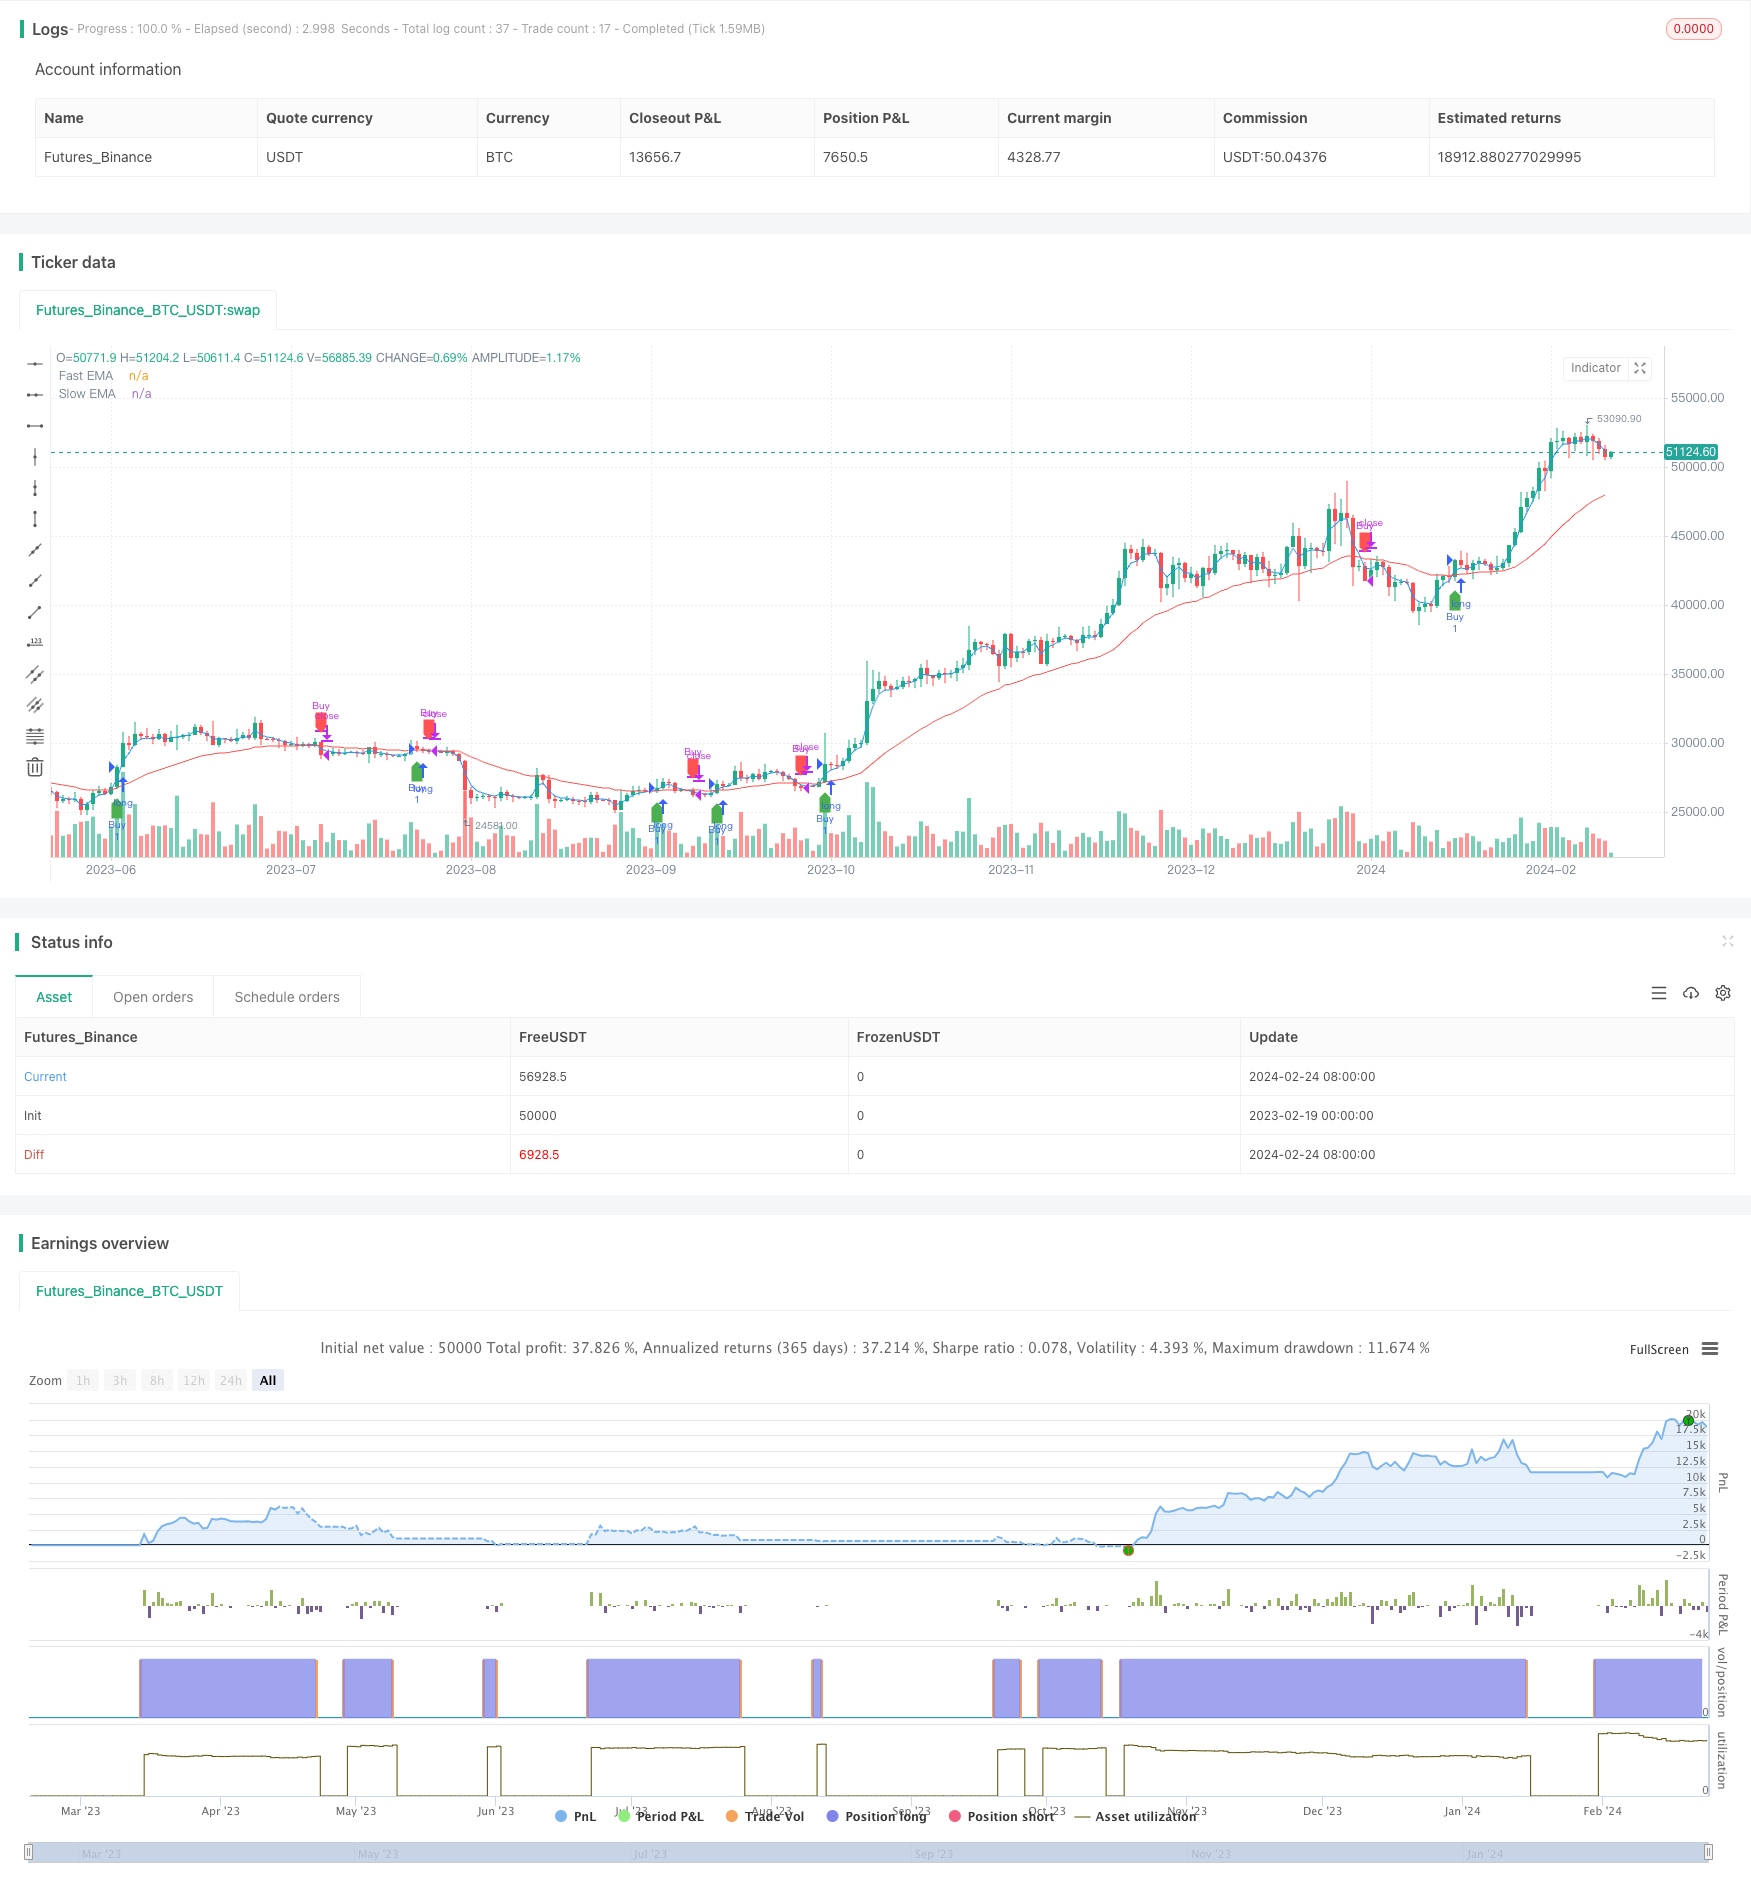
Overview
This strategy is a dual EMA indicator-based trend tracking strategy. By calculating the fast EMA line and slow EMA line and determining golden cross and death cross, it realizes low buying high selling to automatically track market trends.
Strategy Principle
The core indicator of this strategy is the dual EMA, including the fast EMA line and slow EMA line. The fast EMA line has a length of 3 days and reacts sensitively. The slow EMA line has a length of 30 days and reacts slowly. When the fast line crosses above the slow line, a golden cross signal is generated, indicating the market is entering an upward trend, and the strategy will open long positions at this time. When the fast line crosses below the slow line, a death cross signal is generated, indicating the market is entering a downward trend, and the strategy will close positions at this time. By using such fast and slow EMA line crosses to track changes in market trends, the strategy can automatically switch position directions to achieve low buying and high selling.
Advantage Analysis
The biggest advantage of this strategy is that it can automatically identify market trends and flexibly adjust positions accordingly. Specifically, the main advantages are as follows:
The combination of the sensitivity of the fast EMA and the stability of the slow EMA can accurately capture inflection points in trends while filtering out noise to prevent false signals.
Using dual EMA crossover signals, positions are only adjusted when significant trend changes occur, avoiding excessive frequency of trading.
The strategy logic is simple and clear, easy to understand and modify, and convenient to backtest and optimize quantitatively.
High capital utilization efficiency, maintains positions most of the time to track trends.
Risk and Solution Analysis
The dual EMA indicator belongs to the trend tracking strategy, which cannot predict or avoid the risks of major fluctuations or special events. The risk control method is to appropriately shorten the holding period and stop loss in time.
The EMA indicator is sensitive to parameters. Improper fast and slow line parameter settings may lead to poor strategy performance. The optimal parameters can be found through systematic backtesting optimization methods.
The dual EMA indicator may generate false signals in some shocks or sideways trends. Consider introducing other auxiliary indicators for signal filtering on the basis of EMA.
The dual EMA strategy belongs to the tracking strategy, not good at selecting important technical turning points. Consider introducing K-line patterns and other auxiliary judgments at critical technical positions.
Optimization Directions
The following aspects of this strategy can be further optimized:
Optimize the parameters of the fast and slow EMA lines to find the best parameter combination.
Increase other indicators to build multi-factor models and improve signal accuracy. Such as introducing BOLL derivatives indicators, etc.
Add stop loss strategies to control single transaction risks. Such as introducing trailing stops, etc.
The optimal parameters may differ across products. Consider factor decomposition to find parameters most suitable for each product.
Machine learning methods can be tried for time-driven hyperparameter optimization.
Explore K-line pattern recognition at key technical positions to capture larger degree reversals.
Conclusion
In summary, this is a simple and practical dual EMA trend tracking strategy. It automatically adjusts positions by determining market stages through fast and slow EMA crosses. The strategy logic is concise and clear, easy to implement quantitatively. At the same time, there is room for further optimization to improve signal accuracy and control risks to make it a high-quality quantitative strategy for actual trading.
Parameters
| Name | Default | What it controls |
|---|---|---|
| v_input_1 | 3 | Fast EMA Length |
| v_input_2 | 30 | Slow EMA Length |
| v_input_3 | 100 | Profit Percentage |
Source Pine Script
/*backtest
start: 2023-02-19 00:00:00
end: 2024-02-25 00:00:00
period: 1d
basePeriod: 1h
exchanges: [{"eid":"Futures_Binance","currency":"BTC_USDT"}]
*/

//@version=5
strategy("EMA Crossover Strategy with Target", shorttitle="EMACross", overlay=true)

// Define input parameters
fastLength = input(3, title="Fast EMA Length")
slowLength = input(30, title="Slow EMA Length")
profitPercentage = input(100.0, title="Profit Percentage")

// Calculate EMAs
fastEMA = ta.ema(close, fastLength)
slowEMA = ta.ema(close, slowLength)

// Plot EMAs on the chart
plot(fastEMA, color=color.blue, title="Fast EMA")
plot(slowEMA, color=color.red, title="Slow EMA")

// Buy condition: 3EMA crosses above 30EMA
buyCondition = ta.crossover(fastEMA, slowEMA)

// Sell condition: 3EMA crosses below 30EMA or profit target is reached
sellCondition = ta.crossunder(fastEMA, slowEMA) or close >= (strategy.position_avg_price * (1 + profitPercentage / 100))

// Target condition: 50 points profit
//targetCondition = close >= (strategy.position_avg_price + 50)

// Execute orders
// strategy.entry("Buy", strategy.long, when=buyCondition)
// strategy.close("Buy", when=sellCondition )
if (buyCondition)
    strategy.entry("Buy", strategy.long)

if (sellCondition)
    strategy.close("Buy")

// // Execute sell orders
// strategy.entry("Sell", strategy.short, when=sellCondition)
// strategy.close("Sell", when=buyCondition)

// Plot buy and sell signals on the chart
plotshape(series=buyCondition, title="Buy Signal", color=color.green, style=shape.labelup, location=location.belowbar)
plotshape(series=sellCondition, title="Sell Signal", color=color.red, style=shape.labeldown, location=location.abovebar)
Published by ChaoZhang on the FMZ strategy square · last modified 2024-02-26. Collected in the Quant Trading Vault. Unvalidated research: re-test with your own data and costs before trusting it.
Build this with AgenKit
A spec is not a trading system. Paste this into your coding agent and AgenKit runs a specialist team — architecture, test-first build, risk gates, review — with paper trading on by default.
/agenkit build a production-grade trading bot with a backtest engine, risk controls and paper trading by default from strategies/Dual-EMA-Intelligent-Tracking-Strategy.md- npx agenkit install engineering-kit in your project
- Paste the command into your agent and approve each phase
- Get tests, backtest, risk controls and a paper-trading switch
Understand it first
Before you run this, read the lesson behind the idea and how to backtest it honestly. Specs like this one are the survivors of an unknown number of trials; deflate their results accordingly.
Related specs
- 200 EMA VWAP MFI Trend Following StrategyPine Script · Trend following · 1d
- 4 EMA Trend StrategyPine Script · Trend following · 1d
- ADX MA and EMA Long Only Trend Tracking StrategyPine Script · Trend following · 1d
- ATR Dynamic Trend Following and EMA Crossover Trading StrategyPine Script · Trend following · 1d
- ATR and Moving Average Crossover Hybrid StrategyPine Script · Trend following · 1h
- ATR and T3 Moving Average StrategyPine Script · Trend following · 5m