Dual EMA Trend Momentum Trading Strategy
This is a quantitative trading strategy based on dual EMA crossover and trend following. The strategy primarily utilizes 47-period and 95-period Exponential Moving Averages (EMA) to capture market trends, executing…
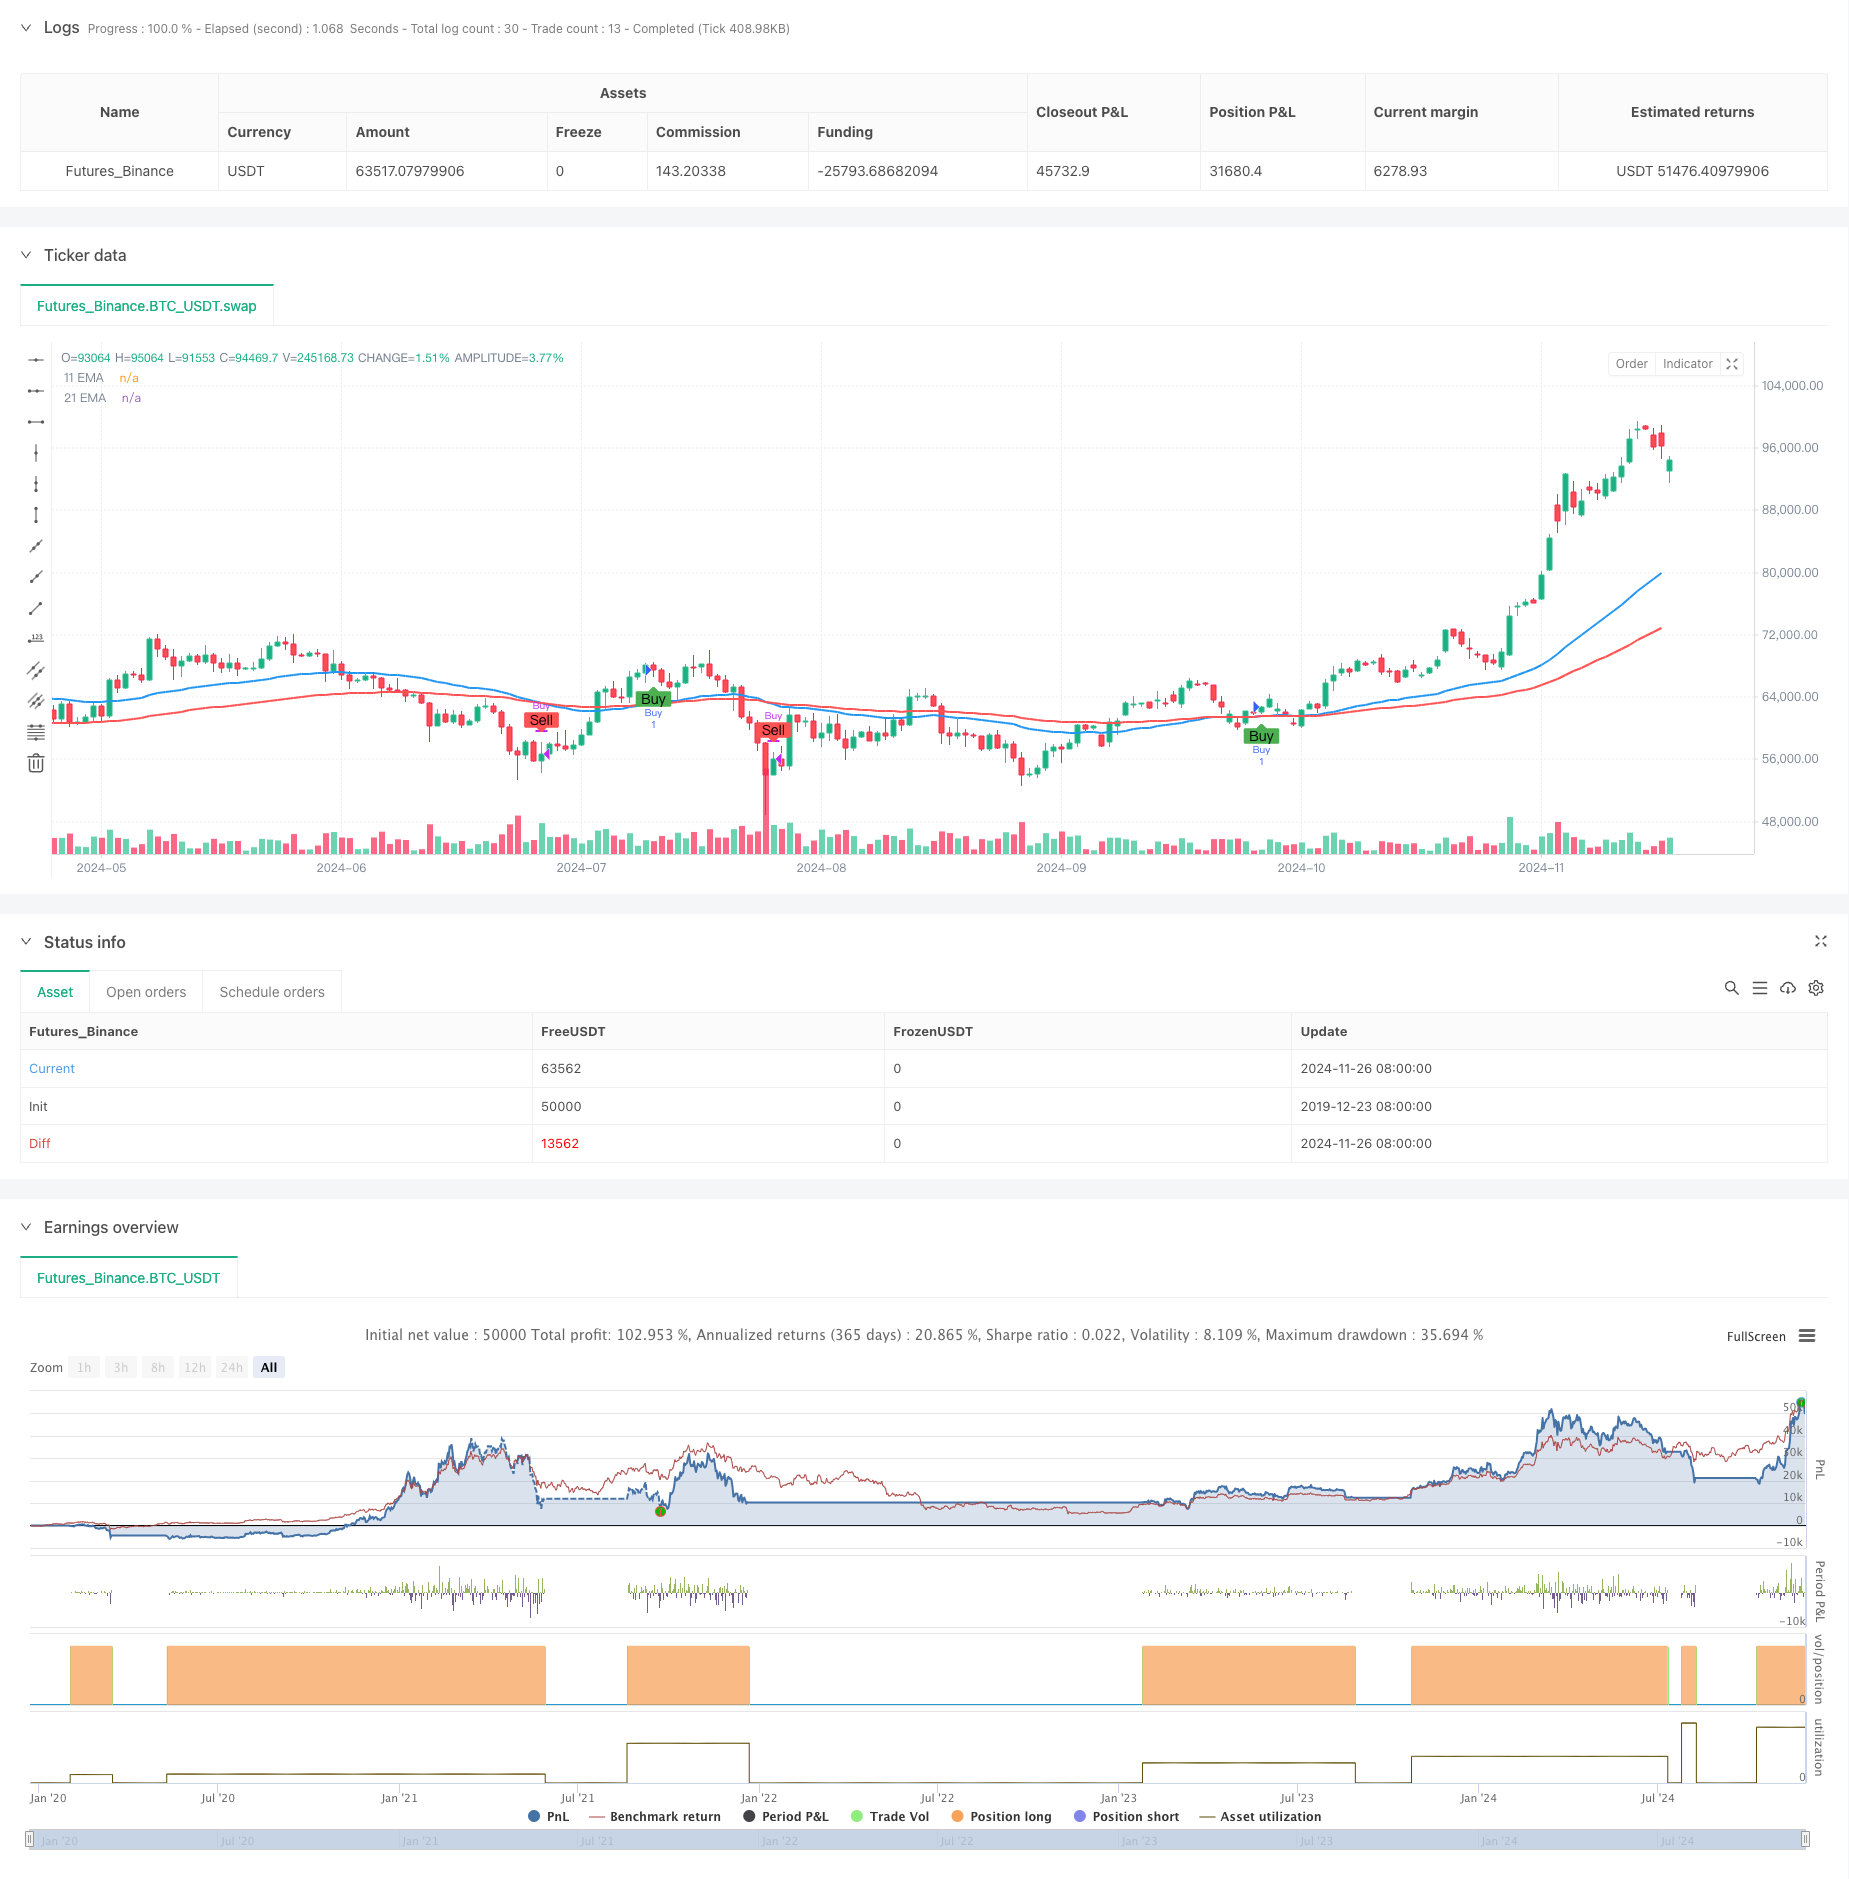
Overview
This is a quantitative trading strategy based on dual EMA crossover and trend following. The strategy primarily utilizes 47-period and 95-period Exponential Moving Averages (EMA) to capture market trends, executing trades based on EMA crossover signals. Operating on a 15-minute timeframe, it combines technical analysis and momentum trading principles to achieve consistent trading returns.
Strategy Principles
The core mechanism relies on identifying trend changes through crossovers between short-term EMA (47-period) and long-term EMA (95-period). Buy signals are generated when the short-term EMA crosses above the long-term EMA, while positions are closed when the short-term EMA crosses below. This design is based on price momentum and trend continuation principles, using EMA crossovers to confirm trend transition points.
Strategy Advantages
- Clear Signals: Dual EMA crossovers provide explicit entry and exit signals, reducing uncertainty from subjective judgment.
- Trend Following: The strategy effectively captures medium to short-term trends, generating profits during trend continuation.
- High Automation: Simple and clear strategy logic enables easy programming implementation and backtesting.
- Strong Adaptability: Strategy can be adapted to different market environments by adjusting EMA periods.
- Controlled Risk: Systematic trading rules help control emotional fluctuations and maintain trading discipline.
Strategy Risks
- Poor Performance in Ranging Markets: Frequent false breakouts in sideways markets may lead to consecutive losses.
- Lag Effect: EMA indicators have inherent lag, potentially missing optimal entry points or experiencing larger drawdowns during trend reversals.
- Parameter Dependency: Strategy performance heavily relies on EMA period selection, requiring different parameters for different markets.
- Capital Management: Lack of comprehensive stop-loss mechanisms may result in significant losses during volatile periods.
Optimization Directions
- Incorporate Volatility Indicators: Add ATR indicator for dynamic stop-loss adjustment to enhance risk control.
- Add Trend Filters: Combine RSI or MACD indicators to screen for more reliable trading signals.
- Optimize Parameter Selection: Implement machine learning methods for automatic selection of optimal EMA periods in different market environments.
- Improve Capital Management: Enhance position sizing and risk control modules, set maximum loss percentage per trade.
- Include Market Environment Analysis: Introduce market structure analysis to reduce trading frequency or pause trading during ranging markets.
Conclusion
This is a well-structured and logically rigorous trend-following strategy. It captures market trends through dual EMA crossovers, offering good operability and scalability. While certain limitations exist, continuous optimization and improvement can develop it into a stable and reliable trading system. The key is to flexibly adjust parameters based on different market characteristics and establish comprehensive risk control mechanisms.
Source Pine Script
/*backtest
start: 2019-12-23 08:00:00
end: 2024-11-27 08:00:00
period: 1d
basePeriod: 1d
exchanges: [{"eid":"Futures_Binance","currency":"BTC_USDT"}]
*/

//@version=5
strategy("EMA Crossover Strategy", overlay=true)

// Define the EMA periods
shortEmaPeriod = 47
longEmaPeriod = 95

// Calculate EMAs
ema11 = ta.ema(close, shortEmaPeriod)
ema21 = ta.ema(close, longEmaPeriod)

// Plot EMAs on the chart
plot(ema11, title="11 EMA", color=color.blue, linewidth=2)
plot(ema21, title="21 EMA", color=color.red, linewidth=2)

// Generate trading signals
longSignal = ta.crossover(ema11, ema21)
shortSignal = ta.crossunder(ema11, ema21)

// Execute trades based on signals
if (longSignal)
    strategy.entry("Buy", strategy.long)

if (shortSignal)
    strategy.close("Buy")

// Optional: Plot buy and sell signals on the chart
plotshape(series=longSignal, location=location.belowbar, color=color.green, style=shape.labelup, text="Buy")
plotshape(series=shortSignal, location=location.abovebar, color=color.red, style=shape.labeldown, text="Sell")

// Plot buy/sell signals on the main chart
plotshape(series=longSignal, location=location.belowbar, color=color.green, style=shape.labelup, text="Buy")
plotshape(series=shortSignal, location=location.abovebar, color=color.red, style=shape.labeldown, text="Sell")
Published by ChaoZhang on the FMZ strategy square · last modified 2024-11-29. Collected in the Quant Trading Vault. Unvalidated research: re-test with your own data and costs before trusting it.
Build this with AgenKit
A spec is not a trading system. Paste this into your coding agent and AgenKit runs a specialist team — architecture, test-first build, risk gates, review — with paper trading on by default.
/agenkit build a production-grade trading bot with a backtest engine, risk controls and paper trading by default from strategies/Dual-EMA-Trend-Momentum-Trading-Strategy.md- npx agenkit install engineering-kit in your project
- Paste the command into your agent and approve each phase
- Get tests, backtest, risk controls and a paper-trading switch
Understand it first
Before you run this, read the lesson behind the idea and how to backtest it honestly. Specs like this one are the survivors of an unknown number of trials; deflate their results accordingly.
Related specs
- Advanced Multi Indicator Trend Following and Momentum Quantitative Trading StrategyPine Script · Momentum · 1h
- KST EMA Momentum Trend Following StrategyPine Script · Momentum · 1d
- Multi Indicator Comprehensive Momentum Trading StrategyPine Script · Momentum · 1d
- Multi Indicator Trend Momentum Trading Strategy with Dynamic Risk Management SystemPine Script · Momentum · 1h
- Multi Technical Indicator Based Trend Following and Momentum StrategyPine Script · Momentum · 1d
- Multi EMA Trend Following Strategy with RSI MACD Momentum ValidationPine Script · Momentum · 4h