Strategy vault / Mean reversion
Dual Indicator Hybrid Quantitative Trading Strategy
This strategy combines dual indicators to identify trend direction and make trades. Firstly, it uses the crossover of two moving averages (fast and medium) to judge short-term trend; secondly, it uses channel range…
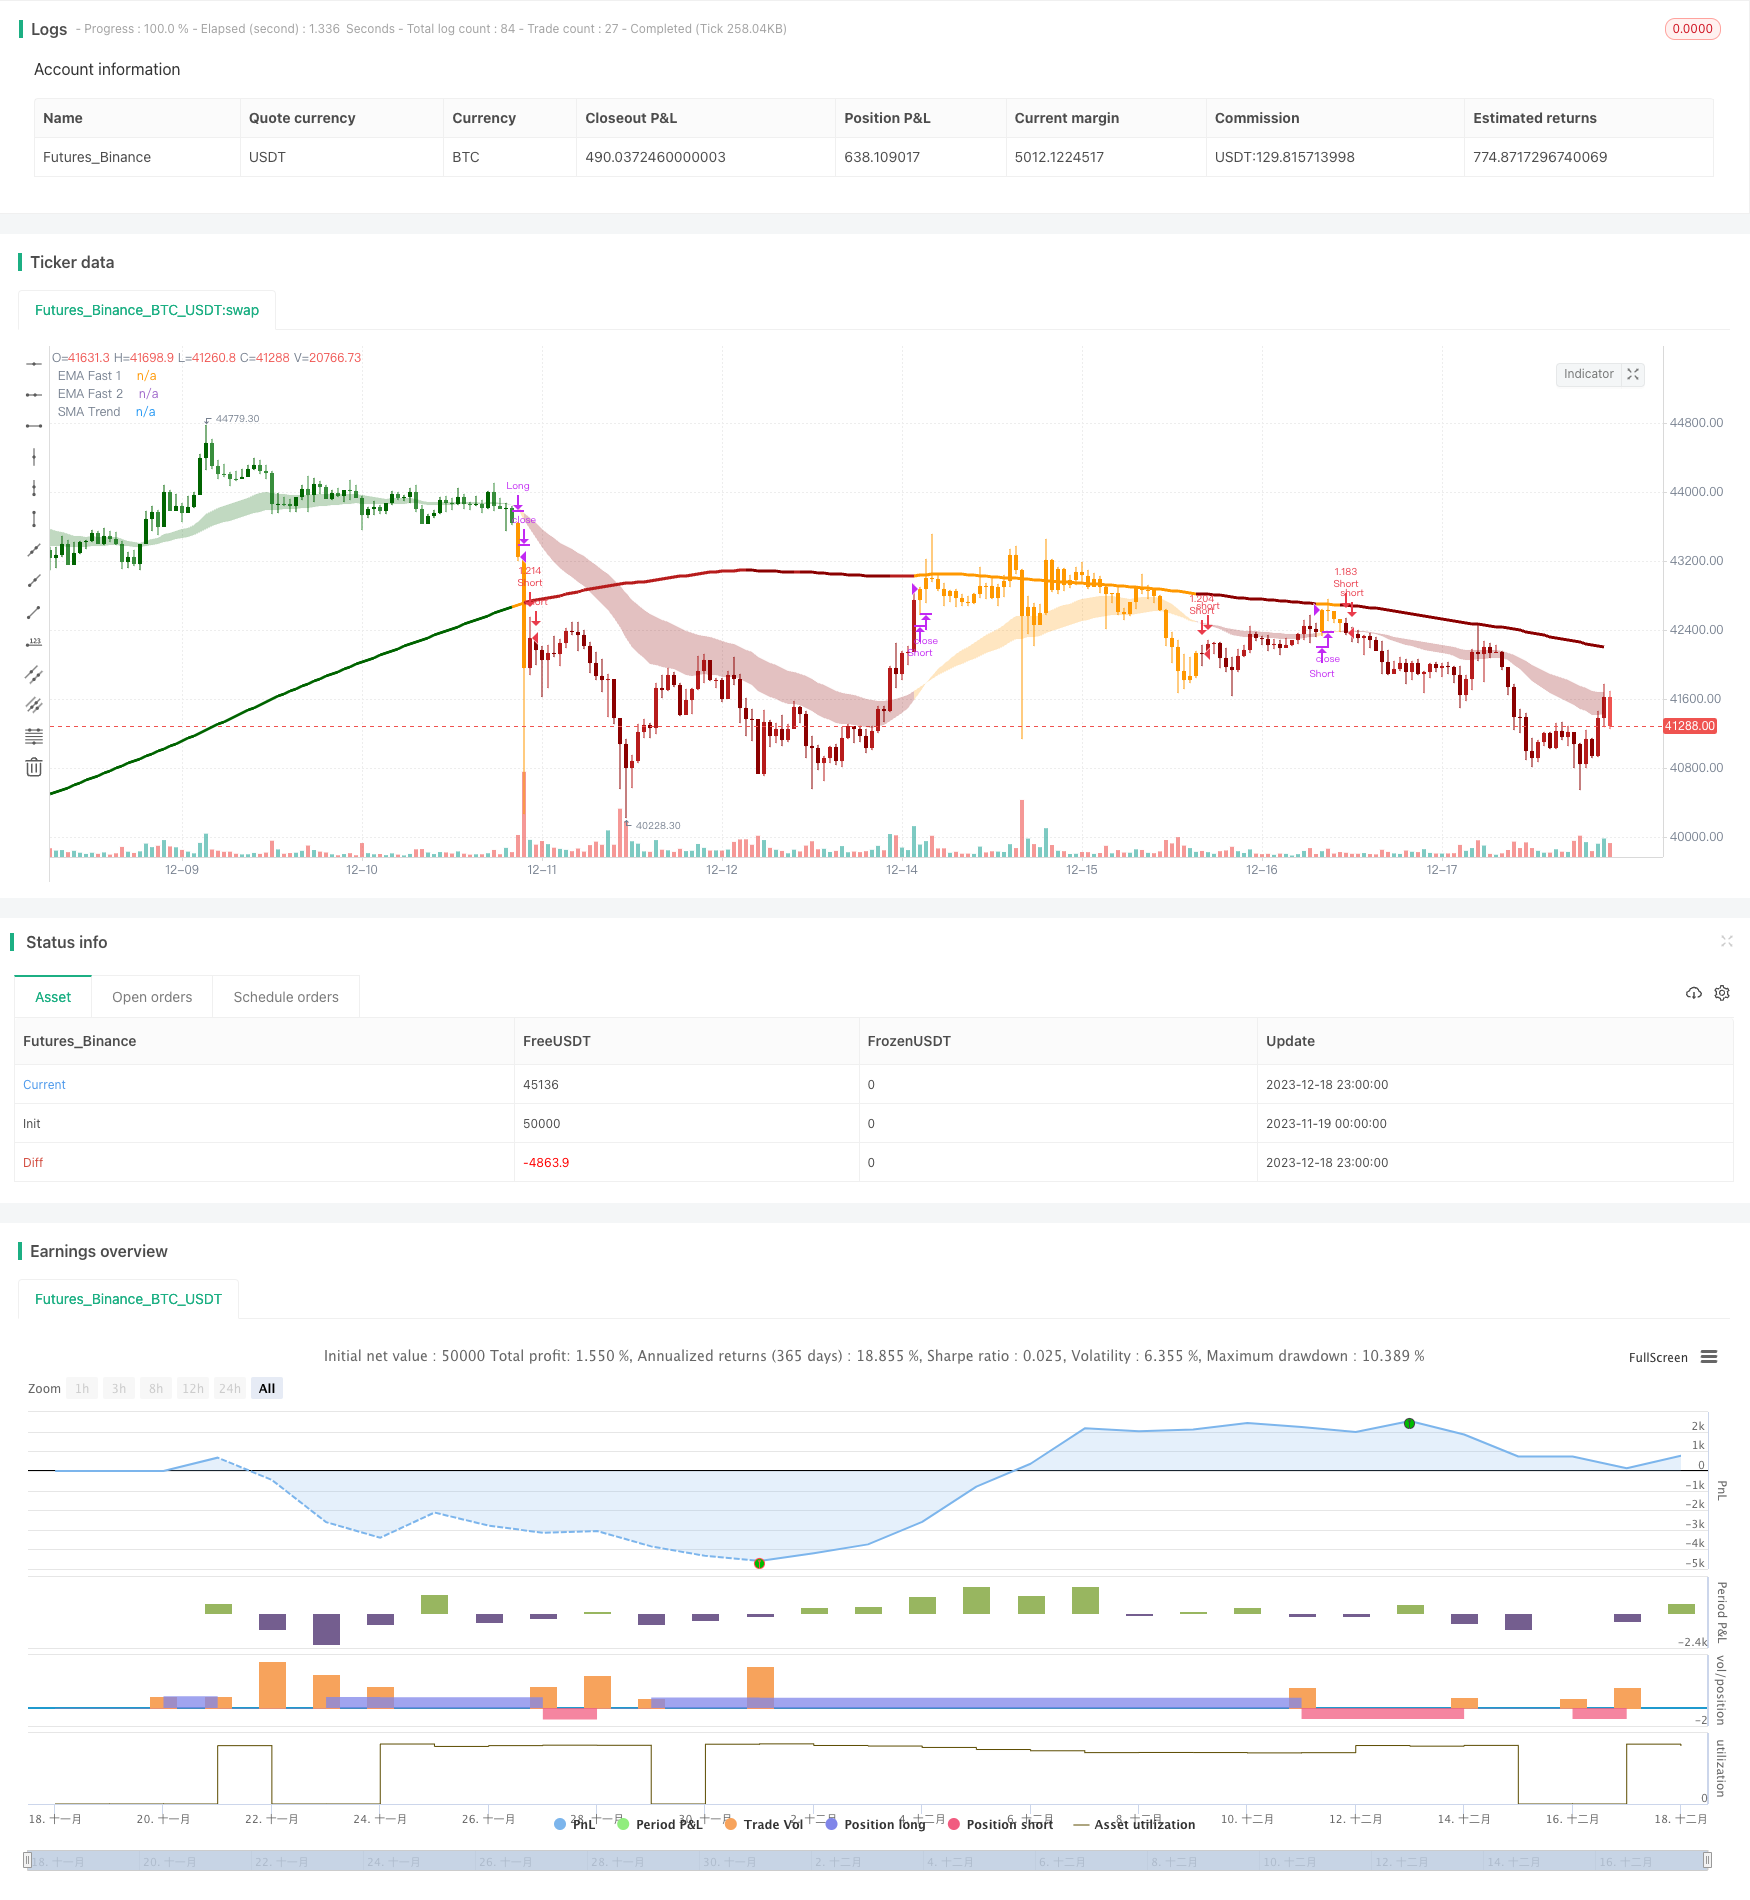
Overview
This strategy combines dual indicators to identify trend direction and make trades. Firstly, it uses the crossover of two moving averages (fast and medium) to judge short-term trend; secondly, it uses channel range and long term moving average to determine the main trend direction. Trading signals are generated only when the two judgments are consistent. The hybrid strategy using multiple indicators can effectively filter false signals and improve stability.
Strategy Principle
The strategy uses three sets of indicators for judgment. First, the golden cross and death cross of fast EMA (26 periods) and medium EMA (50 periods) to determine short-term trend; secondly, calculate the channel range to judge medium-term trend; finally, calculate long term SMA (200 periods) and compare with price to determine major trend direction. Trading signals are generated only when all three judgments are consistent.
Specifically, the logic is:
Crossover of fast and medium moving averages (golden cross for bullish, death cross for bearish) to determine short-term trend.
Whether the price breaks through the channel range to determine medium-term trend. The channel range is based on long term MA plus/minus ATR times a coefficient. Breaking upper limit signals bullish, breaking lower limit signals bearish.
Comparing price with long term MA to determine major trend.
Finally, trading signals are generated only when all three judgments are consistent. This hybrid mechanism can effectively filter false signals and improve stability.
Strategy Advantages
This dual indicator hybrid strategy has several advantages:
Effectively filter false signals and improve stability. Because trading signals need validation from multiple indicators to avoid errors from single metric.
High flexibility to adjust parameters for different markets. Parameters of MA and channel range can be adjusted for various environments.
Combine trend trading and range trading. Medium and short term indicators catch trends, long term indicator determines range. Overall possesses the merits of both trend and mean-reversion strategies.
High capital usage efficiency. Place orders only when multiple indicators agree, capital can be effectively utilized to avoid unnecessary trades.
Strategy Risks
There are also some risks:
Parameter setting risk. MA periods and channel range need proper configuration, improper settings may fail to detect trends or cause excessive false signals.
Increased opportunity cost from dual indicators. Compared to single indicator strategies, some trading opportunities may be missed, unable to enter and exit at the optimal points.
Stop loss mechanism needs prudence. The breakout stop loss here may cause unnecessary losses. Stop loss percentage needs careful configuration.
May underperform in highly volatile markets. This strategy works better in markets with apparent trend.
Strategy Optimization
The strategy can be improved from the following aspects:
Test different parameter combinations to find optimum. More backtests with historical data to locate optimal configurations.
Add adaptive stop loss mechanism. Dynamically tune stop loss level based on Volatility Indicator.
Assist with volume indicators at critical points. Judge position sizing with volume to improve capital efficiency.
Optimize entry logic. Consider staged entries with cost averaging to reduce single entry risk.
Combine machine learning models. Introduce neural networks to judge model robustness and fitness.
Summary
This strategy leverages triple time frame indicators and dual validation to suppress false signals and improve stability. Meanwhile, it possesses the merits of both trend and range trading, with high capital usage efficiency. It can be enhanced via parameter optimization, stop loss tuning, integrating with volume indicators etc. A recommended hybrid quantitative strategy.
Parameters
| Name | Default | What it controls |
|---|---|---|
| v_input_bool_6 | false | ■ Golden Cross On/Off |
| v_input_source_1_close | 0 | (?EMAs)MA Source: close | high | low | open | hl2 | hlc3 | hlcc4 | ohlc4 |
| v_input_int_1 | 26 | EMA Fast |
| v_input_int_2 | 50 | EMA Medium |
| v_input_int_3 | 200 | (?Trend Channel)MA Trend |
| v_input_string_1 | 0 | MA Type: SMA | EMA |
| v_input_timeframe_1 | Select Higher Timeframe | |
| v_input_float_1 | 0.618 | Channel Range Length |
| v_input_bool_1 | false | (?Stop Loss)■ Stop Loss On/Off |
| v_input_float_2 | 2.618 | SL % |
| v_input_bool_2 | true | (?Period)■ Period On/Off |
| v_input_1 | o_start | Start Time |
| v_input_2 | o_end | End Time |
| v_input_string_2 | 0 | (?Strategy)Position Type: Both | Only Short | Only Long |
| v_input_string_3 | 0 | Strategy Type: Strategy 2 | Strategy 1 |
| v_input_bool_3 | true | (?Display)■ Bar Color On/Off |
| v_input_bool_4 | false | ■ Alert On/Off |
| v_input_bool_5 | false | ■ Channel Range On/Off |
| v_input_string_4 | {{strategy.order.comment}} | Setting alert |
Source Pine Script
/*backtest
start: 2023-11-19 00:00:00
end: 2023-12-19 00:00:00
period: 1h
basePeriod: 15m
exchanges: [{"eid":"Futures_Binance","currency":"BTC_USDT"}]
*/

//@version=5
// Indicator to combines:
//           Trend Channel[Gu5] (SMA 200) +
//           EMA's cross  (26, 50 ) +
//           Golden Cross (50, 200)
// Author: @gu5tavo71 08/2019
// v2.3.6, 2022.02.18
// Trend Channel [Gu5] // Author: @gu5tavo71 08/2019
//
// This source code is subject to these terms:
// Attribution-NonCommercial 4.0 International (CC BY-NC 4.0)
// https://www.safecreative.org/work/2202190517452-mix1-ema-cross-trend-channel-gu5-
// You are free to:
// Share, copy and redistribute this script
// Adapt, transform and build on this script
// Under the following terms:
// Non-commercial: You cannot sell my indicator. You can't sell my work.
// Attribution: If you post part of my code, you must give me proper credit
//
// I am using part of this code published by @PineCoders and Public Library
// Disclaimer: I am not a financial advisor.
//             For purpose educate only. Use at your own risk.
strategy(title = 'Mix1 : Ema Cross + Trend Channel [Gu5] - Backtest', shorttitle = 'Mix01', overlay = true,
  initial_capital = 100,
  default_qty_value = 100,
  default_qty_type = strategy.percent_of_equity,
  commission_value = 0.075,
  commission_type = strategy.commission.percent,
  format = format.price,
  precision = 2,
  process_orders_on_close = true)


// ---------   Inputs                       "=============================="           |
i_maSrc      = input.source     (close,     'MA Source'                     , group    = 'EMAs')
i_maFast1    = input.int        (26,        'EMA Fast'                      , group    = 'EMAs')
i_maFast2    = input.int        (50,        'EMA Medium'                    , group    = 'EMAs')
i_maLen      = input.int        (200,       'MA Trend'                      , group    = 'Trend Channel')
o_maLen1     =                              'EMA'
o_maLen2     =                              'SMA'
i_maLenSel   = input.string     (o_maLen2,  'MA Type'                       , group    = 'Trend Channel',
               options = [o_maLen1, o_maLen2],
               tooltip = "EMA or SMA")
i_htf        = input.timeframe  ('',        'Select Higher Timeframe'       , tooltip  = 'Only for MA Trend'  , group    = 'Trend Channel')
i_rangeLen   = input.float      (0.618,     'Channel Range Length'          , tooltip  = 'ATR of the MA Trend', group    = 'Trend Channel')
i_slOn       = input.bool       (false,     '■ Stop Loss On/Off'            , group    = 'Stop Loss')
i_sl         = input.float      (2.618,     'SL %'                          , step     = 0.1, group    = 'Stop Loss')
i_periodSw   = input.bool       (true,      '■ Period On/Off'               , group    = 'Period')
o_start      = timestamp        (           '2020-01-01 00:00 GMT-3'        )
o_end        = timestamp        (           '2099-12-31 00:00 GMT-3'        )
i_periodStar = input       (o_start,   'Start Time'                    , group    = 'Period')
i_periodEnd  = input       (o_end,     'End Time'                      , group    = 'Period')
o_posSel1    =                              'Only Long'
o_posSel2    =                              'Only Short'
o_posSel3    =                              'Both'
i_posSel     = input.string     (o_posSel3, 'Position Type'                 , group   = 'Strategy',
               options = [o_posSel1, o_posSel2, o_posSel3],
               tooltip = "Only Long, Only short or Both")
o_typeS1     =                              'Strategy 1'
o_typeS2     =                              'Strategy 2'
i_typeS      = input.string     (o_typeS2,  'Strategy Type'                 , group   = 'Strategy',
               options = [o_typeS1, o_typeS2],
               tooltip = "Strategy 1:\nLong, when the price (close) crosses the ema.\nStrategy 2:\nLong, only when ema goes up")
i_barColOn   = input.bool       (true,      '■ Bar Color On/Off'            , group   = 'Display')
i_alertOn    = input.bool       (false,     '■ Alert On/Off'                , group   = 'Display')
i_channelOn  = input.bool       (false,     '■ Channel Range On/Off'        , tooltip = 'If the price (close) is over than the channel, the trend is bullish. If the price is under, bearish. And if the price is in the channel, it is in range', group   = 'Display')
i_goldenOn   = input.bool       (false,     '■ Golden Cross On/Off'         )
o_alert      =                              '{{strategy.order.comment}}'
i_alert      = input.string     (o_alert,   'Setting alert'                 , tooltip = 'For Alerts, just copy {{strategy.order.comment}} and paste in alert window.', group   = 'Display')

// ---------   Calculations
maFast1      = ta.ema(i_maSrc, i_maFast1)
maFast2      = ta.ema(i_maSrc, i_maFast2)
maDir        = maFast1 > maFast2 ? 1 : -1
maTrend      = request.security(syminfo.tickerid, i_htf,
               i_maLenSel == "SMA" ? ta.sma(close, i_maLen)[1] : ta.ema(close, i_maLen)[1],
               lookahead = barmerge.lookahead_on)  //No repaint
maTrendDir   = i_maSrc >= maTrend ? 1 : -1
rangeAtr     = ta.atr(i_maLen) * i_rangeLen
rangeTop     = maTrend + rangeAtr
rangeBot     = maTrend - rangeAtr
rangeCh      = (open <= rangeTop or close <= rangeTop) and
               (open >= rangeBot or close >= rangeBot)
trendDir     = i_typeS  ==  'Strategy 1'                            ?
               rangeCh                                                ?  0 :
               maTrendDir ==  1 and maDir ==  1 and maTrend > maFast2 ?  0 :
               maTrendDir == -1 and maDir == -1 and maTrend < maFast2 ?  0 :
               maTrendDir ==  1 and maDir ==  1                       ?  1 :
               maTrendDir == -1 and maDir == -1                       ? -1 : 0 :
               rangeCh                                                ?  0 :
               maTrendDir ==  1 and maDir ==  1                       ?  1 :
               maTrendDir == -1 and maDir == -1                       ? -1 : 0
GCross       = i_goldenOn ? ta.crossover (maFast2, maTrend) : na
DCross       = i_goldenOn ? ta.crossunder(maFast2, maTrend) : na

period       = true
// Set initial values
condition    = 0.0
entryLong    = trendDir ==  1 and
               i_posSel != 'Only Short' and
               (i_periodSw ? period : true)
entryShort   = trendDir == -1 and
               i_posSel != 'Only Long' and
               (i_periodSw ? period : true)
exitLong     = (trendDir !=  1 or maDir == -1) and
               condition[1] == 1 and
               i_posSel != 'Only Short' and
               (i_periodSw ? period : true)
exitShort    = (trendDir != -1 or maDir ==  1) and
               condition[1] == -1 and
               i_posSel != 'Only Long' and
               (i_periodSw ? period : true)
closeCond    = exitLong or exitShort
// Stop Loss (sl)
slEntry      = close * i_sl / 100
slTop        = close + slEntry
slBot        = close - slEntry
slTopBuff    = ta.valuewhen(condition[1] !=  1 and entryLong,  slBot, 0)
slBotBuff    = ta.valuewhen(condition[1] != -1 and entryShort, slTop, 0)
slLine       = condition[1] == -1 and entryLong  ? slTopBuff :
               condition[1] ==  1 and entryShort ? slBotBuff :
               condition[1] ==  1  or entryLong  ? slTopBuff :
               condition[1] == -1  or entryShort ? slBotBuff : na
slTopCross   = condition[1] ==  1 and ta.crossunder(close, slLine) or high > slLine and low < slLine
slBotCross   = condition[1] == -1 and ta.crossover (close, slLine) or high > slLine and low < slLine
slExit       = i_slOn ? slTopCross or slBotCross : na
// Conditions
condition   := condition[1] !=  1 and entryLong  ?  1 :
               condition[1] != -1 and entryShort ? -1 :
               condition[1] !=  0 and slExit     ?  0 :
               condition[1] !=  0 and exitLong   ?  0 :
               condition[1] !=  0 and exitShort  ?  0 : nz(condition[1])
long         = condition[1] !=  1 and condition ==  1
short        = condition[1] != -1 and condition == -1
xl           = condition[1] ==  1 and exitLong and not slExit
xs           = condition[1] == -1 and exitShort and not slExit
sl           = condition[1] !=  0 and slExit

// ---------   Colors
c_green      = #006400  //Green
c_greenLight = #388e3c  //Green Light
c_red        = #8B0000  //Red
c_redLight   = #b71c1c  //Red Light
c_emas       = xl                             ? color.new(color.orange, 99) :
               xs                             ? color.new(color.orange, 99) :
               trendDir ==  1 and maDir ==  1 ? color.new(c_green,      99) :
               trendDir == -1 and maDir == -1 ? color.new(c_red,        99) :
               color.new(color.orange, 99)
c_maFill     = xl                             ? color.new(color.orange, 70) :
               xs                             ? color.new(color.orange, 70) :
               trendDir ==  1 and maDir ==  1 ? color.new(c_green,      70) :
               trendDir == -1 and maDir == -1 ? color.new(c_red,        70) :
               color.new(color.orange, 70)
c_maTrend    = trendDir ==  0                           ? color.new(color.orange,  0) :
               trendDir ==  1 and maTrend[1]  < maTrend ? color.new(c_green,       0) :
               trendDir ==  1 and maTrend[1] >= maTrend ? color.new(c_greenLight,  0) :
               trendDir == -1 and maTrend[1]  < maTrend ? color.new(c_redLight,    0) :
               trendDir == -1 and maTrend[1] >= maTrend ? color.new(c_red,         0) : na
c_ch         = trendDir ==  0                           ? color.new(color.orange, 50) :
               trendDir ==  1                           ? color.new(c_green,      50) :
               trendDir == -1                           ? color.new(c_red,        50) : na
c_slLineUp   = ta.rising (slLine, 1)
c_slLineDn   = ta.falling(slLine, 1)
c_slLine     = c_slLineUp ? na :
               c_slLineDn ? na : color.red
c_barCol     = trendDir ==  0                   ? color.new(color.orange,  0) :
               trendDir ==  1 and open <= close ? color.new(c_green,       0) :
               trendDir ==  1 and open  > close ? color.new(c_greenLight,  0) :
               trendDir == -1 and open >= close ? color.new(c_red,         0) :
               trendDir == -1 and open  < close ? color.new(c_redLight,    0) :
               color.new(color.orange, 0)

// ---------   Plots
p_maFast1    = plot(
  maFast1,
  title      = 'EMA Fast 1',
  color      = c_emas,
  linewidth  = 1)
p_maFast2    = plot(
  maFast2,
  title      = 'EMA Fast 2',
  color      = c_emas,
  linewidth  = 2)
fill(
  p_maFast1, p_maFast2,
  title      = 'EMAs Fill',
  color      = c_maFill)
plot(
  maTrend,
  title      = 'SMA Trend',
  color      = c_maTrend,
  linewidth  = 3)
p_chTop      = plot(
  i_channelOn   ? rangeTop : na,
  title      = 'Top Channel',
  color      = c_maTrend,
  linewidth  = 1)
p_chBot      = plot(
  i_channelOn   ? rangeBot : na,
  title      = 'Bottom Channel',
  color      = c_maTrend,
  linewidth  = 1)
fill(
  p_chTop, p_chBot,
  title      = 'Channel',
  color      = c_ch)
plot(
  i_slOn and condition != 0 ? slLine : na,
  title      = 'Stop Loss Line',
  color      = c_slLine,
  linewidth  = 1,
  style      = plot.style_linebr)

// ---------   Alerts
barcolor(i_barColOn ? c_barCol : na)

plotshape(
  i_alertOn and long ? high : na,
  title      = 'Long Label',
  text       = 'Long',
  textcolor  = color.white,
  color      = color.new(c_green, 0),
  style      = shape.labelup,
  size       = size.normal,
  location   = location.belowbar)
plotshape(
  i_alertOn and short ? low : na,
  title      = 'Short Label',
  text       = 'Short',
  textcolor  = color.white,
  color      = color.new(c_red, 0),
  style      = shape.labeldown,
  size       = size.normal,
  location   = location.abovebar)
plotshape(
  i_alertOn and (xl or xs) ? close : na,
  title      = 'Close Label',
  text       = 'Close',
  textcolor  = color.orange,
  color      = color.new(color.orange, 0),
  style      = shape.xcross,
  size       = size.small,
  location   = location.absolute)
plotshape(
  i_alertOn and sl ? slLine : na,
  title      = 'Stop Loss',
  text       = 'Stop\nLoss',
  textcolor  = color.orange,
  color      = color.new(color.orange, 0),
  style      = shape.xcross,
  size       = size.small,
  location   = location.absolute)
plotshape(
  i_alertOn and i_goldenOn and GCross ? maTrend : na,
  title      = 'Golden Cross Label',
  text       = 'Golden\nCross',
  textcolor  = color.white,
  color      = color.new(color.orange, 0),
  style      = shape.labelup,
  size       = size.normal,
  location   = location.absolute)
plotshape(
  i_alertOn and i_goldenOn and DCross ? maTrend : na,
  title      = 'Death Cross Label',
  text       = 'Death\nCross',
  textcolor  = color.white,
  color      = color.new(color.orange, 0),
  style      = shape.labeldown,
  size       = size.normal,
  location   = location.absolute)

bgcolor(
  i_periodSw and not period ? color.new(color.gray, 90) : na,
  title      = 'Session')

// ---------   Backtest
if long  and strategy.position_size == 0 and barstate.isconfirmed
    strategy.entry('Long',  strategy.long,  comment = 'long')
if short and strategy.position_size == 0 and barstate.isconfirmed
    strategy.entry('Short', strategy.short, comment = 'short')
strategy.exit(
  id         = 'XL',
  from_entry = 'Long',
  stop       = i_slOn ? slLine : na)
strategy.exit(
  id         = 'XS',
  from_entry = 'Short',
  stop       = i_slOn ? slLine : na)
strategy.close(
  'Long',
  comment    = 'Close',
  when       = xl)
strategy.close(
  'Short',
  comment    = 'Close',
when = xs)Published by ChaoZhang on the FMZ strategy square · last modified 2023-12-20. Collected in the Quant Trading Vault. Unvalidated research: re-test with your own data and costs before trusting it.
Build this with AgenKit
A spec is not a trading system. Paste this into your coding agent and AgenKit runs a specialist team — architecture, test-first build, risk gates, review — with paper trading on by default.
/agenkit build a production-grade trading bot with a backtest engine, risk controls and paper trading by default from strategies/Dual-Indicator-Hybrid-Quantitative-Trading-Strategy.md- npx agenkit install engineering-kit in your project
- Paste the command into your agent and approve each phase
- Get tests, backtest, risk controls and a paper-trading switch
Understand it first
Before you run this, read the lesson behind the idea and how to backtest it honestly. Specs like this one are the survivors of an unknown number of trials; deflate their results accordingly.
Related specs
- Advanced Momentum EMA Trend Following with RSI Overbought Oversold Trading StrategyPine Script · Mean reversion · 1d
- Advanced Quantitative Trend Following and Cloud Reversal Composite Trading StrategyPine Script · Mean reversion · 1d
- Bidirectional Moving Average Reversion Trading StrategyPine Script · Mean reversion · 1h
- Comprehensive Strategy of Multiple Candlestick PatternsPine Script · Mean reversion · 1h
- Customizable Non Repainting HTF MACD MFI Scalable Bot StrategyPine Script · Mean reversion · 1d
- Dynamic Adaptive Multi Timeframe Trend Following and Range Reversal Hybrid StrategyPine Script · Mean reversion · 2d