Strategy vault / Machine learning
Dual Indicator Quantitative Strategy
This strategy generates trading signals by combining the 123 Reversal indicator and the RAVI indicator. The 123 Reversal belongs to the reversal type strategy, using the price movement in the last two days to…
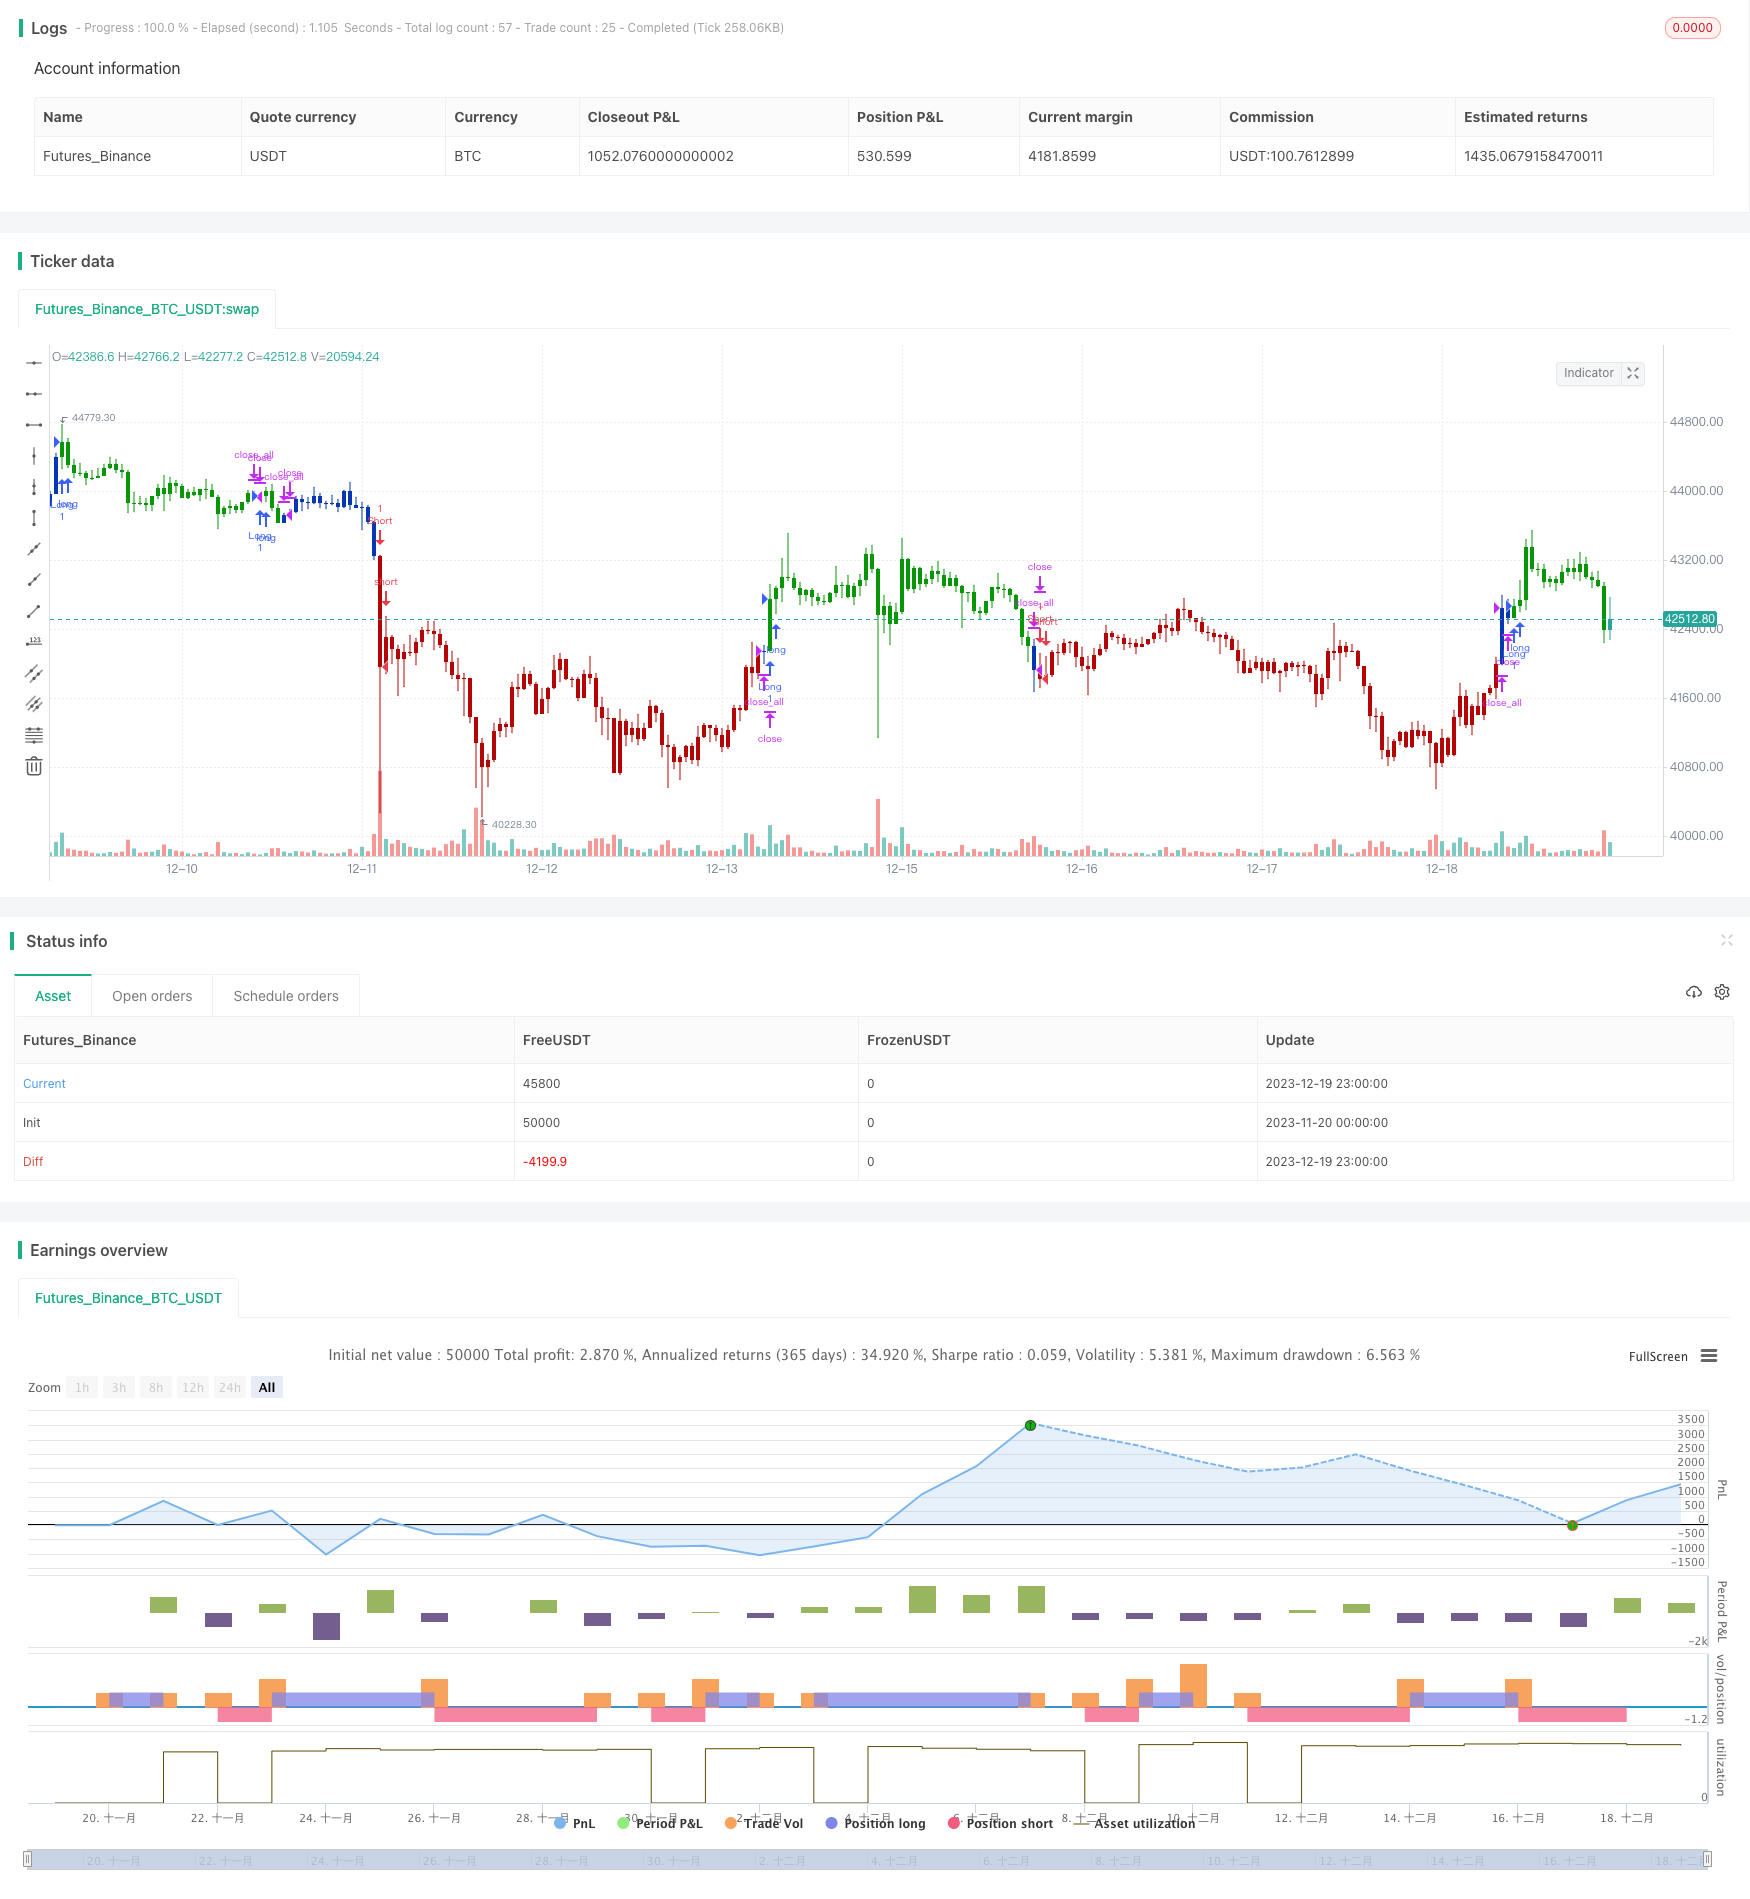
Overview
This strategy generates trading signals by combining the 123 Reversal indicator and the RAVI indicator. The 123 Reversal belongs to the reversal type strategy, using the price movement in the last two days to determine future price trends. The RAVI indicator determines whether the price has entered the overbought or oversold zone. The strategy decides to go long or short based on the combined signals from both indicators.
Strategy Logic
123 Reversal
This indicator is based on the K value of the Stochastic indicator. Specifically, it goes long when the close price today is lower than the previous two days and the 9-day slow stochastic line is lower than 50. It goes short when the close price today is higher than the previous two days and the 9-day fast stochastic line is higher than 50. So it enters based on reversal points confirmation.
RAVI Indicator
This indicator generates signals by calculating the difference between fast and slow moving averages. Specifically, the difference between 7-day MA and 65-day MA. It goes long when the difference is greater than a threshold and goes short when lower than a threshold. So overbought and oversold areas can be identified when fast and slow MAs crossover.
Strategy Signals
A signal is generated when 123 Reversal and RAVI agree on the direction. The long signal is triggered when both indicators show 1 and the short signal is triggered when both show -1. This dual confirmation avoids wrong signals from a single indicator.
Pros Analysis
- Combining two indicators improves signal accuracy and avoids false signals
- 123 Reversal uses price data and RAVI uses moving average data to determine trends from multiple perspectives
- The parameters of RAVI are adjustable and can be optimized for different products and market environments
- The combination of reversal and trend allows catching both reversals and trends
Risks and Optimization
- Dual indicators combination can sometimes lead to conflicting signals. A price deviation parameter can be introduced to trigger signals when the price deviation between the two indicators is within a threshold
- 123 Reversal is a high frequency strategy. It should be combined with other low frequency strategies to lower trading frequency
- RAVI is good at catching medium to long term trends. Combining with short-term indicators can enhance risk management
Conclusion
The strategy considers both reversal and trend factors. Dual confirmation helps avoid false signals. Next steps could be introducing machine learning algorithms for adaptive parameter optimization. Or combining this strategy with other strategy types to achieve portfolio diversification while maintaining profits and reducing maximum drawdowns.
Parameters
| Name | Default | What it controls |
|---|---|---|
| v_input_1 | true | ---- 123 Reversal ---- |
| v_input_2 | 14 | Length |
| v_input_3 | true | KSmoothing |
| v_input_4 | 3 | DLength |
| v_input_5 | 50 | Level |
| v_input_6 | true | ---- Range Action Verification Index (RAVI) ---- |
| v_input_7 | 7 | Length MA Fast |
| v_input_8 | 65 | Length MA Slow |
| v_input_9 | 0.14 | TradeLine |
| v_input_10 | false | Trade reverse |
Source Pine Script
/*backtest
start: 2023-11-20 00:00:00
end: 2023-12-20 00:00:00
period: 1h
basePeriod: 15m
exchanges: [{"eid":"Futures_Binance","currency":"BTC_USDT"}]
*/

//@version=4
////////////////////////////////////////////////////////////
//  Copyright by HPotter v1.0 31/05/2021
// This is combo strategies for get a cumulative signal.
//
// First strategy
// This System was created from the Book "How I Tripled My Money In The
// Futures Market" by Ulf Jensen, Page 183. This is reverse type of strategies.
// The strategy buys at market, if close price is higher than the previous close
// during 2 days and the meaning of 9-days Stochastic Slow Oscillator is lower than 50.
// The strategy sells at market, if close price is lower than the previous close price
// during 2 days and the meaning of 9-days Stochastic Fast Oscillator is higher than 50.
//
// Second strategy
// The indicator represents the relative convergence/divergence of the moving
// averages of the financial asset, increased a hundred times. It is based on
// a different principle than the ADX. Chande suggests a 13-week SMA as the
// basis for the indicator. It represents the quarterly (3 months = 65 working days)
// sentiments of the market participants concerning prices. The short moving average
// comprises 10% of the one and is rounded to seven.
//
// WARNING:
// - For purpose educate only
// - This script to change bars colors.
////////////////////////////////////////////////////////////
Reversal123(Length, KSmoothing, DLength, Level) =>
    vFast = sma(stoch(close, high, low, Length), KSmoothing)
    vSlow = sma(vFast, DLength)
    pos = 0.0
    pos := iff(close[2] < close[1] and close > close[1] and vFast < vSlow and vFast > Level, 1,
	         iff(close[2] > close[1] and close < close[1] and vFast > vSlow and vFast < Level, -1, nz(pos[1], 0)))
	pos


RAVI(LengthMAFast, LengthMASlow, TradeLine) =>
    pos = 0.0
    xMAF = sma(close, LengthMAFast)
    xMAS = sma(close, LengthMASlow)
    xRAVI = ((xMAF - xMAS) / xMAS) * 100
    pos:= iff(xRAVI > TradeLine, 1,
    	   iff(xRAVI < TradeLine, -1, nz(pos[1], 0)))
    pos

strategy(title="Combo Backtest 123 Reversal & Range Action Verification Index (RAVI)", shorttitle="Combo", overlay = true)
line1 = input(true, "---- 123 Reversal ----")
Length = input(14, minval=1)
KSmoothing = input(1, minval=1)
DLength = input(3, minval=1)
Level = input(50, minval=1)
//-------------------------
line2 = input(true, "---- Range Action Verification Index (RAVI) ----")
LengthMAFast = input(title="Length MA Fast", defval=7)
LengthMASlow = input(title="Length MA Slow", defval=65)
TradeLine = input(0.14, step=0.01)
reverse = input(false, title="Trade reverse")
posReversal123 = Reversal123(Length, KSmoothing, DLength, Level)
posRAVI = RAVI(LengthMAFast, LengthMASlow, TradeLine)
pos = iff(posReversal123 == 1 and posRAVI == 1 , 1,
	   iff(posReversal123 == -1 and posRAVI == -1, -1, 0))
possig = iff(reverse and pos == 1, -1,
          iff(reverse and pos == -1 , 1, pos))
if (possig == 1 )
    strategy.entry("Long", strategy.long)
if (possig == -1 )
    strategy.entry("Short", strategy.short)
if (possig == 0)
    strategy.close_all()
barcolor(possig == -1 ? #b50404: possig == 1 ? #079605 : #0536b3 )Published by ChaoZhang on the FMZ strategy square · last modified 2023-12-21. Collected in the Quant Trading Vault. Unvalidated research: re-test with your own data and costs before trusting it.
Build this with AgenKit
A spec is not a trading system. Paste this into your coding agent and AgenKit runs a specialist team — architecture, test-first build, risk gates, review — with paper trading on by default.
/agenkit build a production-grade trading bot with a backtest engine, risk controls and paper trading by default from strategies/Dual-Indicator-Quantitative-Strategy.md- npx agenkit install engineering-kit in your project
- Paste the command into your agent and approve each phase
- Get tests, backtest, risk controls and a paper-trading switch
Understand it first
Before you run this, read the lesson behind the idea and how to backtest it honestly. Specs like this one are the survivors of an unknown number of trials; deflate their results accordingly.
Related specs
- Triple Moving Average Combined with MACD Quantitative StrategyPine Script · Machine learning · 1d
- ADX EFI 50 Moving Average Channel Pullback StrategyPine Script · Machine learning · 1h
- Multi indicator Combination StrategyPine Script · Machine learning · 1d
- High Frequency Hybrid Technical Analysis Quantitative StrategyPine Script · Machine learning · 15m
- KRK aDa Stochastic Slow Mean Reversion Strategy with AI Enhancements KRK aDaPine Script · Machine learning · 1h
- Pure Stochastic Long Only StrategyPine Script · Machine learning · 5m