Strategy vault / Machine learning
Dual Indicator Stochastic RSI and EMA Trading Strategy
This strategy combines the Stochastic RSI and two EMAs with different periods to generate trading signals. Buy signals are generated when the StochRSI is below 20 and the 55-period EMA is above the 200-period EMA…
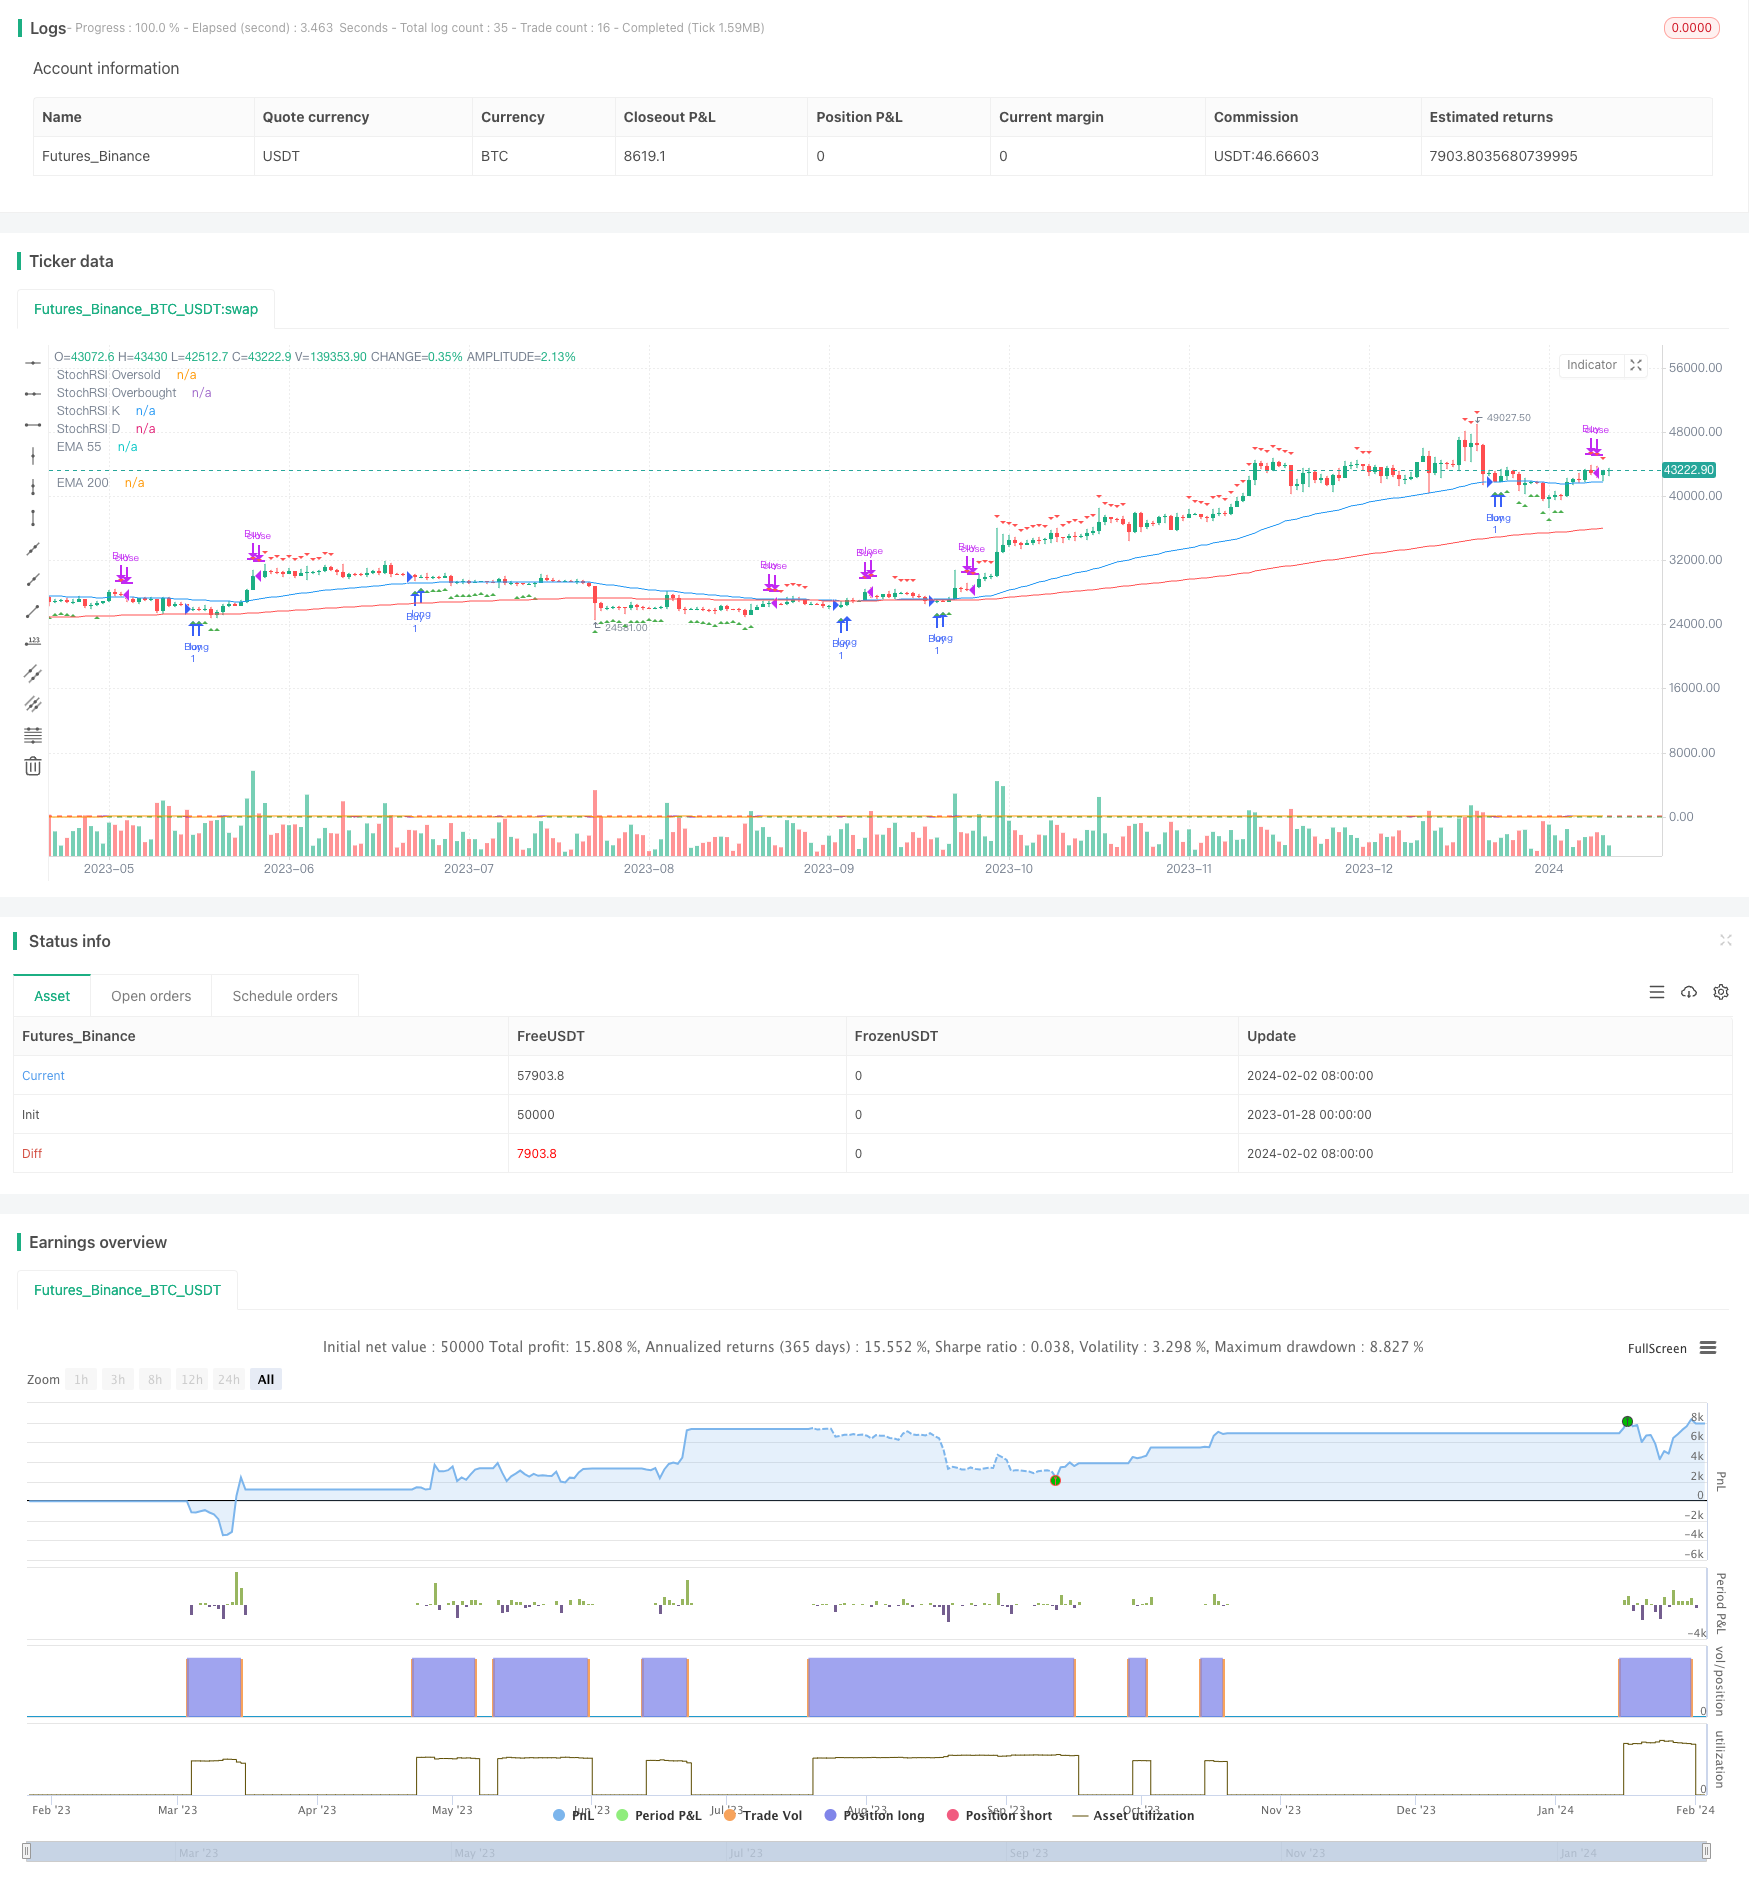
Overview
This strategy combines the Stochastic RSI and two EMAs with different periods to generate trading signals. Buy signals are generated when the StochRSI is below 20 and the 55-period EMA is above the 200-period EMA. Sell signals are generated when the StochRSI crosses above 80. This strategy leverages the strengths of different indicators, considering both price momentum and trend direction, forming a relatively stable trading strategy.
Strategy Logic
The core of this strategy consists of the Stochastic RSI and two EMAs. The Stochastic RSI is a stochastic oscillator style RSI indicator, which combines the strengths of RSI and Stochastic Oscillator for clearer overbought/oversold observation. The two EMAs reflect the medium-term and long-term price trend directions respectively.
When StochRSI drops below 20, it indicates the market is in an oversold status. Together with the 55-period EMA being above the 200-period EMA, it signals an uptrend, which presents a good risk-reward buying opportunity. When StochRSI breaks above 80, the market enters the overbought zone and profit taking or stop loss should be considered.
Strength Analysis
The biggest advantage of this strategy is the complementarity between indicators. While StochRSI judges momentum and overbought/oversold levels, the EMAs determine the major trend. Once signals align, confident market entrance can be made. Compared to using StochRSI alone, this combo strategy filters out more false signals and hence results in greater stability.
In addition, this is a simple strategy to operate, only requiring observation of three indicators for decision making. It suits investors who care more about long-term trends than short-term fluctuations.
Risk Analysis
There are some risks associated with this strategy. Firstly, trend reversal can happen to the EMAs, turning StochRSI buy signals into bull traps. Secondly, prolonged market consolidation may lead to poor long position performance. Lastly, inappropriate parameter settings can also impact strategy efficacy.
To mitigate, stop loss should be implemented to limit single trade loss. Meanwhile, tuning parameters like adopting longer EMA periods is also an option. Generally speaking, the risks are still controllable for this strategy.
Optimization Directions
There are several optimization directions:
Adding other indicators as filters, like RSI or ATR to avoid false breakouts
Introducing machine learning algorithms and adaptive parameter optimization
Incorporating sentiment indicators, news and more factors to determine market timing
Applying position sizing to further lower risks, e.g. fixed fractional position sizing
These efforts can significantly improve the stability and profitability of the strategy.
Conclusion
This strategy leverages both stochastic RSI and EMAs to account for overbought/oversold levels and main trend directions. By strictly defining entry and exit mechanisms, market noise can be effectively filtered for steady strategy returns. Moving forward, through parameter tuning, model expanding, risk control etc., this strategy can become a viable quantitative trading choice.
Parameters
| Name | Default | What it controls |
|---|---|---|
| v_input_1 | 14 | StochRSI Length |
| v_input_2 | 3 | K Period |
| v_input_3 | 3 | D Period |
| v_input_4 | 55 | EMA 55 Period |
| v_input_5 | 200 | EMA 200 Period |
Source Pine Script
/*backtest
start: 2023-01-28 00:00:00
end: 2024-02-03 00:00:00
period: 1d
basePeriod: 1h
exchanges: [{"eid":"Futures_Binance","currency":"BTC_USDT"}]
*/

//@version=4
strategy("Stochastic RSI and EMA Strategy", shorttitle="StochRSI & EMA", overlay=true)

// Input for Stochastic RSI settings
stoch_length = input(14, title="StochRSI Length")
k_period = input(3, title="K Period")
d_period = input(3, title="D Period")

// Input for EMA periods
ema1_period = input(55, title="EMA 55 Period")
ema2_period = input(200, title="EMA 200 Period")

// Calculate Stochastic RSI
stoch_rsi_k = sma(stoch(close, close, close, stoch_length), k_period)
stoch_rsi_d = sma(stoch_rsi_k, d_period)

// Calculate EMAs
ema1 = ema(close, ema1_period)
ema2 = ema(close, ema2_period)

// Plot EMAs on the chart
plot(ema1, color=color.blue, title="EMA 55")
plot(ema2, color=color.red, title="EMA 200")

// Plot Stochastic RSI on a separate pane
hline(20, "StochRSI Oversold", color=color.green)
hline(80, "StochRSI Overbought", color=color.red)
plot(stoch_rsi_k, color=color.purple, title="StochRSI K")
plot(stoch_rsi_d, color=color.orange, title="StochRSI D")

// Buy condition: StochRSI below 20 and EMA55 above EMA200
buy_condition = stoch_rsi_k < 20 and ema1 > ema2

// Sell condition: StochRSI above 80
sell_condition = stoch_rsi_k > 80

// Plot buy and sell signals on the chart
plotshape(series=buy_condition, title="Buy Signal", location=location.belowbar, color=color.green, style=shape.triangleup, size=size.small)
plotshape(series=sell_condition, title="Sell Signal", location=location.abovebar, color=color.red, style=shape.triangledown, size=size.small)

// Strategy entry and exit
strategy.entry("Buy", strategy.long, when=buy_condition)
strategy.close("Buy", when=sell_condition)
Published by ChaoZhang on the FMZ strategy square · last modified 2024-02-04. Collected in the Quant Trading Vault. Unvalidated research: re-test with your own data and costs before trusting it.
Build this with AgenKit
A spec is not a trading system. Paste this into your coding agent and AgenKit runs a specialist team — architecture, test-first build, risk gates, review — with paper trading on by default.
/agenkit build a production-grade trading bot with a backtest engine, risk controls and paper trading by default from strategies/Dual-Indicator-Stochastic-RSI-and-EMA-Trading-Strategy.md- npx agenkit install engineering-kit in your project
- Paste the command into your agent and approve each phase
- Get tests, backtest, risk controls and a paper-trading switch
Understand it first
Before you run this, read the lesson behind the idea and how to backtest it honestly. Specs like this one are the survivors of an unknown number of trials; deflate their results accordingly.
Related specs
- ADX EFI 50 Moving Average Channel Pullback StrategyPine Script · Machine learning · 1h
- Multi indicator Combination StrategyPine Script · Machine learning · 1d
- AI Driven Dynamic Volatility Adaptive Trend Breakout Trading StrategyPine Script · Machine learning · 2d
- High Frequency Hybrid Technical Analysis Quantitative StrategyPine Script · Machine learning · 15m
- Multi Indicator Dynamic Adaptive Quantitative Trading StrategyPine Script · Machine learning · 1h
- Triple Moving Average Combined with MACD Quantitative StrategyPine Script · Machine learning · 1d