Strategy vault / Trend following
Dual Moving Average Crossover and Bull Bear Power Balance Combination Strategy
This strategy first uses the dual moving average lines of 2-period and 20-period EMA to determine if price breaks through the moving averages, as a basic criterion for entering the market. At the same time, the…
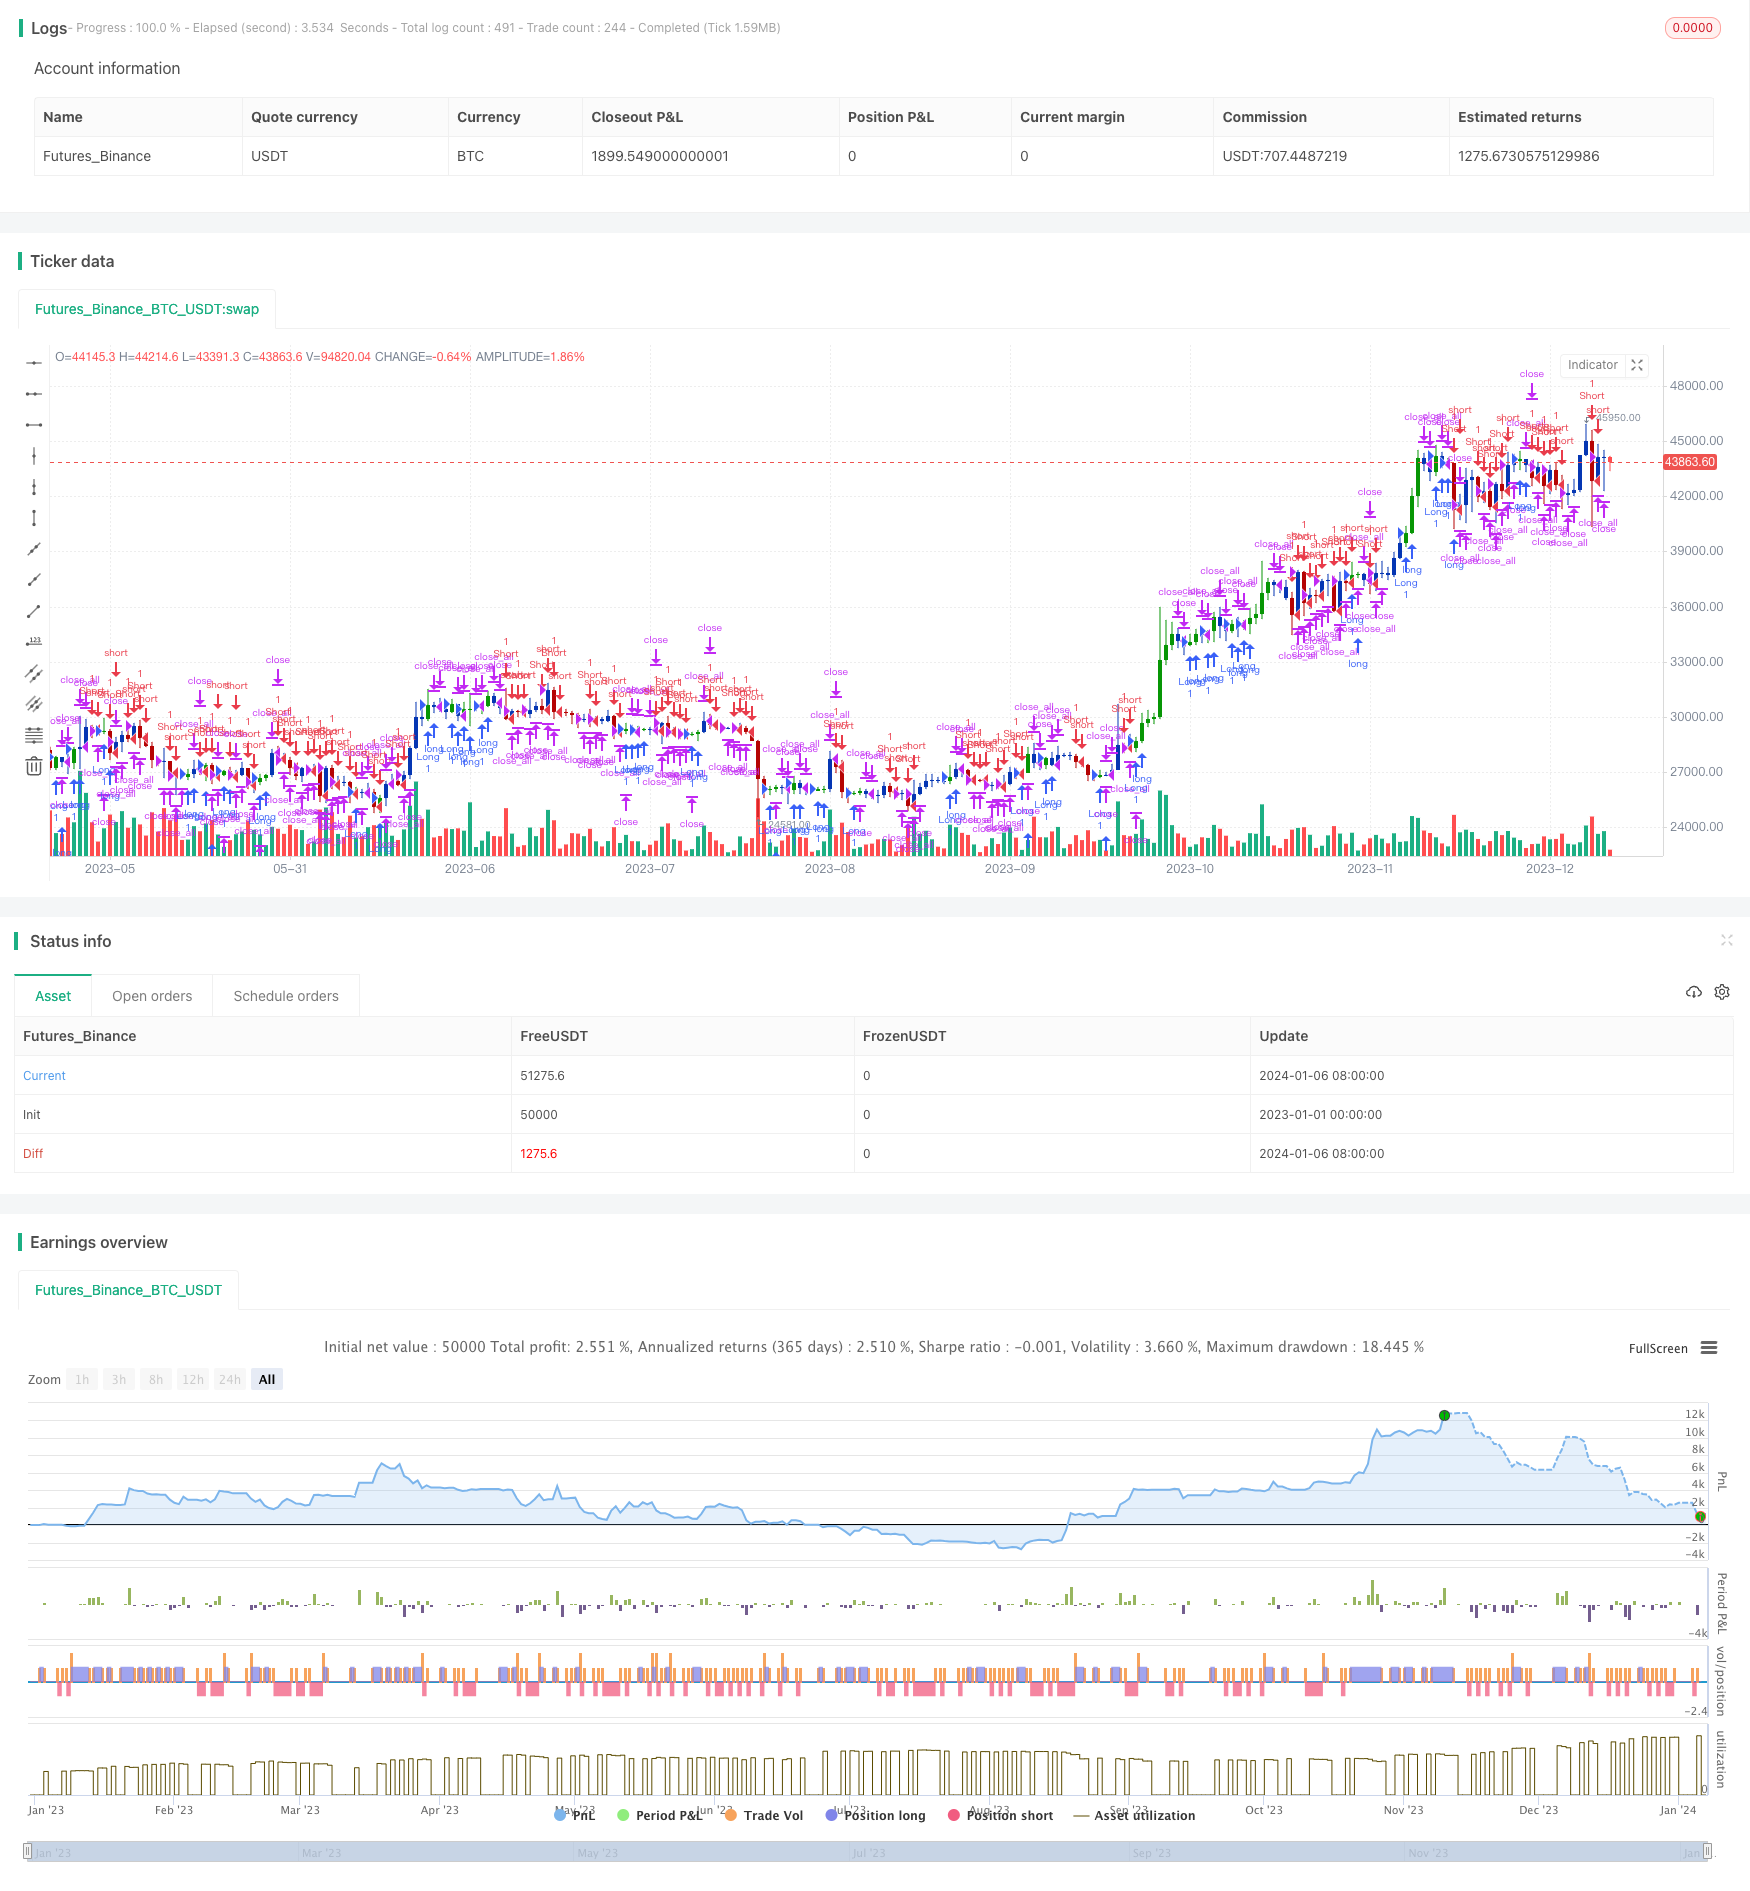
Overview
This strategy first uses the dual moving average lines of 2-period and 20-period EMA to determine if price breaks through the moving averages, as a basic criterion for entering the market. At the same time, the auxiliary indicator "Bull Bear Power Balance Indicator" further identifies the relative power between bulls and bears to avoid mis-operations. The two types of indicators jointly generate the final trading signal.
Strategy Principle
Dual Moving Average Indicator
- Calculate 2-period and 20-period Exponential Moving Average (EMA)
- Generate trading signals when closing price breaks through from one side of the moving averages to the other
- Breaking through 20-EMA determines the trend direction
- Breaking through 2-EMA determines specific entry point
Bull Bear Power Balance Indicator
- Separately calculate bull power value and bear power value
- Compare the two values to determine relative strength between bulls and bears
- The stronger direction serves as an auxiliary judgment for entry
Combined judgment of the two indicators
- Dual moving average indicator judges major trend direction
- Bull bear power balance indicator makes local regional judgment
- Issue trading signals when both indicators give consistent judgment
Advantage Analysis
The biggest advantage of this combination strategy is to integrate indicators of different varieties to achieve more reliable trading judgment. Specifically, it has the following advantages:
- Using dual moving average to determine major direction, avoid being deceived by local fluctuations
- Use the bull bear power balance indicator for local regional judgment to accurately grasp specific entry point
- Two types of indicators verify each other and can filter out some mis-operations to reduce trading risks
- Flexible parameter settings that can be optimized for different market varieties
- The strategy idea is simple and clear, easy to understand, and easy to optimize later
Risk Analysis
Some risks of this strategy need to be noted:
- The lag of indicator signals may lead to over deep stop loss points
- Dual moving average indicator is sensitive to parameter settings
- Bull bear balance indicator has slightly lower accuracy in judging short-term trends
- Judgment deviation may occur for both indicators under special market conditions (common false breakout signals)
Countermeasures:
- Appropriately shorten holding period or set appropriate moving stop loss
- Test different parameter combinations to find optimal parameters
- Refer to other indicators for confirmation
- Optimize parameters based on characteristics of different varieties
Optimization Directions
The strategy can be further optimized in the following aspects:
- Test more moving average indicator parameter combinations
- Increase stop loss strategies to control single stop loss
- Incorporate volatility indicators to improve parameter self-adaptability
- Add machine learning models to achieve dynamic parameter optimization
- Try different trend-following indicators to replace bull bear power balance
- Develop visual interfaces for easy user testing of different parameters
Conclusion
This strategy judges the major trend through dual moving average indicator and uses bull bear power balance indicator to assist in determining entry timing. The two indicators verify each other and can effectively reduce the probability of mis-operations. The strategy parameters are flexible and can be optimized for different varieties. Overall, the strategy is simple and practical, worth learning and using by most investors. Subsequent optimizations can further improve strategy performance.
Parameters
| Name | Default | What it controls |
|---|---|---|
| v_input_int_1 | 14 | (?●═════ 2/20 EMA ═════●)Length |
| v_input_float_1 | -15 | (?●═════ Bull And Bear Balance ═════●)SellLevel |
| v_input_float_2 | 15 | BuyLevel |
| v_input_bool_1 | false | (?●═════ MISC ═════●)Trade reverse |
| v_input_int_2 | true | (?●═════ Time Start ═════●)From Day |
| v_input_int_3 | true | From Month |
| v_input_int_4 | 2005 | From Year |
Source Pine Script
/*backtest
start: 2023-01-01 00:00:00
end: 2024-01-07 00:00:00
period: 1d
basePeriod: 1h
exchanges: [{"eid":"Futures_Binance","currency":"BTC_USDT"}]
*/

//@version=5
////////////////////////////////////////////////////////////
//  Copyright by HPotter v1.0 23/05/2022
// This is combo strategies for get a cumulative signal.
//
// First strategy
// This indicator plots 2/20 exponential moving average. For the Mov
// Avg X 2/20 Indicator, the EMA bar will be painted when the Alert criteria is met.
//
// Second strategy
//    This new indicator analyzes the balance between bullish and
//    bearish sentiment.
//    One can cay that it is an improved analogue of Elder Ray indicator.
//    To get more information please see "Bull And Bear Balance Indicator"
//    by Vadim Gimelfarb.
//
// WARNING:
// - For purpose educate only
// - This script to change bars colors.
////////////////////////////////////////////////////////////
EMA20(Length) =>
    pos = 0.0
    xPrice = close
    xXA = ta.ema(xPrice, Length)
    nHH = math.max(high, high[1])
    nLL = math.min(low, low[1])
    nXS = nLL > xXA or nHH < xXA ? nLL : nHH
    iff_1 = nXS < close[1] ? 1 : nz(pos[1], 0)
    pos := nXS > close[1] ? -1 : iff_1
    pos


BBB(SellLevel,BuyLevel) =>
    pos = 0.0
    value = close < open ?
              close[1] > open ?  math.max(close - open, high - low) : high - low :
                 close > open ?
                  close[1] > open ? math.max(close[1] - low, high - close) : math.max(open - low, high - close) :
                   high - close > close - low ?
                     close[1] > open ? math.max(close[1] - open, high - low) :high - low :
                      high - close < close - low ?
                         close > open ? math.max(close - low, high - close) : open - low :
                           close > open ? math.max(close[1] - open , high - close) :
                             close[1] < open ? math.max(open - low, high - close) : high - low

    value2 =close < open ?
              close[1] < open ?  math.max(high - close[1], close - low) : math.max(high - open, close - low) :
               close > open ?
                 close[1] > open ?  high - low : math.max(open - close[1], high - low) :
                  high - close > close - low ?
                   close[1] < open ? math.max(high - close[1], close - low) : high - open :
                     high - close < close - low ?
                      close[1] > open ?  high - low : math.max(open - close, high - low) :
                       close[1] > open ? math.max(high - open, close - low) :
                         close[1] < open? math.max(open - close, high - low): high - low
    nBBB = value2 - value
    pos :=  nBBB < SellLevel ? -1 :
    	     nBBB >= BuyLevel ? 1 : nz(pos[1], 0)
    pos

strategy(title='Combo 2/20 EMA & Bull And Bear Balance', shorttitle='Combo', overlay=true)
var I1 = '●═════ 2/20 EMA ═════●'
Length = input.int(14, minval=1, group=I1)
var I2 = '●═════  Bull And Bear Balance ═════●'
SellLevel = input.float(-15, step=0.01, group=I2)
BuyLevel = input.float(15, step=0.01, group=I2)
var misc = '●═════ MISC ═════●'
reverse = input.bool(false, title='Trade reverse', group=misc)
var timePeriodHeader = '●═════ Time Start ═════●'
d = input.int(1, title='From Day', minval=1, maxval=31, group=timePeriodHeader)
m = input.int(1, title='From Month', minval=1, maxval=12, group=timePeriodHeader)
y = input.int(2005, title='From Year', minval=0, group=timePeriodHeader)
StartTrade = time > timestamp(y, m, d, 00, 00) ? true : false
posEMA20 = EMA20(Length)
prePosBBB = BBB(SellLevel,BuyLevel)
iff_1 = posEMA20 == -1 and prePosBBB == -1 and StartTrade ? -1 : 0
pos = posEMA20 == 1 and prePosBBB == 1 and StartTrade ? 1 : iff_1
iff_2 = reverse and pos == -1 ? 1 : pos
possig = reverse and pos == 1 ? -1 : iff_2
if possig == 1
    strategy.entry('Long', strategy.long)
if possig == -1
    strategy.entry('Short', strategy.short)
if possig == 0
    strategy.close_all()
barcolor(possig == -1 ? #b50404 : possig == 1 ? #079605 : #0536b3)Published by ChaoZhang on the FMZ strategy square · last modified 2024-01-08. Collected in the Quant Trading Vault. Unvalidated research: re-test with your own data and costs before trusting it.
Build this with AgenKit
A spec is not a trading system. Paste this into your coding agent and AgenKit runs a specialist team — architecture, test-first build, risk gates, review — with paper trading on by default.
/agenkit build a production-grade trading bot with a backtest engine, risk controls and paper trading by default from strategies/Dual-Moving-Average-Crossover-and-Bull-Bear-Power-Balance-Combination-Strategy.md- npx agenkit install engineering-kit in your project
- Paste the command into your agent and approve each phase
- Get tests, backtest, risk controls and a paper-trading switch
Understand it first
Before you run this, read the lesson behind the idea and how to backtest it honestly. Specs like this one are the survivors of an unknown number of trials; deflate their results accordingly.
Related specs
- 200 EMA VWAP MFI Trend Following StrategyPine Script · Trend following · 1d
- 4 EMA Trend StrategyPine Script · Trend following · 1d
- ADX MA and EMA Long Only Trend Tracking StrategyPine Script · Trend following · 1d
- ATR Dynamic Trend Following and EMA Crossover Trading StrategyPine Script · Trend following · 1d
- ATR and Moving Average Crossover Hybrid StrategyPine Script · Trend following · 1h
- ATR and T3 Moving Average StrategyPine Script · Trend following · 5m