Strategy vault / Mean reversion
Dual Moving Average Crossover Reversal Strategy
The Dual Moving Average Crossover Reversal strategy is a typical quantitative trading strategy that tracks trends. The strategy utilizes the crossover signals from the 9-day line and 14-day line in the dual moving…
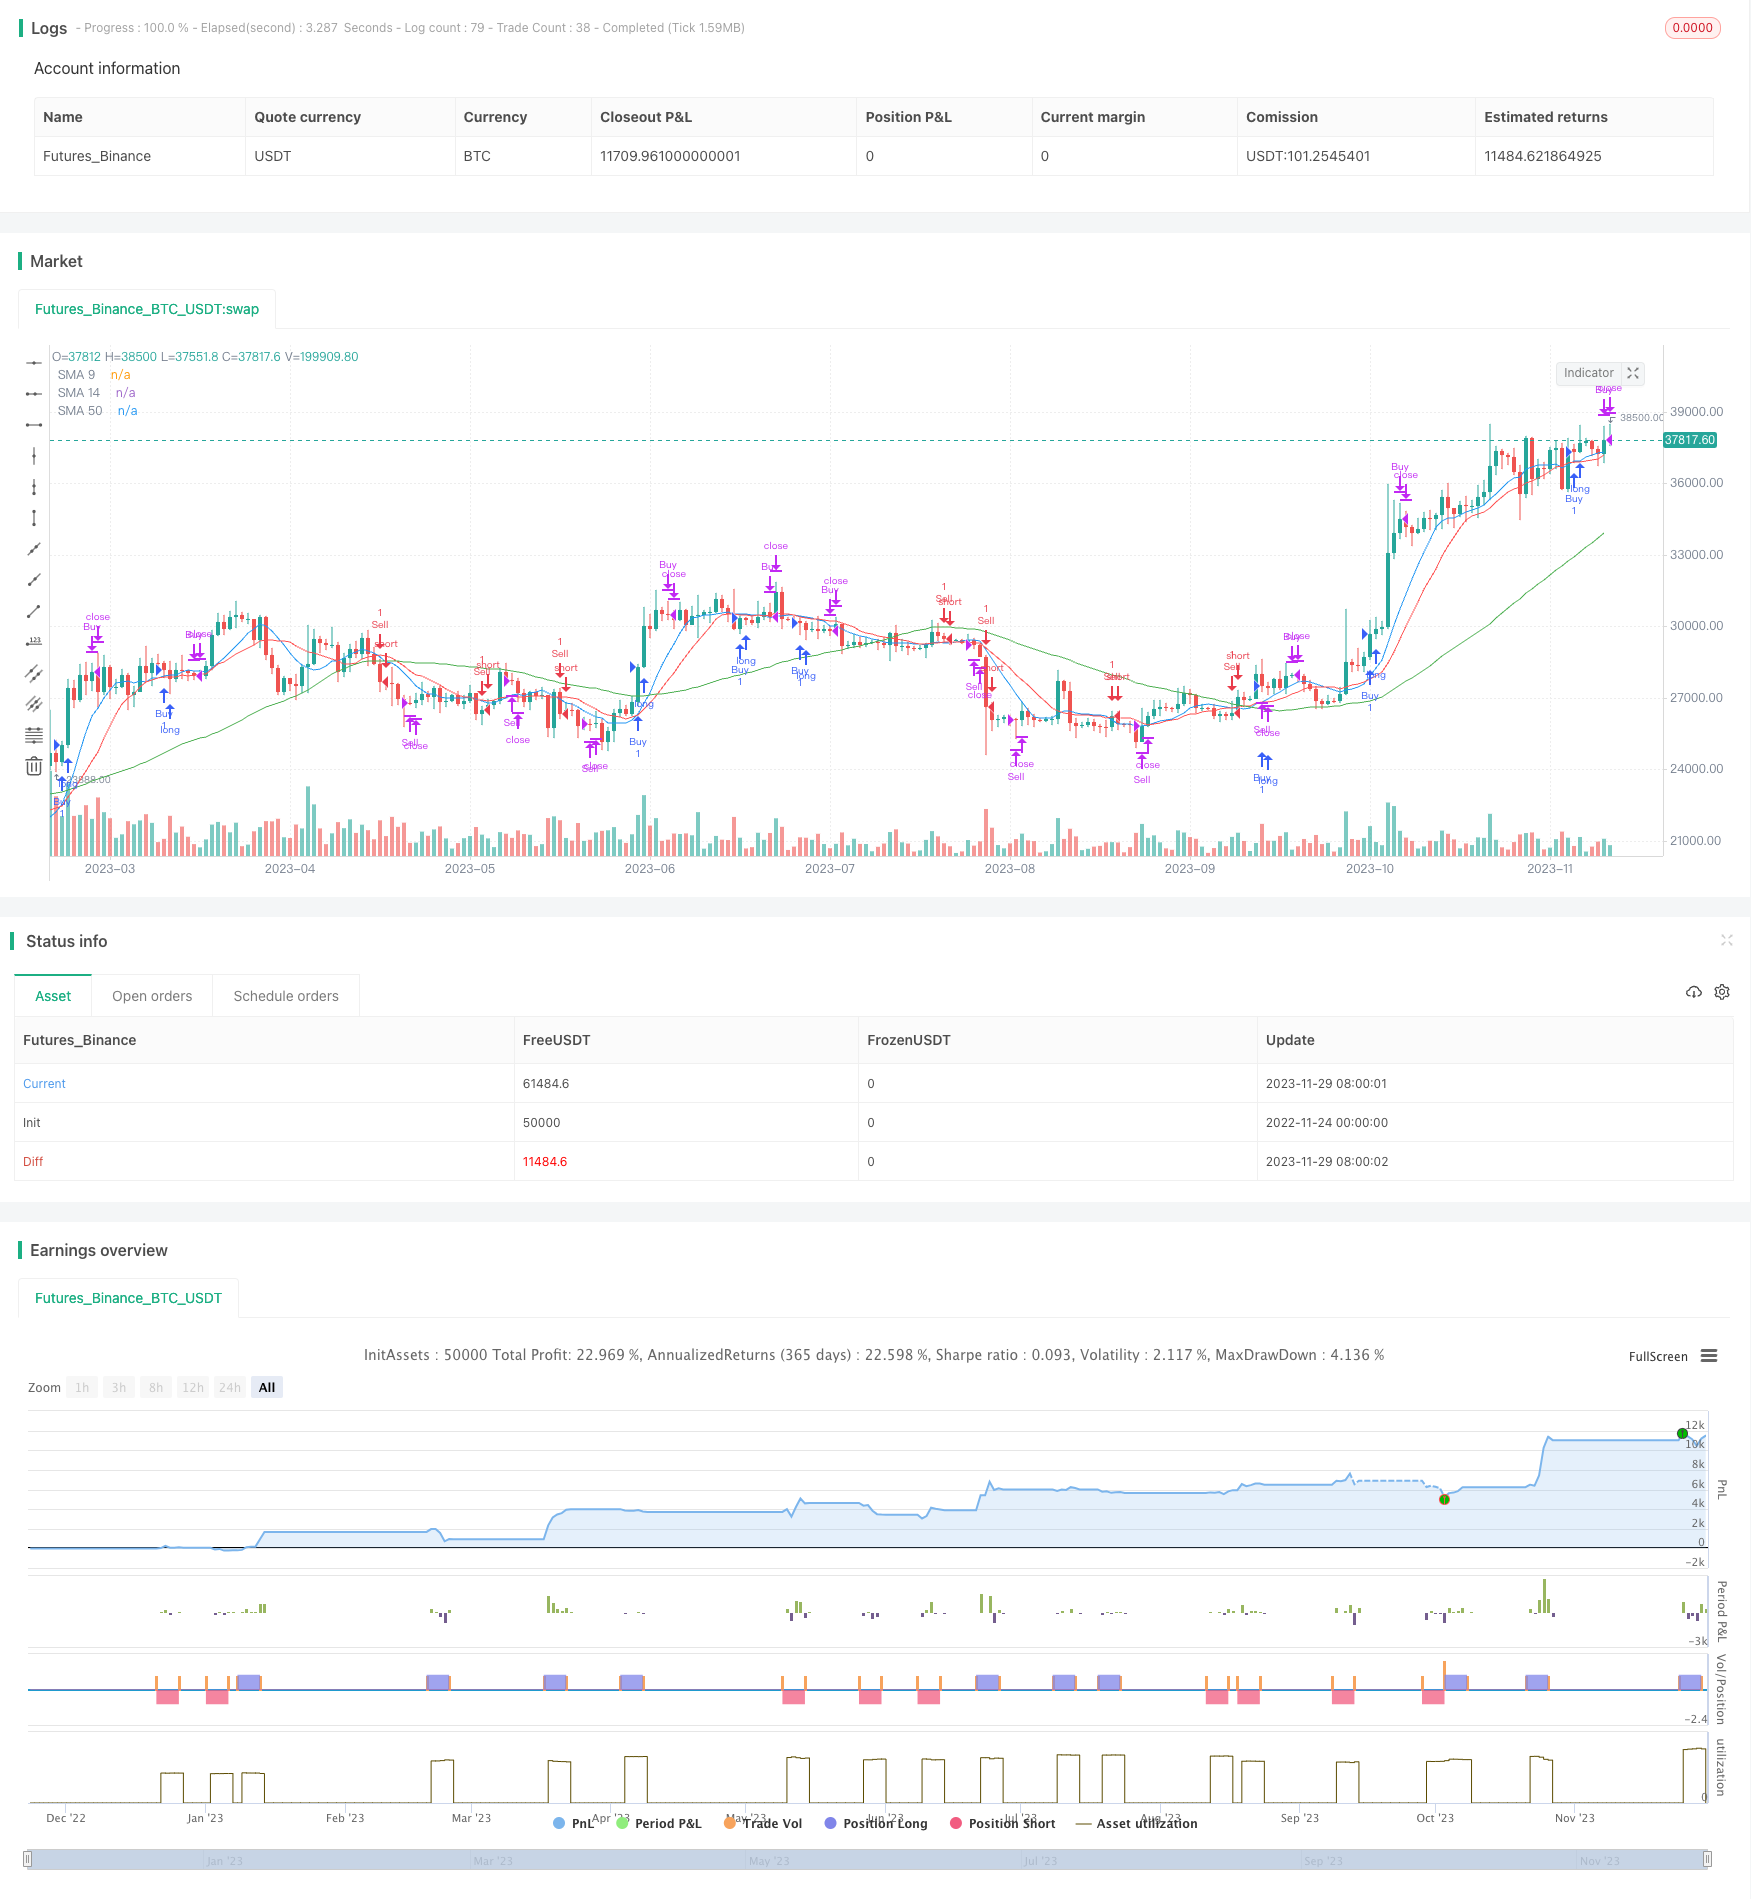
Overview
The Dual Moving Average Crossover Reversal strategy is a typical quantitative trading strategy that tracks trends. The strategy utilizes the crossover signals from the 9-day line and 14-day line in the dual moving average indicator to construct buy and sell signals. It buys when the 9-day line breaks through the 14-day line from below to form a golden cross, and sells when the 9-day line breaks through the 14-day line from above to form a death cross. To filter false signals, the strategy also introduces the 50-day line indicator to determine if the price breaks through.
Strategy Principle
This strategy mainly trades based on the golden cross and death cross signals from the dual moving average indicator. In the dual moving averages, the 9-day line represents short-term trends, the 14-day line represents medium-term trends, and their crossover is an effective technical indicator for judging turns in market trends. When the short-term trend line breaks through the medium-term trend line from below to form a golden cross, it indicates the short-term trend line is strengthening, which is a buy signal; when it breaks through from above to form a death cross, it indicates the short-term trend line is weakening, which is a sell signal.
In addition, the strategy also introduces the 50-day line to filter misleading signals. It only generates a buy when the price is above the 50-day line; and only generates a sell when the price is below the 50-day line. The 50-day line represents medium to long term trends. Only when medium to long term trends agree, short term operations are carried out.
The core logic is as follows:
// Buy condition: 9-day line crosses above 14-day line and close price is above 50-day line
buyCondition = ta.crossover(sma9, sma14) and close > sma50

// Sell condition: 9-day line crosses below 14-day line and close price is below 50-day line
sellCondition = ta.crossunder(sma9, sma14) and close < sma50
Advantage Analysis
The advantages of the dual moving average strategy are obvious:
- Simple to understand and implement, suitable for beginners to learn.
- Go with the trend, avoid being trapped in range-bound markets.
- Use medium to long term indicators to filter misleading signals and avoid being fooled by short-term market noise.
- Can track trending markets and profit efficiently for extended periods.
Risk Analysis
The dual moving average strategy also has some risks:
- In extreme market conditions such as market crashes, there can be large drawdowns before a death cross forms. The strategy will hold onto large losing positions until a death cross triggers stops.
- In ranging markets, golden crosses and death crosses alternate, repeatedly opening and stopping out positions. This generates increased transaction costs.
To address the risks, optimizations such as below can be made:
- Introduce other indicators to quickly cut losses in crashing market conditions.
- Add more opening filters to avoid alternating crosses in ranging markets.
Optimization Directions
The dual moving average strategy can be optimized in several aspects:
- Parameter optimization. Adjust moving average periods, optimize indicator parameters.
- Further filter opening signals. Incorporate more indicators to judge market conditions and avoid false signals.
- Introduce stop loss mechanisms. Employ moving stop loss, penetration stop loss and other stop methods.
- Combine with other trading strategies such as volume and volatility strategies.
- Appropriately employ leverage to improve operational efficiency.
Summary
The dual moving average strategy is generally an efficient profit-generating strategy. It can profit by following trends continuously. At the same time, it has certain risks and needs further improvement. By optimizing parameters, stop methods and strategy combinations, the effects of this strategy can be further enhanced.
Parameters
| Name | Default | What it controls |
|---|---|---|
| v_input_1 | 9 | SMA 9 Length |
| v_input_2 | 14 | SMA 14 Length |
| v_input_3 | 50 | SMA 50 Length |
Source Pine Script
/*backtest
start: 2022-11-24 00:00:00
end: 2023-11-30 00:00:00
period: 1d
basePeriod: 1h
exchanges: [{"eid":"Futures_Binance","currency":"BTC_USDT"}]
*/

//@version=5
strategy("smaCrossReverse", shorttitle="smaCrossReverse", overlay=true)

// Define the length for the SMAs
sma9Length = input(9, title="SMA 9 Length")
sma14Length = input(14, title="SMA 14 Length")
sma50Length = input(50, title="SMA 50 Length")  // Add input for SMA 50

// Calculate SMAs
sma9 = ta.sma(close, sma9Length)
sma14 = ta.sma(close, sma14Length)
sma50 = ta.sma(close, sma50Length)  // Calculate SMA 50

// Buy condition: SMA 9 crosses above SMA 14 and current price is above SMA 50
buyCondition = ta.crossover(sma9, sma14) and close > sma50

// Sell condition: SMA 9 crosses below SMA 14 and current price is below SMA 50
sellCondition = ta.crossunder(sma9, sma14) and close < sma50

// Track the time since position was opened
var float timeElapsed = na
if (buyCondition)
    timeElapsed := 0
else
    timeElapsed := na(timeElapsed[1]) ? timeElapsed[1] : timeElapsed[1] + 1

// Close the buy position after 5 minutes
if (timeElapsed >= 5)
    strategy.close("Buy")

// Track the time since position was opened
var float timeElapsedSell = na
if (sellCondition)
    timeElapsedSell := 0
else
    timeElapsedSell := na(timeElapsedSell[1]) ? timeElapsedSell[1] : timeElapsedSell[1] + 1

// Close the sell position after 5 minutes
if (timeElapsedSell >= 5)
    strategy.close("Sell")

// Plot the SMAs on the chart
plot(sma9, title="SMA 9", color=color.blue)
plot(sma14, title="SMA 14", color=color.red)
plot(sma50, title="SMA 50", color=color.green)  // Plot SMA 50 on the chart

// Strategy entry and exit conditions using if statements
if (buyCondition)
    strategy.entry("Buy", strategy.long)

if (sellCondition)
    strategy.entry("Sell", strategy.short)
Published by ChaoZhang on the FMZ strategy square · last modified 2023-12-01. Collected in the Quant Trading Vault. Unvalidated research: re-test with your own data and costs before trusting it.
Build this with AgenKit
A spec is not a trading system. Paste this into your coding agent and AgenKit runs a specialist team — architecture, test-first build, risk gates, review — with paper trading on by default.
/agenkit build a production-grade trading bot with a backtest engine, risk controls and paper trading by default from strategies/Dual-Moving-Average-Crossover-Reversal-Strategy.md- npx agenkit install engineering-kit in your project
- Paste the command into your agent and approve each phase
- Get tests, backtest, risk controls and a paper-trading switch
Understand it first
Before you run this, read the lesson behind the idea and how to backtest it honestly. Specs like this one are the survivors of an unknown number of trials; deflate their results accordingly.
Related specs
- 3 10 Oscillator Profile Flagging StrategyPine Script · Mean reversion · 1d
- A Trend Reversal Strategy Based on Moving Averages Price Patterns and VolumePine Script · Mean reversion · 1d
- Adaptive Mean Reversion Trading Strategy Based on Chande Momentum OscillatorPine Script · Mean reversion · 1d
- Adaptive Trading Strategy Combining Dynamic Trend Reversal and Stochastic IndicatorPine Script · Mean reversion · 1d
- Advanced 15 Minute Chart Trading Signal StrategyPine Script · Mean reversion · 3h
- Advanced Momentum EMA Trend Following with RSI Overbought Oversold Trading StrategyPine Script · Mean reversion · 1d