Strategy vault / Trend following
Dual Moving Average Crossover Strategy 432902
This is a simple quantitative trading strategy based on moving average indicators. It uses the golden cross and death cross of fast and slow moving averages to determine entry and exit signals. When the fast MA…
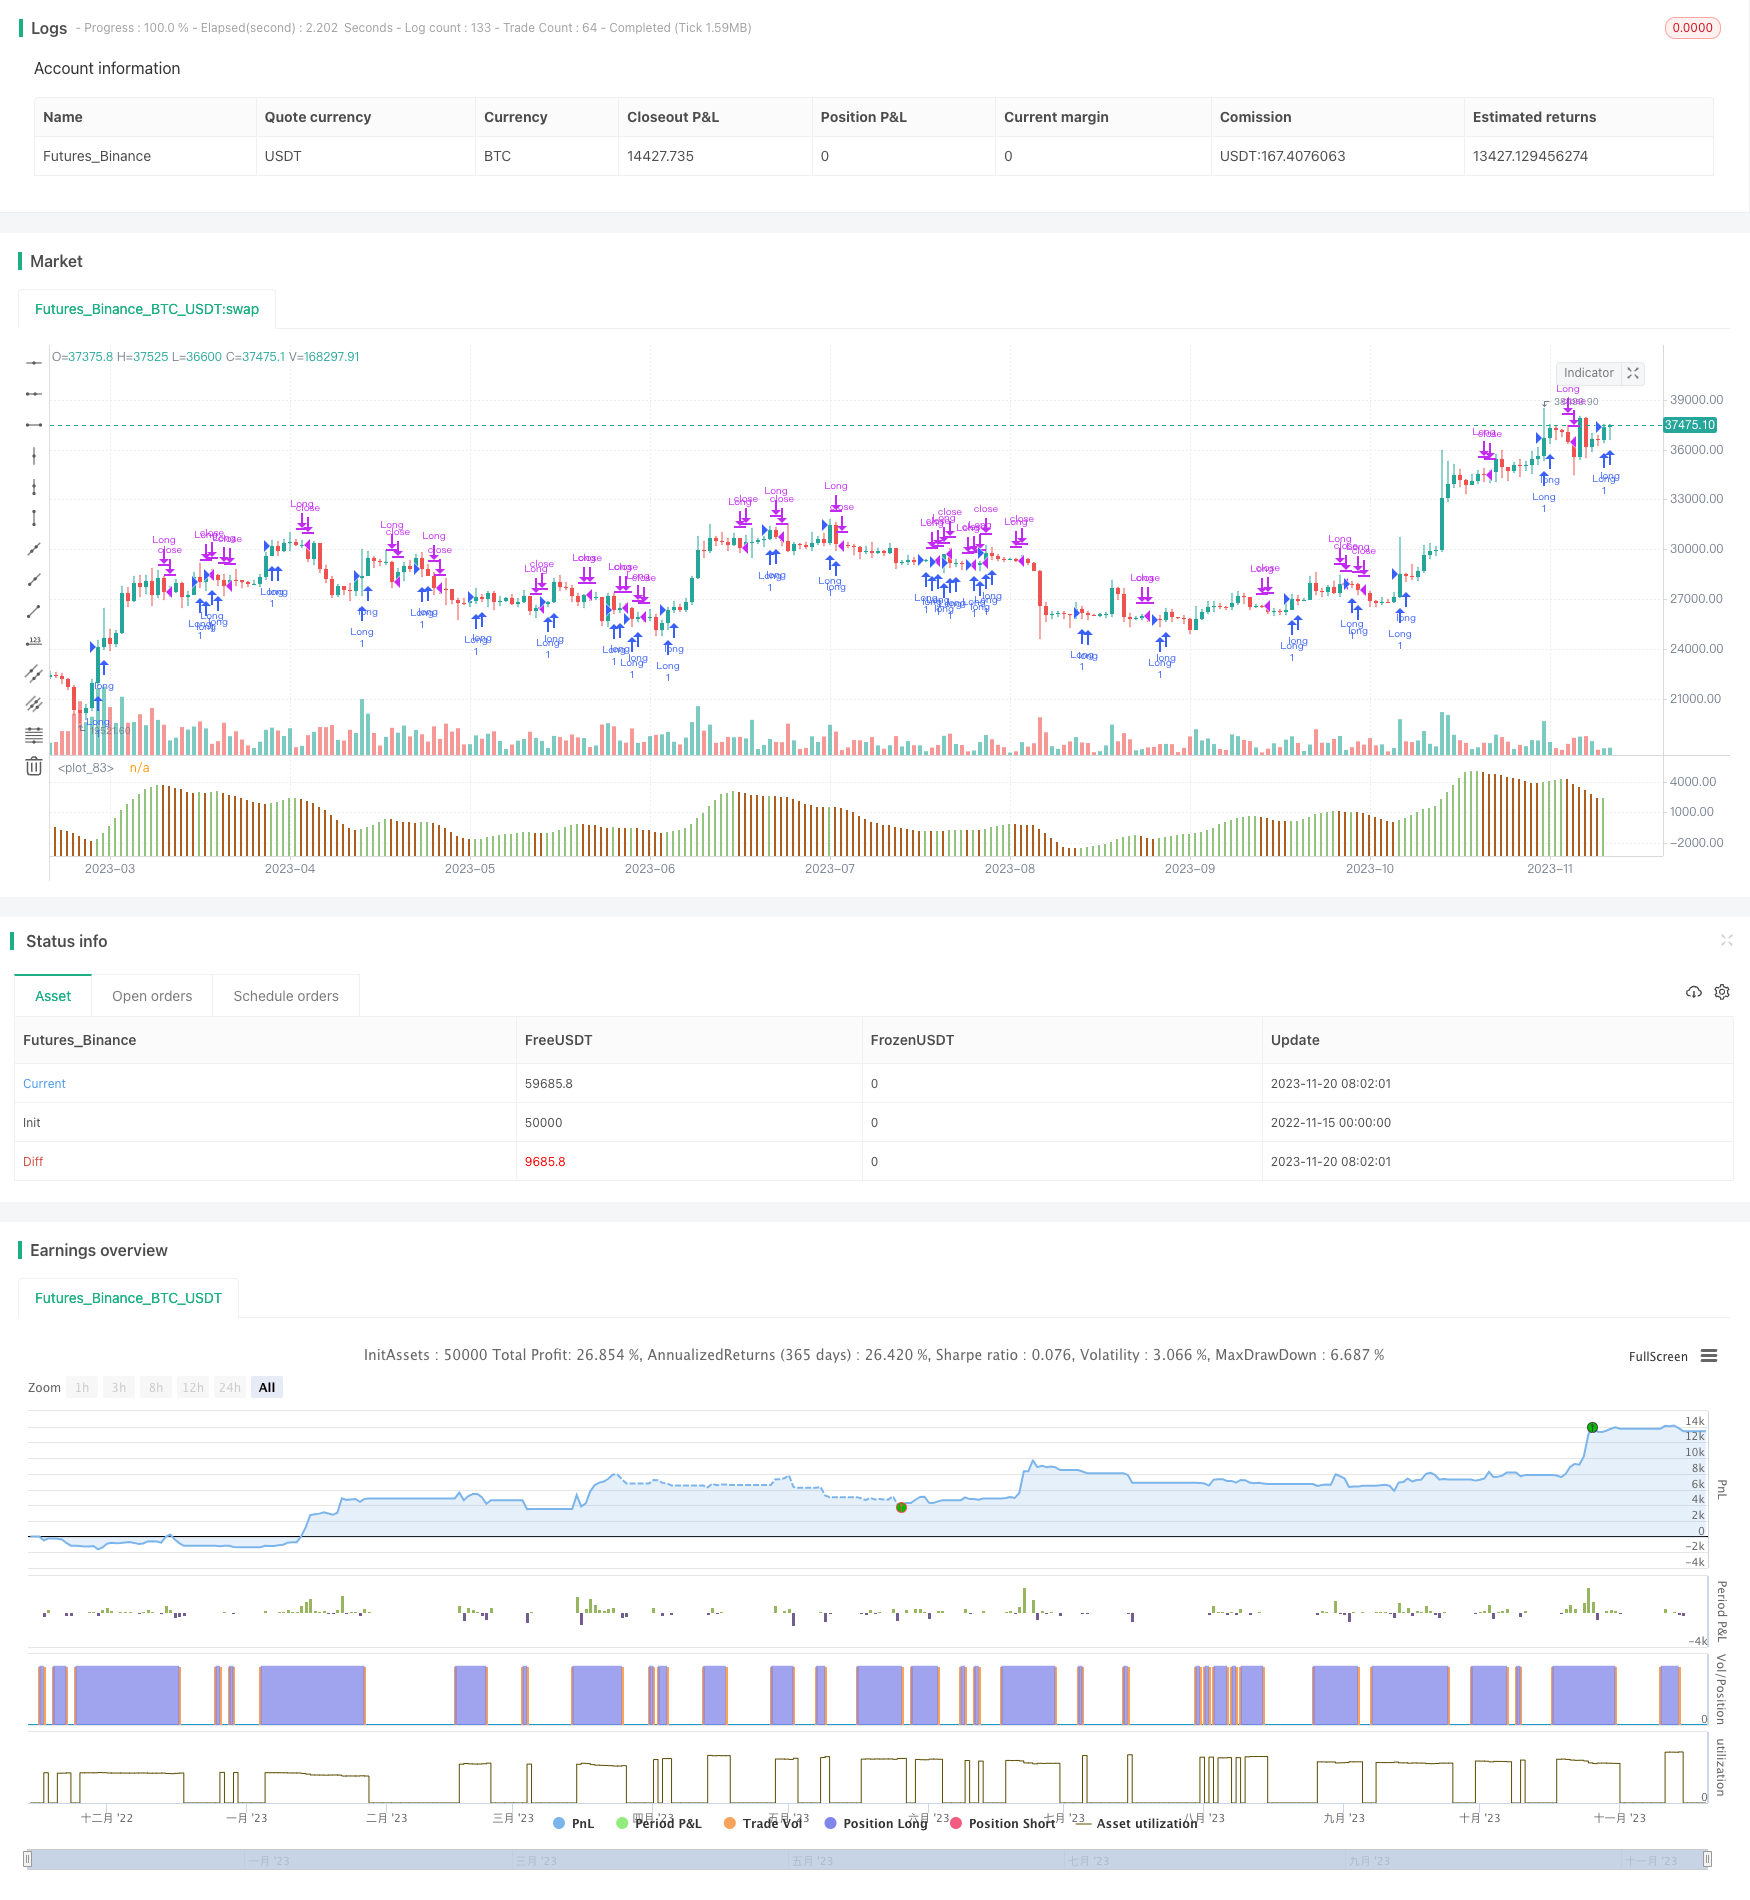
Overview
This is a simple quantitative trading strategy based on moving average indicators. It uses the golden cross and death cross of fast and slow moving averages to determine entry and exit signals. When the fast MA crosses above the slow MA from below, a buy signal is generated. When the fast MA crosses below the slow MA from above, a sell signal is generated.
Strategy Logic
The strategy mainly leverages the trend tracking capability of moving averages. The fast MA has a smaller parameter and can quickly respond to price changes, while the slow MA has a larger parameter and represents the long-term trend. The fast MA crossing above the slow MA signals a reversal in short-term moves and the start of an uptrend. The fast MA crossing below the slow MA signals a reversal to a downtrend. By capturing these signals, we can trade along with the momentum.
Specifically, this strategy defines a 5-day (fast) and 34-day (slow) double moving average. It calculates these two MAs daily and checks if the fast MA crosses above or below the slow MA. If a golden cross happens, it goes long. If a death cross happens, it exits positions.
Advantage Analysis
This is a simple and easy to understand strategy, suitable for quant trading beginners. Compared to complex strategies, it is much easier to implement.
The dual MA strategy can filter out market noise effectively and capture the main trend. By tuning the MA days parameters, it can adapt to price swings across different time frames.
It also has a built-in stop loss mechanism. When prices start to reverse direction and the MAs death cross happens, it will exit positions timely to control risks.
Risk Analysis
The dual MA strategy has risks like failed stop losses or curve fitting failures. The main issues are:
MAs have lagging effects and may generate signals only after the trend has already reversed. Profitable trades can turn into losses.
In ranging markets, there can be many false signals, causing unnecessary trades, increased costs and slippage.
It relies solely on technical indicators without combining fundamental analysis. It may perform poorly during events driving market moves.
It does not consider position sizing and risk management. One black swan event can cause the strategy to blow up.
Optimization Directions
To better leverage its strengths and reduce risks, optimizations can be made in the following ways:
Add trending indicators like MACD and volatility indicators like KDJ to set more rigorous entry rules and filter out false signals.
Incorporate appropriate stop loss mechanisms, like exiting after prices drop a certain percentage post golden cross, or after prices fall a set range from new highs/lows.
Optimize fast and slow MA days combinations to adapt to price swings across different time frames. Parameter optimization can find the best parameters.
Reference broad market indices to determine overall market regime and avoid overtrading in ranging markets.
Incorporate trading volume changes to verify the reliability of trend signals. For example, require strong volume when signals trigger.
Conclusion
The dual moving average crossover strategy is a very typical quantitative trading strategy. It has pros like simplicity, intuitiveness and ease of implementation. With continuous testing and parameter tuning, it can produce decent results. However, issues like lagging signal identification and false signals do exist. Additional filters and risk management mechanisms need to incorporated to make it a stable profit-generating strategy.
Parameters
| Name | Default | What it controls |
|---|---|---|
| v_input_1 | true | From Month |
| v_input_2 | true | From Day |
| v_input_3 | 2017 | From Year |
| v_input_4 | 34 | Length Slow |
| v_input_5 | 5 | Length Fast |
| v_input_6 | false | Include Short Trades |
| v_input_7 | false | Trade reverse |
| v_input_8 | 14 | length |
Source Pine Script
/*backtest
start: 2022-11-15 00:00:00
end: 2023-11-21 00:00:00
period: 1d
basePeriod: 1h
exchanges: [{"eid":"Futures_Binance","currency":"BTC_USDT"}]
*/

//@version=2
////////////////////////////////////////////////////////////
// This strategy is a modification to the "Bill Williams, Awesome Oscillator
// (AO) Backtest" strategy (Copyright by HPotter v1.0 29/12/2016)
//
// This version of the strategy by Midnight Mouse. 10/4/2018
//
// DESCRIPTION
//
// This indicator plots the oscillator as a column where periods fit for buying
// are marked as green, and periods fit for selling as orange/brown. If the
// current value of AO (Awesome Oscillator) is > the previous, the period is
// deemed fit for buying and the indicator is marked green. If the AO values is
// not over the previous, the period is deemed fit for selling and the indicator
// is marked orange/brown.
//
// You can change long to short in the Input Settings
//
// Please, use it only for learning or paper trading. Do not for real trading.
////////////////////////////////////////////////////////////

strategy("Awesome Oscillator.MMouse_Lager_BCE")

// === SETTINGS ===

// Strategy start date
FromMonth   = input(defval = 1,    title = "From Month", minval = 1)
FromDay     = input(defval = 1,    title = "From Day",   minval = 1)
FromYear    = input(defval = 2017, title = "From Year",  minval = 2014)

// Strategy settings
nLengthSlow = input(34, minval=1,  title="Length Slow")
nLengthFast = input(5,  minval=1,  title="Length Fast")
allowShorts = input(false,         title="Include Short Trades")
reverse     = input(false,         title="Trade reverse")


// === BODY ===

// Use Heikin-Ashi candles for the buy/sell signal
ha_t        = heikinashi(syminfo.tickerid)
ha_high     = security(ha_t, timeframe.period, high)
ha_low      = security(ha_t, timeframe.period, low)
length      = input( 14 )
price       = open
vrsi        = rsi(price, length)

// Calc (H+L)/2 for each length
xSMA1_hl2   = sma((ha_high + ha_low)/2, nLengthFast)
xSMA2_hl2   = sma((ha_high + ha_low)/2, nLengthSlow)

// Get SMA difference (Fast - Slow)
xSMA1_SMA2  = xSMA1_hl2 - xSMA2_hl2

// Derive the color of the column
cClr = xSMA1_SMA2 > xSMA1_SMA2[1] ? #93c47d : #ad5e1d

// Determine the position to take (Long vs. Short)
pos = iff(xSMA1_SMA2 > xSMA1_SMA2[1],  1, iff(xSMA1_SMA2 < xSMA1_SMA2[1], -1, nz(pos[1], 0)))
possig = iff(reverse and pos == 1, -1, iff(reverse and pos == -1, 1, pos))

// Only apply strategy from the start date
if (time >= timestamp(FromYear, FromMonth, FromDay, 00, 00))
    if (possig == 1)
        // Market is currently fit for a Long position
        strategy.entry("Long", strategy.long)

    if (possig == -1)
        // Market is currently fit for a Short position
        if(allowShorts)
            // Shorts are allowed. Record a Short position
            strategy.entry("Short", strategy.short)
        else
            // Shorts are not allowed. Closec the Long position.
            strategy.close("Long")

// Define the candle colors
//barcolor(possig == -1 ? red :
//         possig ==  1 ? green :
//         blue )

// Plot the oscillator
plot(xSMA1_SMA2, style=columns, linewidth=1, color=cClr)Published by ChaoZhang on the FMZ strategy square · last modified 2023-11-22. Collected in the Quant Trading Vault. Unvalidated research: re-test with your own data and costs before trusting it.
Build this with AgenKit
A spec is not a trading system. Paste this into your coding agent and AgenKit runs a specialist team — architecture, test-first build, risk gates, review — with paper trading on by default.
/agenkit build a production-grade trading bot with a backtest engine, risk controls and paper trading by default from strategies/Dual-Moving-Average-Crossover-Strategy-432902.md- npx agenkit install engineering-kit in your project
- Paste the command into your agent and approve each phase
- Get tests, backtest, risk controls and a paper-trading switch
Understand it first
Before you run this, read the lesson behind the idea and how to backtest it honestly. Specs like this one are the survivors of an unknown number of trials; deflate their results accordingly.
Related specs
- WaveTrend and DER Based Swing Trading StrategyPine Script · Trend following · 1d
- Dynamic Moving Average Trend Trading StrategyPine Script · Trend following · 1d
- Multi Timeframe Smoothed Heikin Ashi Trend Following Quantitative Trading SystemPine Script · Trend following · 1d
- Multiple Timeframe Filtered Trend Following StrategyPine Script · Trend following · 1h
- Concise Dynamic Trend StrategyPine Script · Trend following · 2h
- Quantitative Trading Strategy Based on Double Trend FilterPine Script · Trend following · 1h