Strategy vault / Trend following
Dual Moving Average Crossover Strategy 433923
The Dual Moving Average Crossover strategy generates trading signals by calculating two moving averages of different periods and detecting their crossover situations. It belongs to a commonly used technical analysis…
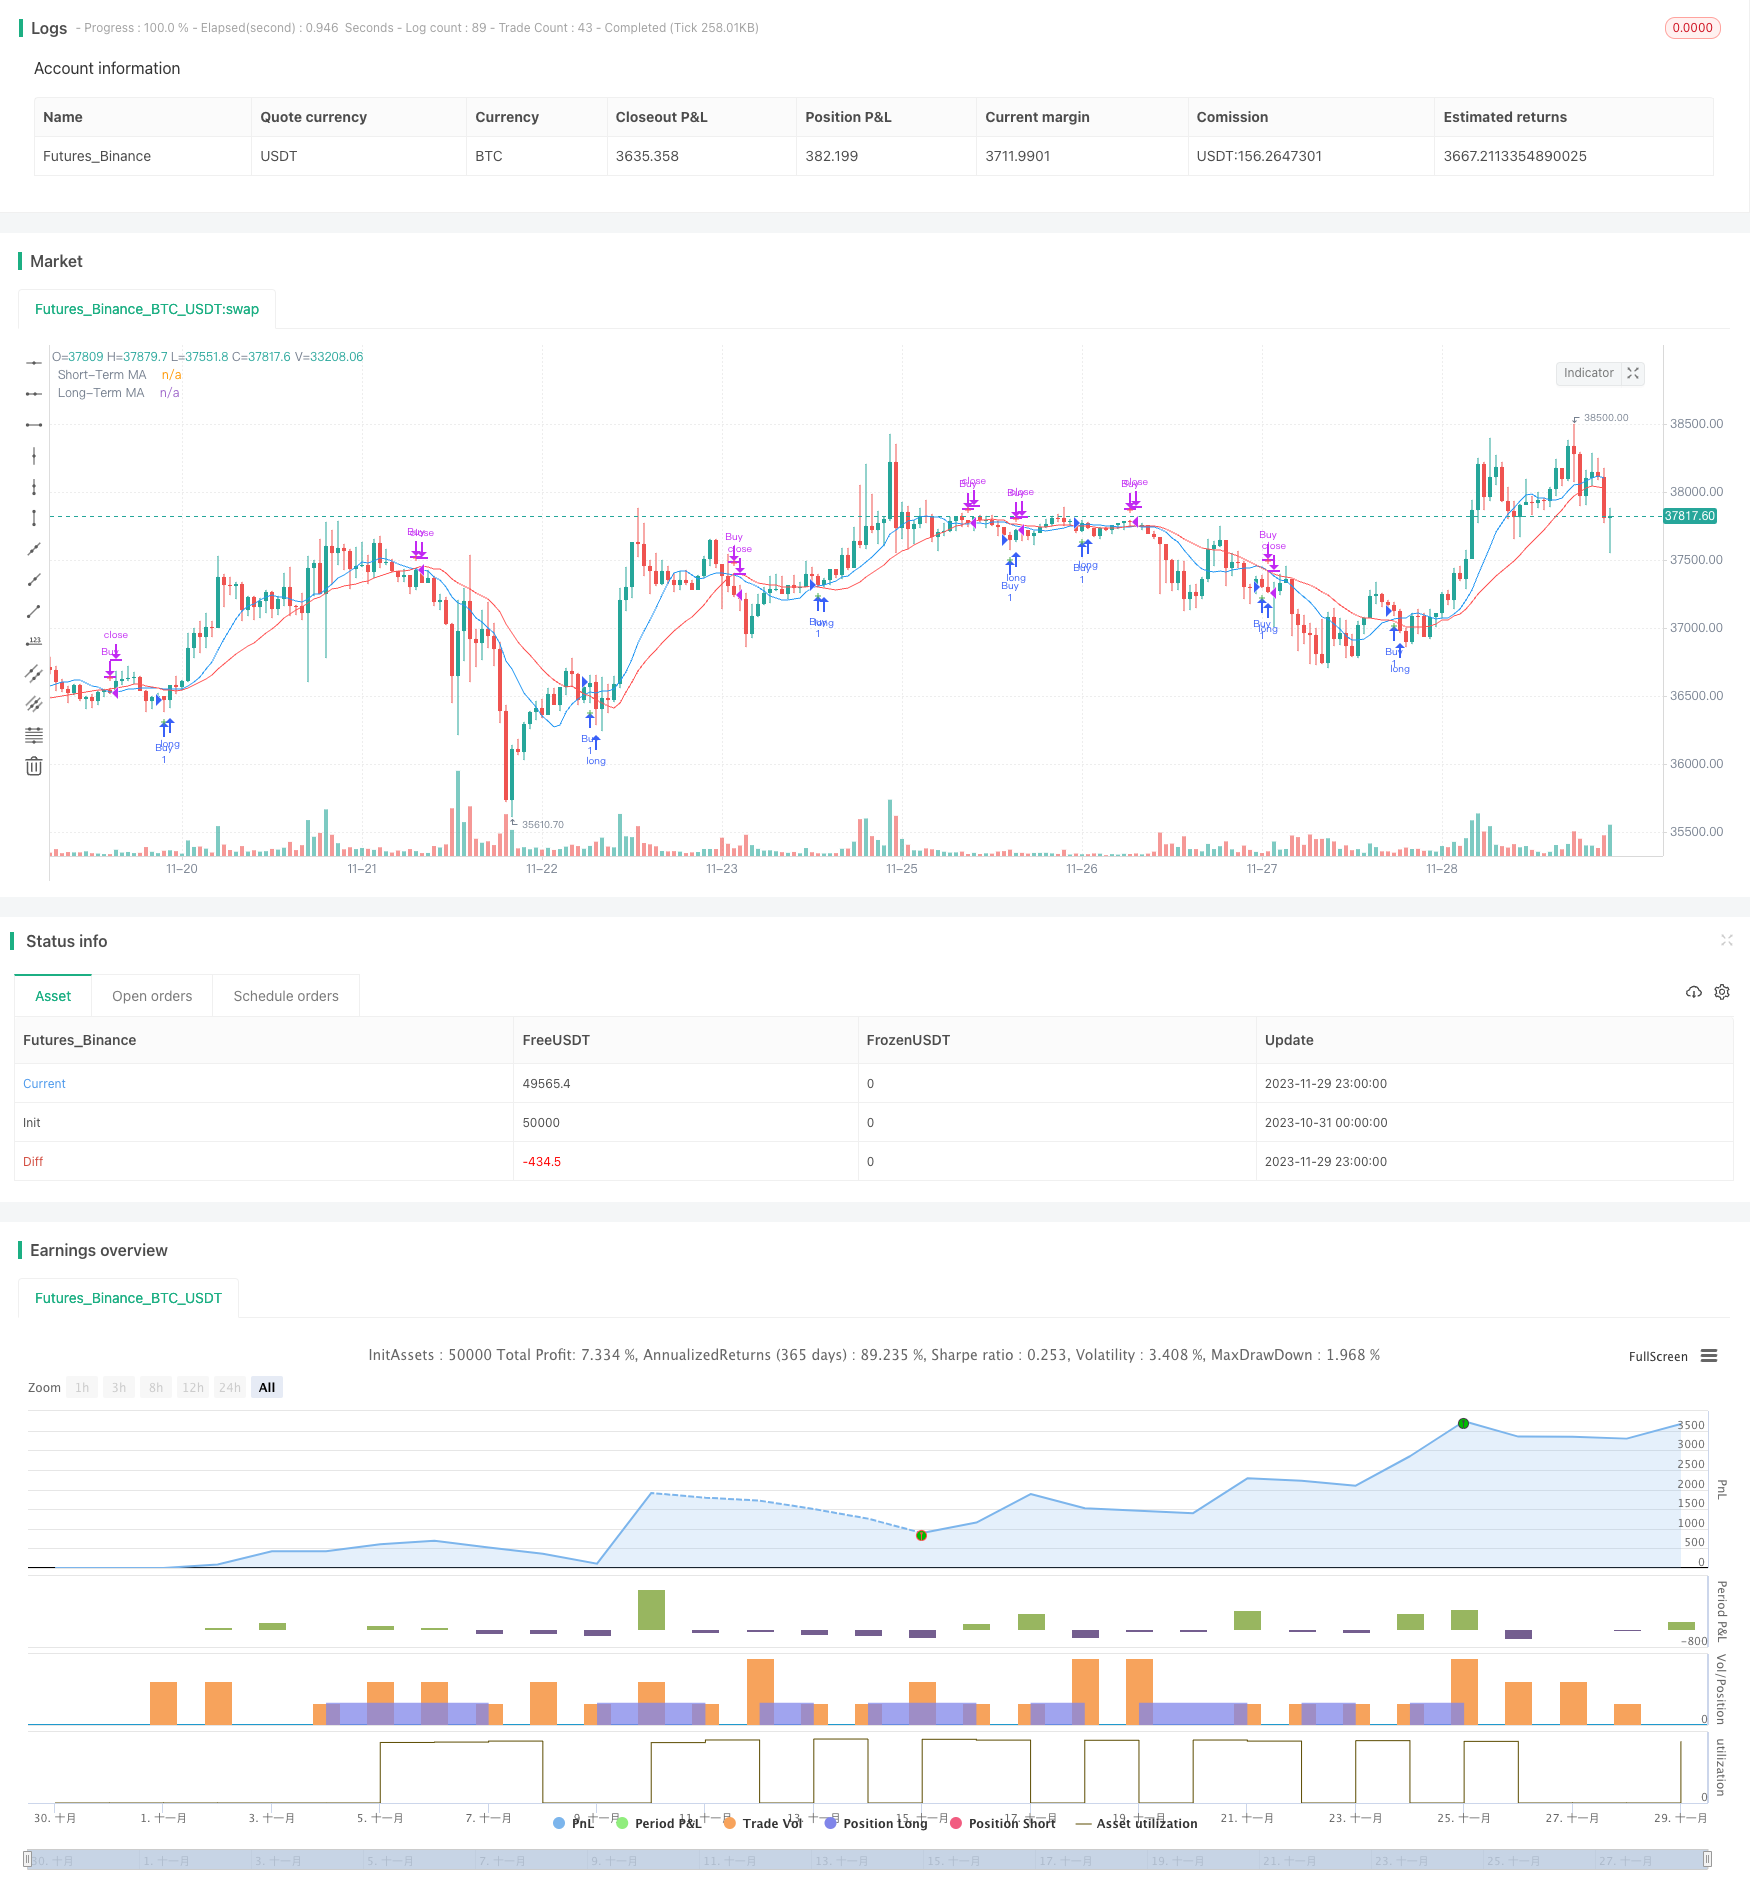
Overview
The Dual Moving Average Crossover strategy generates trading signals by calculating two moving averages of different periods and detecting their crossover situations. It belongs to a commonly used technical analysis strategy. The core of this strategy is to use the crossover of a short-term moving average above a long-term moving average to generate a buy signal, and the crossover of the short-term moving average below the long-term moving average to generate a sell signal. By capturing the crossover patterns of short-term and long-term time series, it judges the inflection point of the price curve and determines when to buy or sell.
Principles
The technical principle of this strategy is: the long-term moving average reflects the average price over a long time period and is a relatively stable line, while the short-term moving average is more sensitive and reflects price changes over a short time period, which is a more active and strongly random line. When the short-term moving average crosses above the long-term moving average, it indicates that the price in the short-term cycle has risen above the average level of the long-term cycle, showing an accelerating upward trend. At this point, going long through buying can generate profits. And when the short-term moving average crosses below the long-term moving average again, it indicates that the upward momentum of prices has begun to slow down, which is the period of profit taking. At this time, reducing positions or clearing positions is a reasonable choice.
By comparing prices over short-term and long-term time cycles, this strategy emphasizes the investment philosophy of "riding the momentum" to buy and "profit taking" to sell. Such momentum strategies utilizing moving average crossover patterns are different from mean reversion strategies based on the "contrarian" idea that utilize reversed moving average crossovers. It belongs to a more proactive and decisive type of investment strategy.
Advantage Analysis
The dual moving average crossover strategy has the following advantages:
- The logic is clear and simple, easy to understand and implement.
- It intuitively reflects the changes in price patterns over short and long time cycles, which is conducive to grasping market rhythms.
- The trading signals are clear, making decision-making more decisive.
- It has strong extensibility and flexibility to select short and long moving average cycle combinations.
- Customized trading strategies can be incorporated with other factors in decision making.
Risk Analysis
The dual moving average crossover strategy also has some limitations and risks:
- When the short and long moving averages fluctuate frequently, it will generate more false signals and unnecessary trades.
- There is a lag in signal generation, unable to locate the optimal timing of price reversals.
- It only focuses on the time series changes of prices itself without comprehensively considering other micro and macro factors.
- Trading decisions are relatively mechanical and rigid without adjustments based on changing market environments.
The corresponding risk management and optimization methods include: adding filter conditions, adjusting moving average parameter combinations, incorporating other indicators for decision making, etc.
Optimization Directions
The dual moving average crossover strategy can be optimized in the following directions:
- Optimize the moving average parameter combinations to find the optimal parameters through exhaustive search and machine learning techniques.
- Add filter conditions to avoid false signals, such as trading volume conditions, price fluctuation range conditions, etc.
- Incorporate other indicators such as MACD, KDJ for multivariate decisions.
- Use adaptive techniques to dynamically optimize moving average parameters or switch strategy ensembles based on market environments.
- Incorporate advanced models like deep learning for more intelligent decisions and asset allocations.
Conclusion
The dual moving average crossover strategy judges the trend and inflection points of prices by comparing short and long moving averages, which is a relatively simple and direct technique in technical analysis. Its advantage lies in the clarity of logic and ease of implementation, but it also has problems such as generating false signals and rigid decisions. The future optimization directions are parameter optimization, risk control and incorporating more factors and new technologies for decision making. In general, the dual moving average strategy is one of the basic entry-level quantitative trading strategies that is worth in-depth research and application promotion.
Parameters
| Name | Default | What it controls |
|---|---|---|
| v_input_1 | 10 | Short-Term MA Period |
| v_input_2 | 20 | Long-Term MA Period |
Source Pine Script
/*backtest
start: 2023-10-31 00:00:00
end: 2023-11-30 00:00:00
period: 1h
basePeriod: 15m
exchanges: [{"eid":"Futures_Binance","currency":"BTC_USDT"}]
*/

//@version=4
strategy("Moving Average Crossover Strategy", overlay=true)

// Input parameters
short_term_period = input(10, title="Short-Term MA Period")
long_term_period = input(20, title="Long-Term MA Period")

// Calculate moving averages
short_term_ma = sma(close, short_term_period)
long_term_ma = sma(close, long_term_period)

// Buy signal
buy_signal = crossover(short_term_ma, long_term_ma)

// Sell signal
sell_signal = crossunder(short_term_ma, long_term_ma)

if (buy_signal)
    strategy.entry("Buy", strategy.long)

if (sell_signal)
    strategy.close("Buy")

// Plot moving averages
plot(short_term_ma, color=color.blue, title="Short-Term MA")
plot(long_term_ma, color=color.red, title="Long-Term MA")

// Plot buy and sell signals on the chart
plotshape(series=buy_signal, location=location.belowbar, color=color.green, style=shape.cross, title="Buy Signal")
plotshape(series=sell_signal, location=location.abovebar, color=color.red, style=shape.cross, title="Sell Signal")
Published by ChaoZhang on the FMZ strategy square · last modified 2023-12-01. Collected in the Quant Trading Vault. Unvalidated research: re-test with your own data and costs before trusting it.
Build this with AgenKit
A spec is not a trading system. Paste this into your coding agent and AgenKit runs a specialist team — architecture, test-first build, risk gates, review — with paper trading on by default.
/agenkit build a production-grade trading bot with a backtest engine, risk controls and paper trading by default from strategies/Dual-Moving-Average-Crossover-Strategy-433923.md- npx agenkit install engineering-kit in your project
- Paste the command into your agent and approve each phase
- Get tests, backtest, risk controls and a paper-trading switch
Understand it first
Before you run this, read the lesson behind the idea and how to backtest it honestly. Specs like this one are the survivors of an unknown number of trials; deflate their results accordingly.
Related specs
- ADX MA and EMA Long Only Trend Tracking StrategyPine Script · Trend following · 1d
- ATR and Moving Average Crossover Hybrid StrategyPine Script · Trend following · 1h
- Adaptive FVG Detection and MA Trend Trading Strategy with Dynamic ResistancePine Script · Trend following · 1d
- Adaptive Risk Management Strategy Based on Dynamic ATR and Moving Average CrossoverPine Script · Trend following · 2h
- Adaptive Trading Strategy Based on Stochastic RSI Dual Line CrossoverPine Script · Trend following · 4h
- Adaptive Volatility Based Trend Following Short Strategy with Time Delay and Stop Loss ProtectionPine Script · Trend following · 2m