Strategy vault / Mean reversion
Dual Moving Average Oscillator Stock Strategy
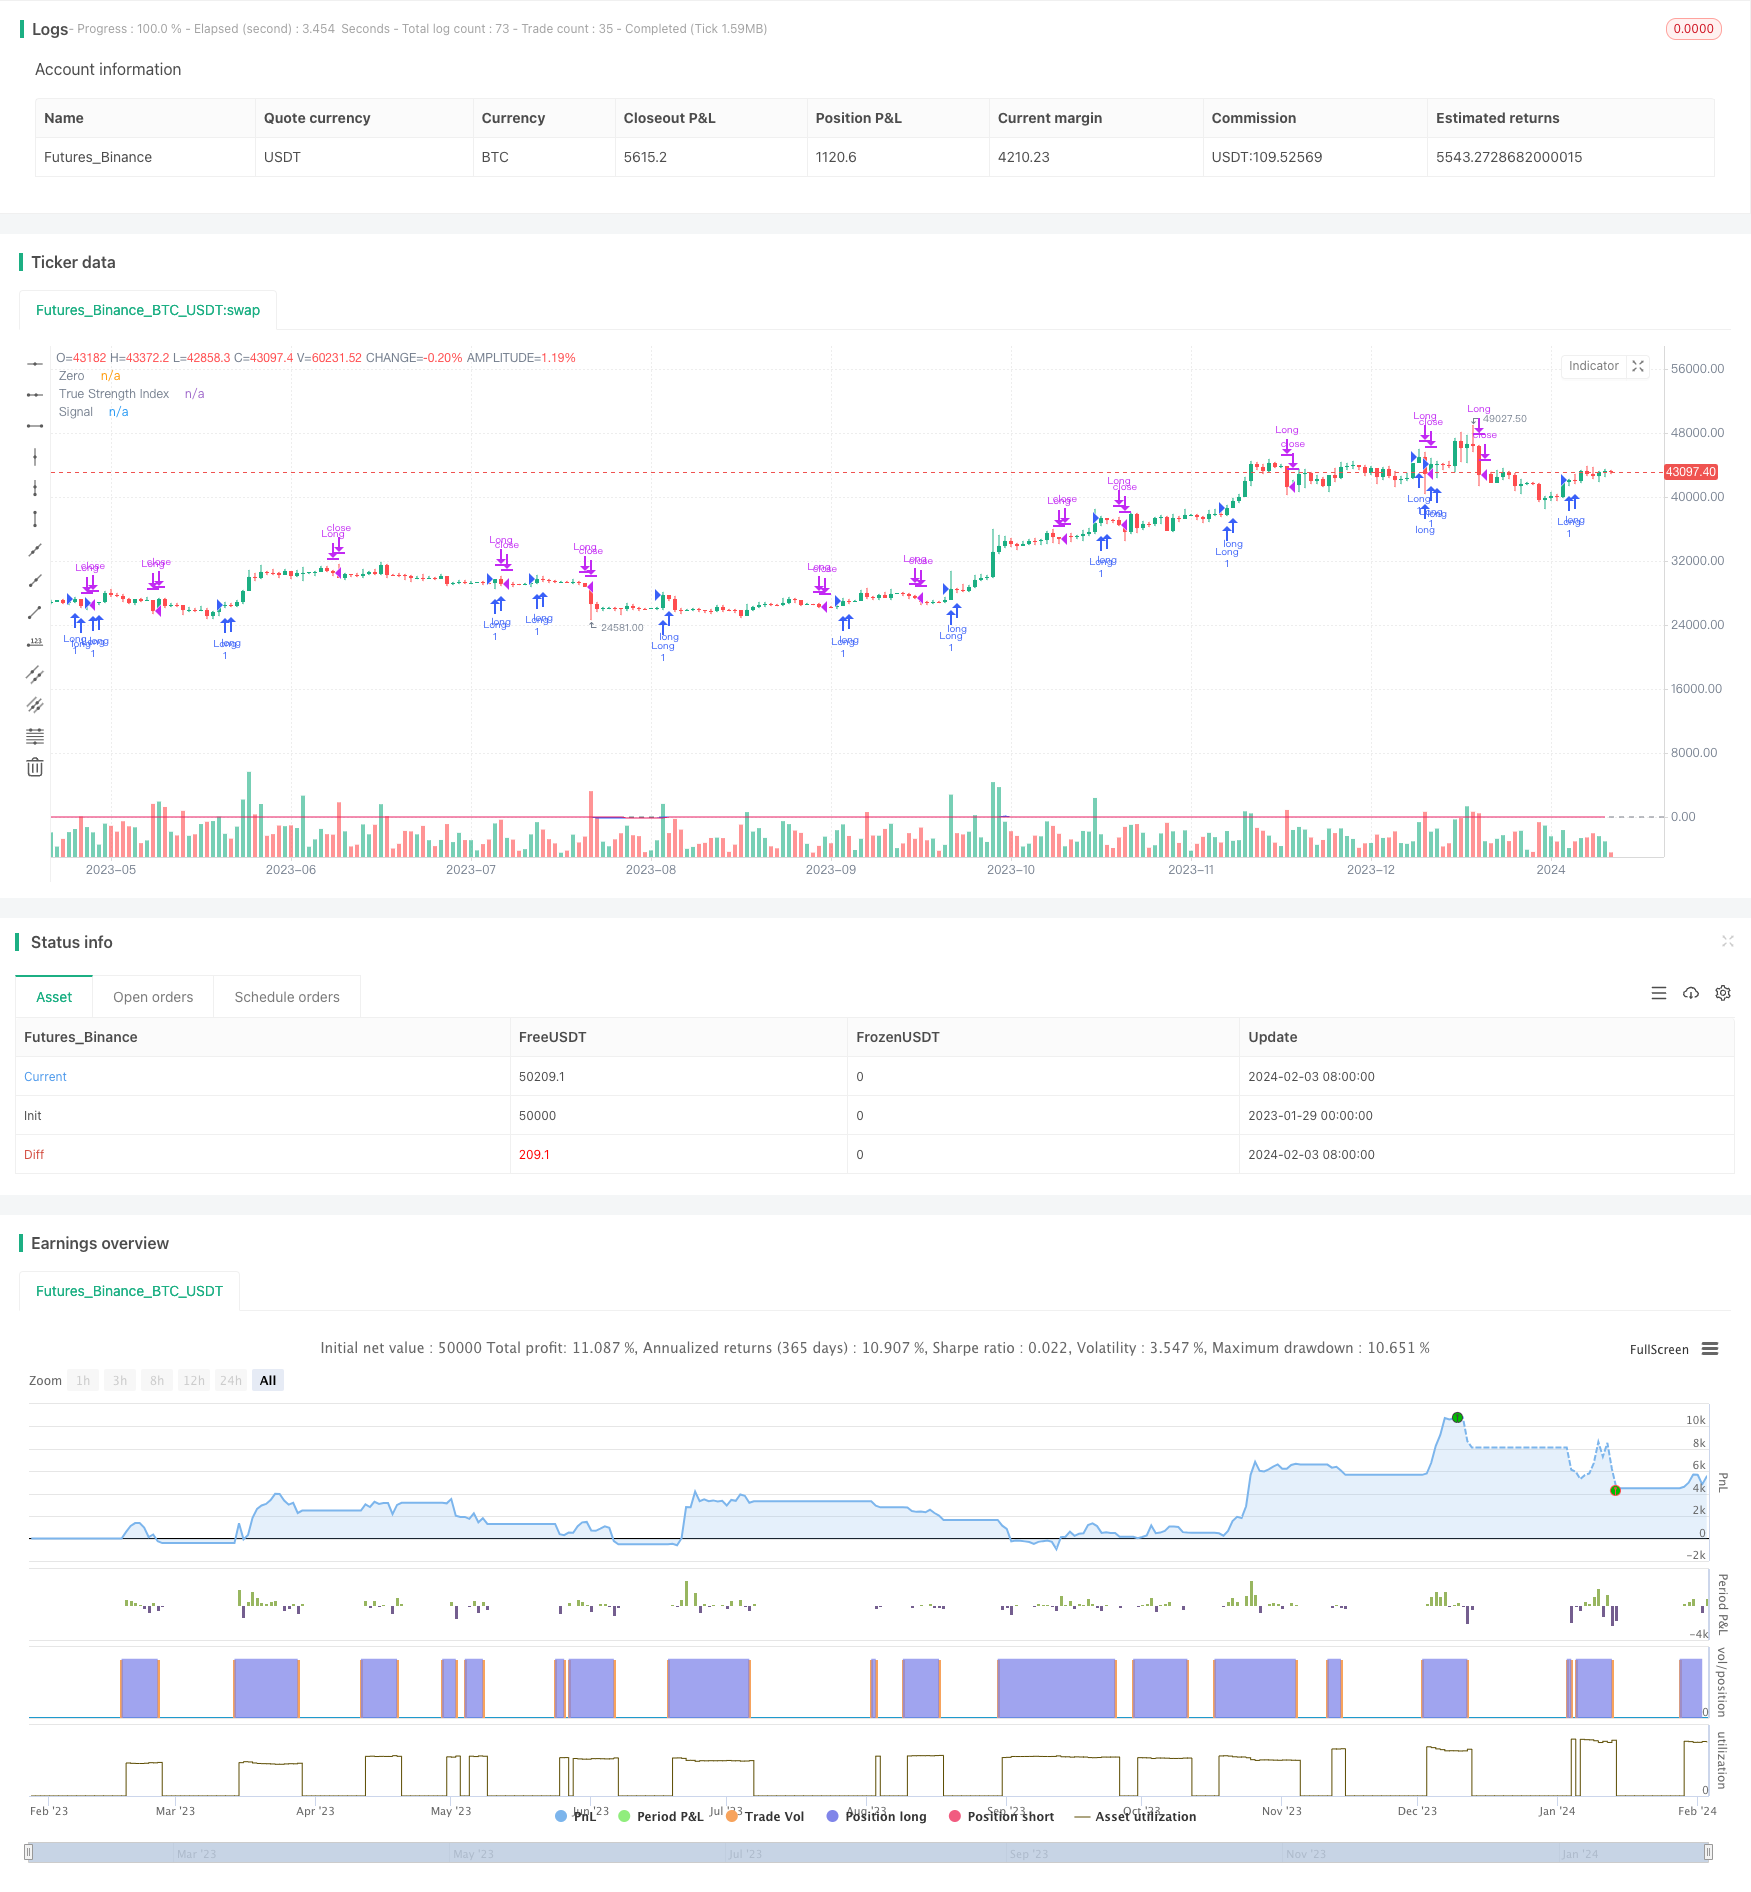
This strategy uses the Dual Moving Average Oscillator index to determine the buy and sell points of stocks. The Dual Moving Average Oscillator index consists of two exponential moving averages with different…
Overview
This strategy uses the Dual Moving Average Oscillator index to determine the buy and sell points of stocks. The Dual Moving Average Oscillator index consists of two exponential moving averages with different parameters, and measures the momentum of price changes to detect overbought and oversold conditions.
Strategy Principle
The core indicator of this strategy is the True Strength Index (TSI). The calculation method is:
Calculate the price change pc=close-preclose
Smooth pc twice using both long period of 12 days and short period of 9 days exponential moving average. Obtain double smoothed price change: double_smoothed_pc
Similarly, double smooth the absolute value |pc| to get double_smoothed_abs_pc
Finally TSI index = 100*(double_smoothed_pc/double_smoothed_abs_pc)
By comparing the TSI value with its signal line tsi_signal, we can determine overbought or oversold zones, thereby deciding buy and sell points.
Buy signal: TSI crosses over its signal upward, indicating reversal of the stock price, marking the start of overbought zone where we should long.
Sell signal: TSI crosses below its signal downward, indicating reversal of the stock price, marking the end of overbought zone where we should sell out.
Advantage Analysis
The biggest advantage of this strategy lies in using the dual moving average indicator to identify cyclical features in stock prices. By simultaneously employing both long and short periods in the dual moving average, it can capture price change trends more sensitively and accurately than a single moving average, and is more effective in determining trading signals.
In addition, this strategy chooses the TSI index rather than other common technical indicators, because TSI pays more attention to calculating price change momentum, which can judge overbought/oversold conditions more precisely, resulting in better trading points.
Risk Analysis
The biggest risk of this strategy is that the dual moving average itself is quite sensitive to price changes. In case of price fluctuation, it can easily generate false signals. Moreover, the criteria for TSI to judge overbought/oversold zones are still subjective, and improper parameter settings also impact the accuracy.
To control such risks, it is advisable to optimize parameters appropriately by adjusting lengths of the double moving averages. Combining other indicators to verify signals is also necessary to avoid opening positions amid volatility. Furthermore, optimizing stop-loss strategies and setting up risk control measures against emergencies are quite essential.
Optimization Directions
The optimization directions of this strategy mainly focus on two aspects:
Parameter optimization. The optimal combination of parameters like lengths of long and short moving average and signal line can be backtested to improve the sensitivity.
Configure filtering indicators. Such as combining Bollinger Bands, KDJ and so on to verify buy/sell signals and prevent wrong opening of positions. Trading volume filter can also be applied to open positions only when volume surges.
Add stop-loss strategy. Set up moving stop loss, timed exit to limit the loss of single position. Also we can suspend trading temporarily based on market condition to control systematic risk.
Optimize position sizing. Set up dynamic size and proportion of positions based on market condition to manage the risk exposure of every trade.
Summary
This strategy utilizes the calculation method of Dual Moving Average Oscillator index, integrating both long and short term analysis of price momentum changes, thereby determining overbought and oversold zones to decide entries and exits. Compared to a single moving average, it has the advantage of more accurate and sensitive judgement. Of course, proper parameter optimization is still necessary, coupled with other indicators for signal filtering, so as to enhance the stability and profitability. Overall, this strategy provides an effective technical tool to determine trading points, which is worth live testing and optimizing.
Parameters
| Name | Default | What it controls |
|---|---|---|
| v_input_1 | 10000 | Initial Capital |
| v_input_2 | true | Risk Percentage |
| v_input_3 | 12 | Long Length |
| v_input_4 | 9 | Short Length |
| v_input_5 | 12 | Signal Length |
Source Pine Script
/*backtest
start: 2023-01-29 00:00:00
end: 2024-02-04 00:00:00
period: 1d
basePeriod: 1h
exchanges: [{"eid":"Futures_Binance","currency":"BTC_USDT"}]
*/

// This Pine Script™ code is subject to the terms of the Mozilla Public License 2.0 at https://mozilla.org/MPL/2.0/
// © shankardey7310

//@version=5
strategy("TSI STOCKS", shorttitle="TSI", overlay=true)

initialCapital = input(10000, title="Initial Capital")
riskPercent = input(1, title="Risk Percentage") / 100

longLength = input(12, title="Long Length")
shortLength = input(9, title="Short Length")
signalLength = input(12, title="Signal Length")

price = close
pc = ta.change(price)

double_smooth(src, long, short) =>
    first_smooth = ta.ema(src, long)
    ta.ema(first_smooth, short)

double_smoothed_pc = double_smooth(pc, longLength, shortLength)
double_smoothed_abs_pc = double_smooth(math.abs(pc), longLength, shortLength)
tsi_value = 100 * (double_smoothed_pc / double_smoothed_abs_pc)
tsi_signal = ta.ema(tsi_value, signalLength)

riskAmount = (initialCapital * riskPercent) / close

if (tsi_value > tsi_signal and tsi_value[1] <= tsi_signal[1])
    strategy.entry("Long", strategy.long)

if (tsi_value < tsi_signal and tsi_value[1] >= tsi_signal[1])
    strategy.close("Long")

plot(tsi_value, title="True Strength Index", color=#2962FF)
plot(tsi_signal, title="Signal", color=#E91E63)
hline(0, title="Zero", color=#787B86)
Published by ChaoZhang on the FMZ strategy square · last modified 2024-02-05. Collected in the Quant Trading Vault. Unvalidated research: re-test with your own data and costs before trusting it.
Build this with AgenKit
A spec is not a trading system. Paste this into your coding agent and AgenKit runs a specialist team — architecture, test-first build, risk gates, review — with paper trading on by default.
/agenkit build a production-grade trading bot with a backtest engine, risk controls and paper trading by default from strategies/Dual-Moving-Average-Oscillator-Stock-Strategy.md- npx agenkit install engineering-kit in your project
- Paste the command into your agent and approve each phase
- Get tests, backtest, risk controls and a paper-trading switch
Understand it first
Before you run this, read the lesson behind the idea and how to backtest it honestly. Specs like this one are the survivors of an unknown number of trials; deflate their results accordingly.
Related specs
- 1 2 3 Pattern Quantitative Trading Strategy with EMAs MACD and 4th Candle ExtensionPine Script · Mean reversion · 1h
- ATR and EMA based Dynamic Take Profit and Stop Loss Adaptive StrategyPine Script · Mean reversion · 1h
- Advanced 15 Minute Chart Trading Signal StrategyPine Script · Mean reversion · 3h
- Advanced Momentum EMA Trend Following with RSI Overbought Oversold Trading StrategyPine Script · Mean reversion · 1d
- Advanced Quantitative Trading Strategy Combining RSI Divergence and Moving AveragesPine Script · Mean reversion · 1h
- Advanced Quantitative Trend Following and Cloud Reversal Composite Trading StrategyPine Script · Mean reversion · 1d