Strategy vault / Trend following
Dual Moving Average Trend Trading Strategy with Stop Loss and Take Profit
This strategy is a trend-following trading system based on dual moving average crossovers combined with risk management mechanisms. The strategy uses 9-period and 21-period Simple Moving Averages (SMA) to capture…
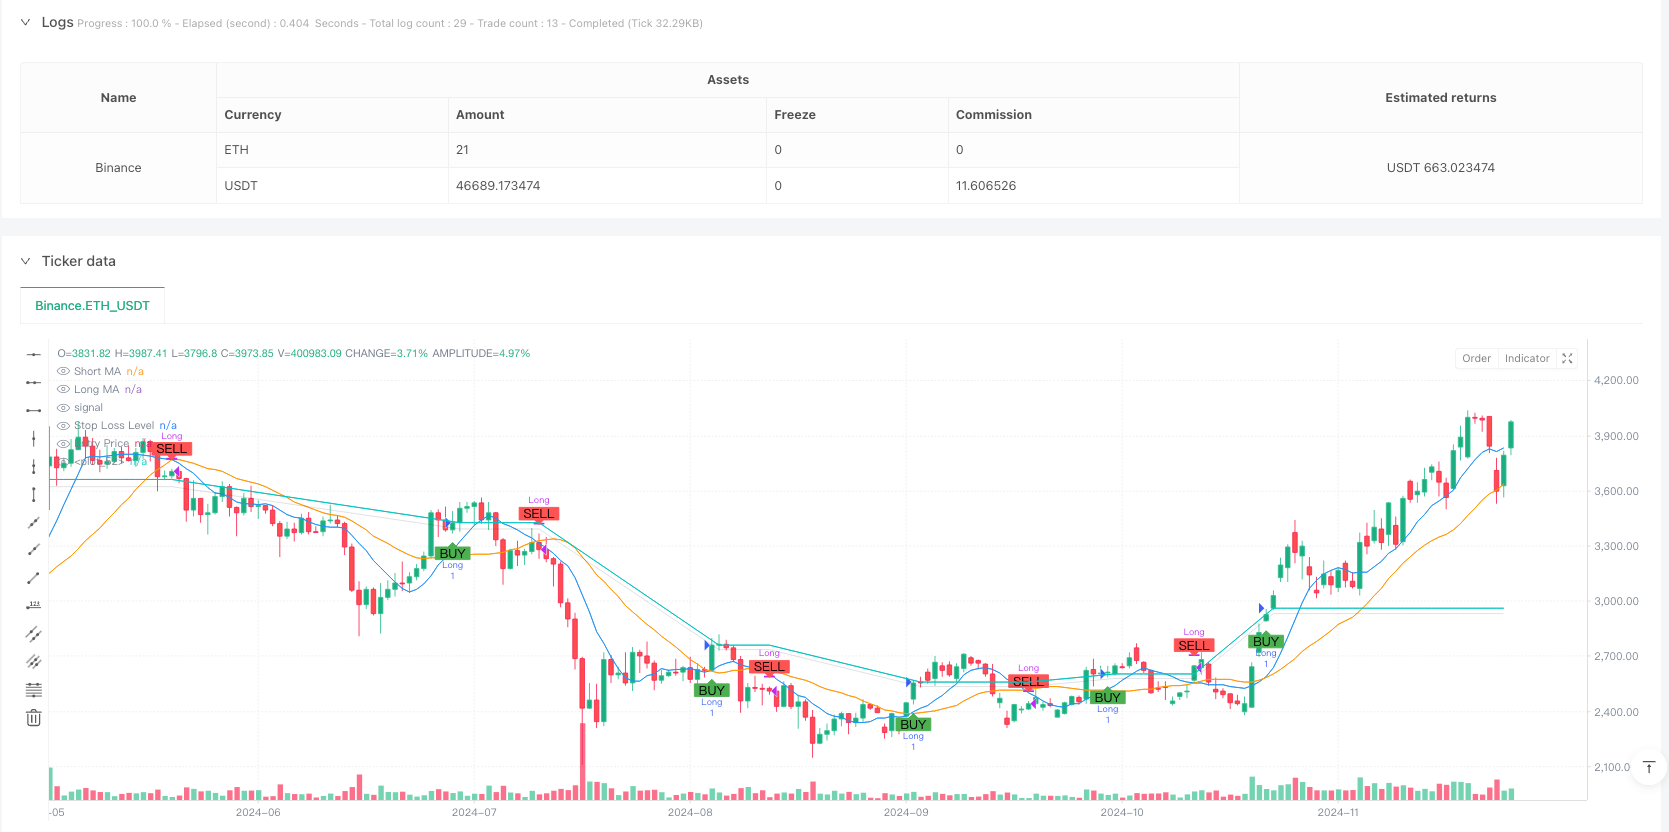
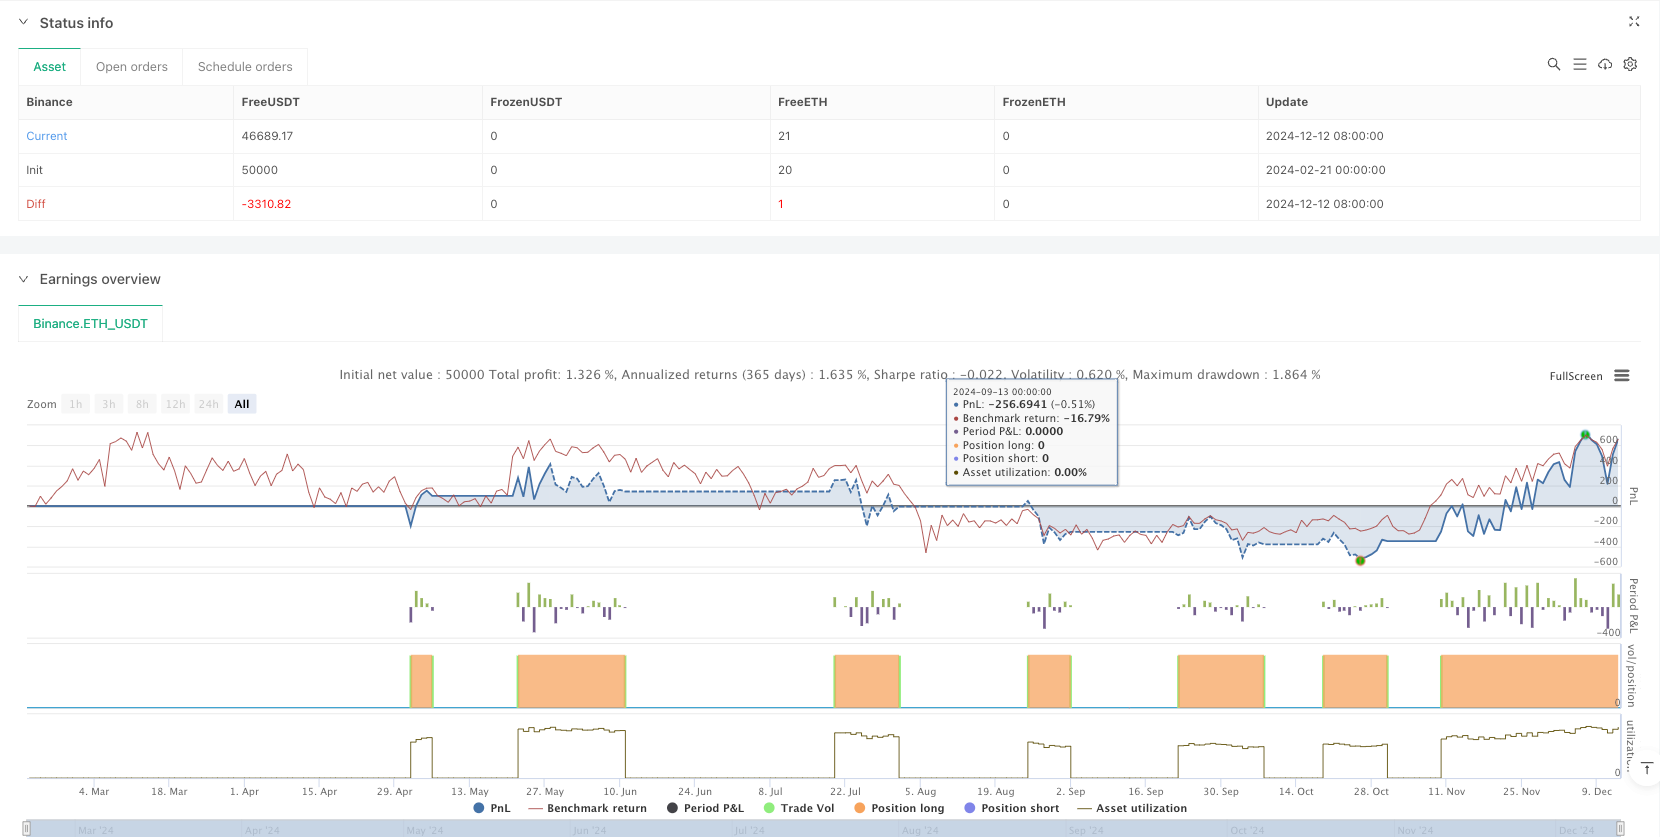
Overview
This strategy is a trend-following trading system based on dual moving average crossovers combined with risk management mechanisms. The strategy uses 9-period and 21-period Simple Moving Averages (SMA) to capture market trends, with 1% stop-loss and take-profit levels for risk control. The system enters long positions when the short-term MA crosses above the long-term MA and exits when the short-term MA crosses below the long-term MA.
Strategy Principles
The core logic is based on market trend continuity characteristics. By observing crossovers between short-term (9-period) and long-term (21-period) moving averages, the strategy identifies trend reversal points. A "Golden Cross" occurs when the short-term MA crosses above the long-term MA, signaling an uptrend and generating a long entry signal. A "Death Cross" occurs when the short-term MA crosses below the long-term MA, indicating potential trend reversal and triggering position closure. The strategy incorporates 1% stop-loss and take-profit mechanisms to limit losses during adverse market movements and secure profits at target levels.
Strategy Advantages
- Strong trend capture capability: Effectively identifies trend reversal points through dual MA crossovers.
- Comprehensive risk control: Fixed percentage stop-loss and take-profit levels effectively control per-trade risk.
- High automation level: System runs fully automatically without manual intervention.
- Good visualization: Clear graphical interface displaying trade signals and risk control zones.
- Flexible parameter optimization: MA periods and risk management levels can be adjusted for different market characteristics.
Strategy Risks
- Sideways market risk: Frequent MA crossovers in ranging markets may generate false signals.
- Slippage risk: Actual execution prices may significantly deviate from signal prices during high volatility.
- Trend reversal risk: Fixed stop-loss may be insufficient for sudden strong trend reversals.
- Parameter dependency: Strategy performance is sensitive to MA periods and risk management parameter settings.
Optimization Directions
- Implement trend filters: Add indicators like ADX to trade only in strong trends.
- Dynamic stop-loss mechanism: Use ATR or volatility to adjust stop-loss levels dynamically.
- Volume confirmation: Include volume as a confirmatory indicator for trade signals.
- Adaptive parameter optimization: Dynamically adjust MA periods based on market volatility characteristics.
- Add trend strength filtering: Incorporate RSI or similar indicators to assess trend strength.
Summary
This strategy captures trends through dual MA crossovers while incorporating risk management mechanisms, forming a comprehensive trend-following trading system. While it may generate false signals in ranging markets, the strategy's stability and profitability can be enhanced through proper parameter optimization and additional confirmatory indicators. Its core strengths lie in high automation and robust risk control, making it suitable as a foundation for medium to long-term trend-following strategies.
Source Pine Script
/*backtest
start: 2024-02-21 00:00:00
end: 2024-12-13 00:00:00
period: 1d
basePeriod: 1d
exchanges: [{"eid":"Binance","currency":"ETH_USDT"}]
*/

//@version=6
strategy("Moving Average Crossover with Stop Loss and Take Profit", overlay=true)

// Parameters for moving averages
short_length = input.int(9, title="Short Moving Average Length")  // Optimized for 15-minute time frame
long_length = input.int(21, title="Long Moving Average Length")   // Optimized for 15-minute time frame

// Parameters for risk management
stop_loss_percent = input.float(1.0, title="Stop Loss (%)") / 100  // 1% stop loss
take_profit_percent = input.float(1.0, title="Take Profit (%)") / 100  // 1% take profit

// Calculate moving averages
short_ma = ta.sma(close, short_length)
long_ma = ta.sma(close, long_length)

// Plot moving averages
plot(short_ma, color=color.blue, title="Short MA")
plot(long_ma, color=color.orange, title="Long MA")

// Entry and exit conditions
long_condition = ta.crossover(short_ma, long_ma)  // Golden Cross
short_condition = ta.crossunder(short_ma, long_ma)  // Death Cross

// Execute strategy with stop loss and take profit
if (long_condition)
    strategy.entry("Long", strategy.long)
    strategy.exit("Take Profit/Stop Loss", "Long", stop=strategy.position_avg_price * (1 - stop_loss_percent), limit=strategy.position_avg_price * (1 + take_profit_percent)  )

if (short_condition)
    strategy.close("Long")  // Close long position on Death Cross

// Plot Buy/Sell Signals
plotshape(series=long_condition, title="Buy Signal", location=location.belowbar, color=color.green, style=shape.labelup, text="BUY")
plotshape(series=short_condition, title="Sell Signal", location=location.abovebar, color=color.red, style=shape.labeldown, text="SELL")

// Draw 1% stop loss level as a transparent red rectangle
var float stop_loss_level = na
var float entry_price = na
if (strategy.position_size > 0)  // Only update when in a trade
    stop_loss_level := strategy.position_avg_price * (1 - stop_loss_percent)
    entry_price := strategy.position_avg_price

// Create transparent colors
transparent_red = color.new(color.black, 90)  // 90% transparency
transparent_green = color.new(color.green, 90)  // 90% transparency

// Plot stop loss and entry levels conditionally
plot(strategy.position_size > 0 ? stop_loss_level : na, color=transparent_red, title="Stop Loss Level", linewidth=1)
plot(strategy.position_size > 0 ? entry_price : na, color=transparent_green, title="Entry Price", linewidth=1)

// Fill the area between stop loss and entry price conditionally
fill( plot(strategy.position_size > 0 ? stop_loss_level : na),  plot(strategy.position_size > 0 ? entry_price : na),  color=transparent_red)
Published by ianzeng123 on the FMZ strategy square · last modified 2025-02-27. Collected in the Quant Trading Vault. Unvalidated research: re-test with your own data and costs before trusting it.
Build this with AgenKit
A spec is not a trading system. Paste this into your coding agent and AgenKit runs a specialist team — architecture, test-first build, risk gates, review — with paper trading on by default.
/agenkit build a production-grade trading bot with a backtest engine, risk controls and paper trading by default from strategies/Dual-Moving-Average-Trend-Trading-Strategy-with-Stop-Loss-and-Take-Profit.md- npx agenkit install engineering-kit in your project
- Paste the command into your agent and approve each phase
- Get tests, backtest, risk controls and a paper-trading switch
Understand it first
Before you run this, read the lesson behind the idea and how to backtest it honestly. Specs like this one are the survivors of an unknown number of trials; deflate their results accordingly.
Related specs
- Multi Factor Trend Tracking Dynamic Risk Management Stock Trading StrategyPine Script · Trend following · 1d
- Multi Timeframe Volume and Trend Confluence Trading StrategyPine Script · Trend following · 1d
- Multi Indicator Integrated Trend Following Trading StrategyPine Script · Trend following · 2m
- Dynamic Stop Loss and Take Profit System Based on EMA Crossover with RSI ADX and Volume ConfirmationPine Script · Trend following · 3h
- Multi Indicator Trend Following Strategy with ATR Dynamic Stop Loss Take ProfitPine Script · Trend following · 1d
- Fixed Range Volume Profile And Anchored VWAP Trend Identification Strategy With Dynamic Stop LossPine Script · Trend following · 1h