Dual SMA Momentum Strategy
The Double SMA Momentum Strategy is a trading strategy based on technical analysis that generates buy and sell signals based on two simple moving average (SMA) indicators. It is designed to capture the short to…
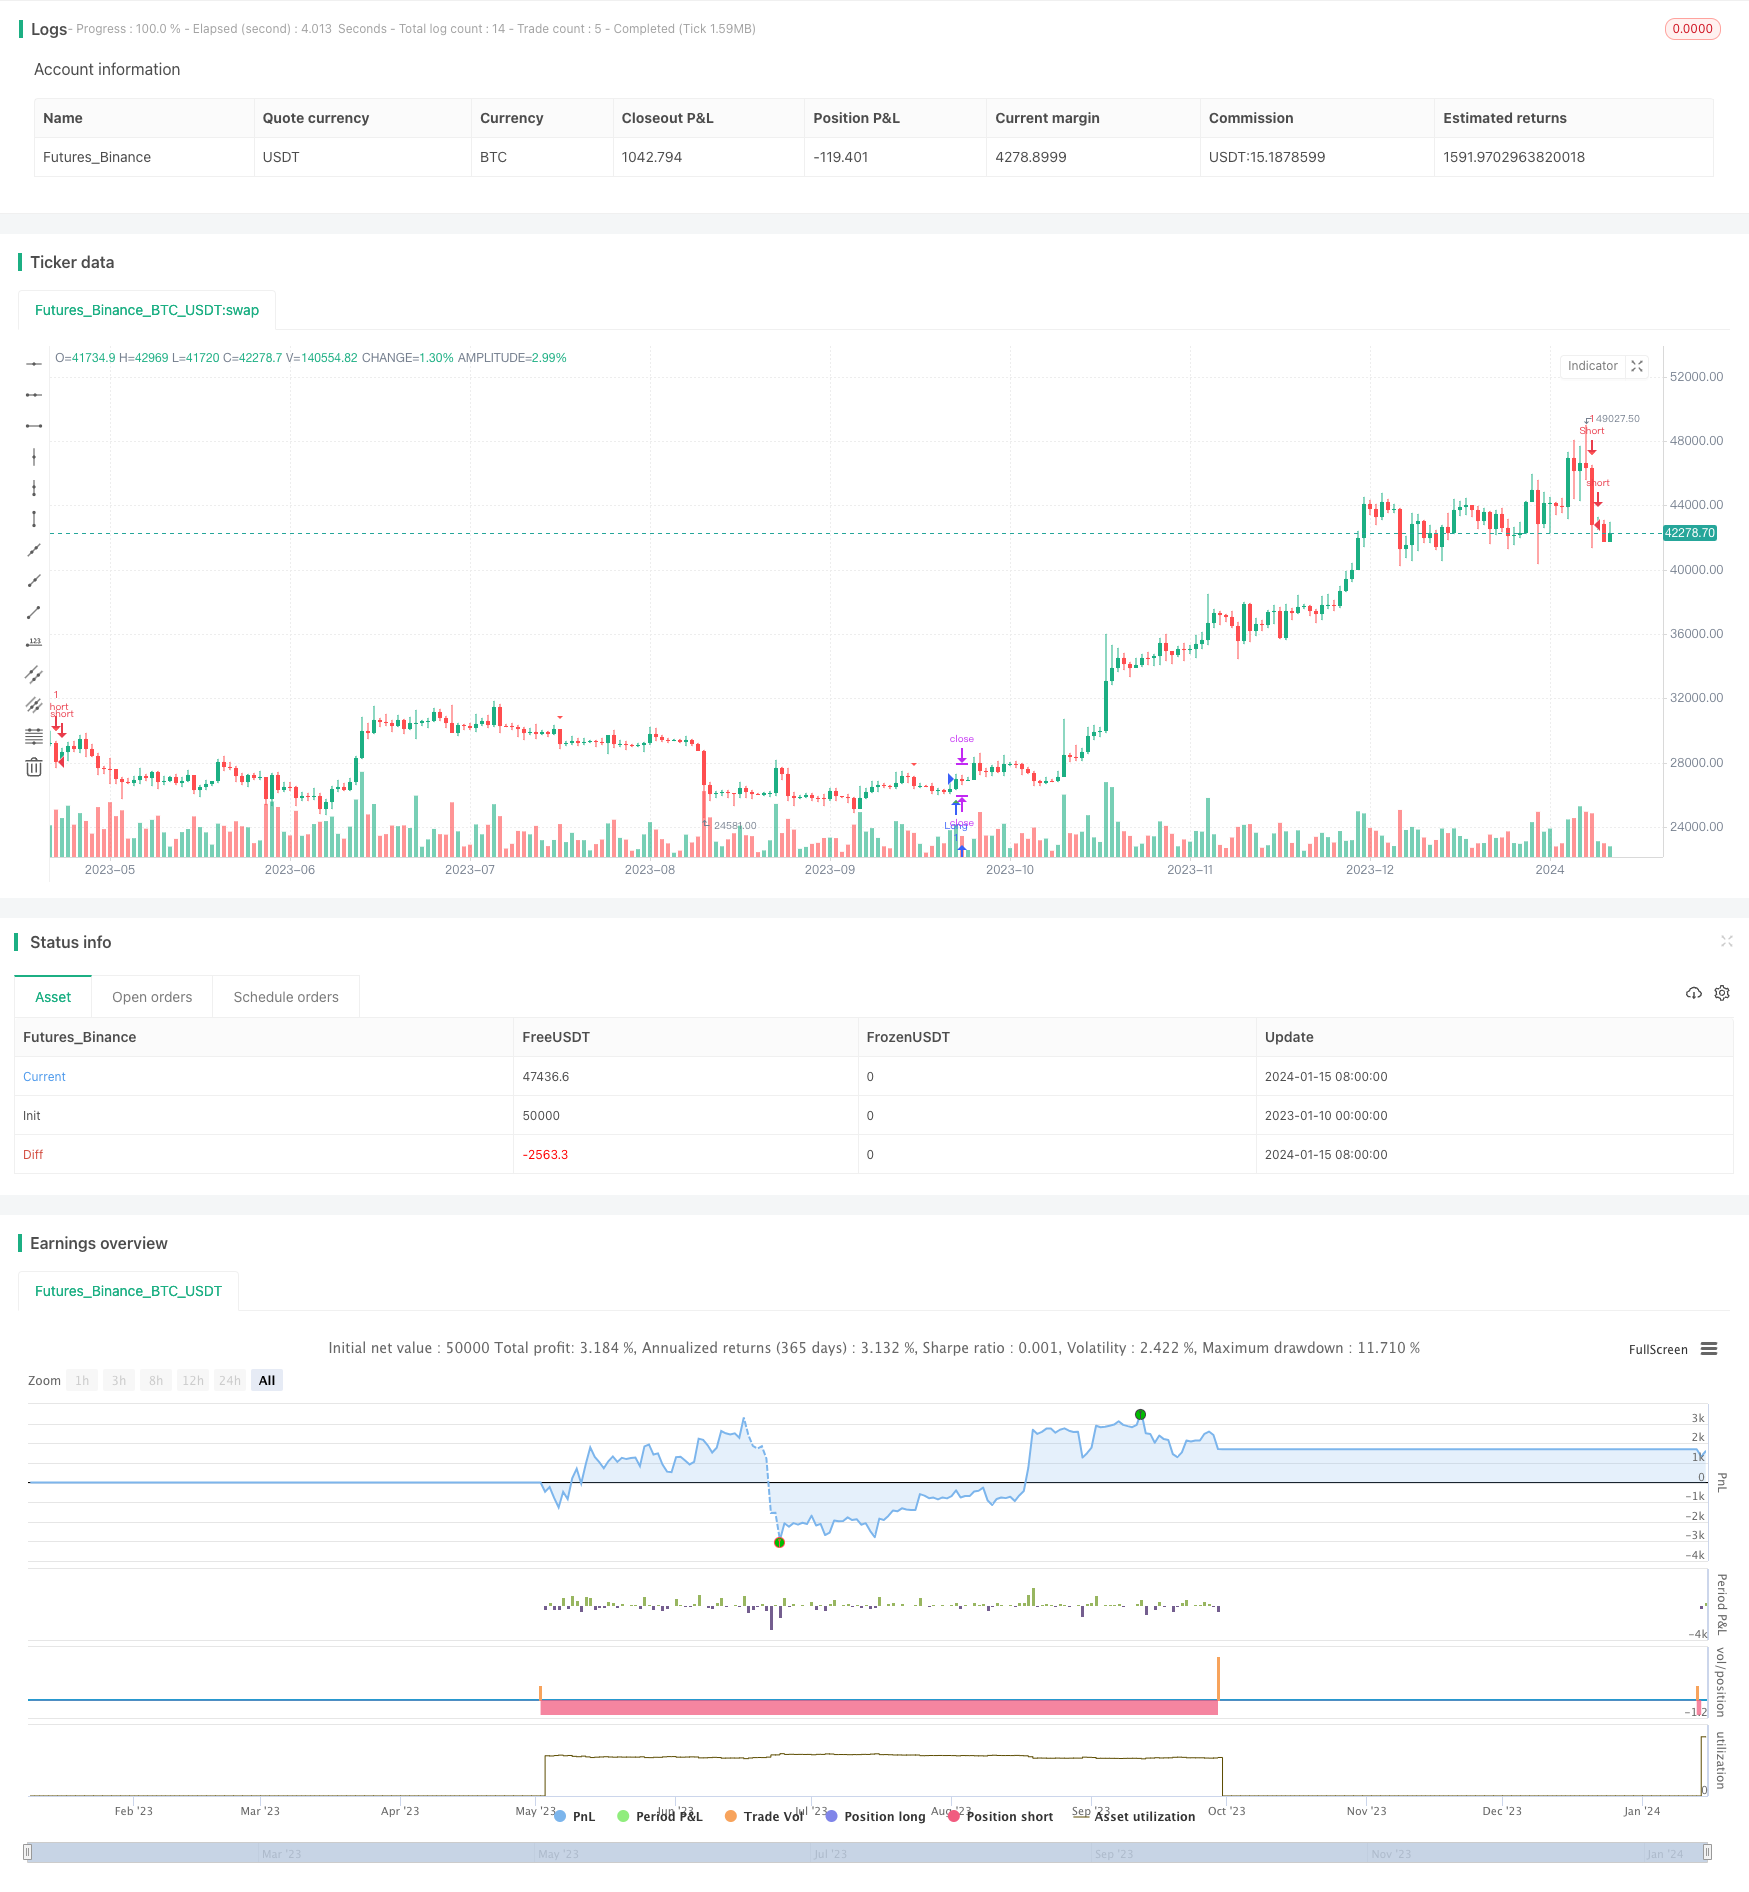
Overview
The Double SMA Momentum Strategy is a trading strategy based on technical analysis that generates buy and sell signals based on two simple moving average (SMA) indicators. It is designed to capture the short to medium term price momentum of a stock.
Strategy Logic
The strategy uses two SMA indicators, namely short and long time windows - Fast SMA (9 periods in length) and Slow SMA (45 periods in length)).
When the closing price of a stock breaks through the moving averages of the fast SMA and the slow SMA, it indicates the beginning of an upward trend. The strategy generates a long/buy signal at this time and enters a long position.
When the price falls below both SMAs, it indicates the beginning of a downtrend, at which point the strategy generates a short/sell signal and enters a short position.
Stop loss levels are dynamically set to the previous day's highest point (for short trades) and the previous day's lowest point (for long trades).).
Advantage Analysis
The main advantages of this strategy are::
- Use short-term and long-term SMAs together to capture newly emerging medium-term trends
- Placing an adaptive stop-loss can reduce risk and allow profits to continue running
- Easy to understand and implement
- Outstanding performance in trending market conditions
However, as with all technical analysis strategies, signals are frequently wrong in volatile markets. Can be improved by adding other indicators such as RSI for confirmation.
Risk Analysis
The main risks of this strategy are::
Vulnerable to shocks and wrong signals: Relying only on SMA crossovers, arbitrary signals may appear during consolidation or shock markets, bringing unnecessary transaction costs. This can be mitigated by combining with other indicators such as RSI.
vulnerable to sudden trend reversals: After entering the market, a rapid reversal may quickly hit the stop-loss. This risk can be reduced by optimizing the SMA length or adding other filters.
Risk of overfitting in parameter optimization: Extensive optimization of SMA length and other parameters may lead to poor real performance. Need for robust backtesting over long time horizons.
Optimization Direction
This strategy can be enhanced in the following ways:
- Add RSI and other indicators for additional confirmation to improve signal accuracy
- Use dynamic stop-loss methods such as ATR or hanging stop-loss to better adapt to market volatility
- Optimize SMA length based on historical volatility and trading time frame of different stocks
- Incorporate reasonable fund and position management rules to maximize returns and limit drawdowns
Summary
In summary, the dual SMA momentum strategy provides a direct way to capture short- to medium-term trends. Although its approach is basic, adding additional filters, dynamic stops, and careful optimization can help improve its risk-adjusted returns. Used selectively in rising and falling stock trends, it can capture profitable trends.
Parameters
| Name | Default | What it controls |
|---|---|---|
| v_input_1 | 9 | Fast SMA Length |
| v_input_2 | 45 | Slow SMA Length |
Source Pine Script
/*backtest
start: 2023-01-10 00:00:00
end: 2024-01-16 00:00:00
period: 1d
basePeriod: 1h
exchanges: [{"eid":"Futures_Binance","currency":"BTC_USDT"}]
*/

//@version=5
strategy("SMA Crossover Strategy", overlay=true)

// Input parameters
fast_length = input(9, title="Fast SMA Length")
slow_length = input(45, title="Slow SMA Length")

// Calculate moving averages
fast_sma = ta.sma(close, fast_length)
slow_sma = ta.sma(close, slow_length)

// Buy condition
buy_condition = ta.crossover(close, fast_sma) and ta.crossover(close, slow_sma)

// Sell condition
sell_condition = ta.crossunder(close, fast_sma) and ta.crossunder(close, slow_sma)

// Calculate stop loss levels
prev_low = request.security(syminfo.tickerid, "1D", low[1], lookahead=barmerge.lookahead_on)
prev_high = request.security(syminfo.tickerid, "1D", high[1], lookahead=barmerge.lookahead_on)

// Plot signals on the chart
plotshape(buy_condition, style=shape.triangleup, location=location.belowbar, color=color.green, size=size.small)
plotshape(sell_condition, style=shape.triangledown, location=location.abovebar, color=color.red, size=size.small)

// Strategy exit conditions
long_stop_loss = sell_condition ? prev_low : na
short_stop_loss = buy_condition ? prev_high : na

strategy.exit("Long Exit", from_entry="Long", when=sell_condition, stop=long_stop_loss)
strategy.exit("Short Exit", from_entry="Short", when=buy_condition, stop=short_stop_loss)

strategy.entry("Long", strategy.long, when=buy_condition)
strategy.entry("Short", strategy.short, when=sell_condition)
Published by ChaoZhang on the FMZ strategy square · last modified 2024-01-17. Collected in the Quant Trading Vault. Unvalidated research: re-test with your own data and costs before trusting it.
Build this with AgenKit
A spec is not a trading system. Paste this into your coding agent and AgenKit runs a specialist team — architecture, test-first build, risk gates, review — with paper trading on by default.
/agenkit build a production-grade trading bot with a backtest engine, risk controls and paper trading by default from strategies/Dual-SMA-Momentum-Strategy.md- npx agenkit install engineering-kit in your project
- Paste the command into your agent and approve each phase
- Get tests, backtest, risk controls and a paper-trading switch
Understand it first
Before you run this, read the lesson behind the idea and how to backtest it honestly. Specs like this one are the survivors of an unknown number of trials; deflate their results accordingly.
Related specs
- KST EMA Momentum Trend Following StrategyPine Script · Momentum · 1d
- Multi EMA Trend Momentum Trading Strategy with Risk Management SystemPine Script · Momentum · 1h
- Multi Indicator Trend Momentum Trading Strategy with Dynamic Risk Management SystemPine Script · Momentum · 1h
- Multi Indicator Dynamic Momentum Cross StrategyPine Script · Momentum · 1d
- Multi Indicator Trend Momentum Trading Strategy An Optimized Quantitative Trading System Based on Bollinger Bands Fibonacci and ATRPine Script · Momentum · 1h
- Multi Period Moving Average and RSI Momentum Cross Trend Following StrategyPine Script · Momentum · 1d