Strategy vault / Trend following
Dual Take Profit Dual Stop Loss Trailing Stop Loss Bitcoin Quantitative Strategy
This is a Bitcoin quantitative trading strategy based on dual take profit, dual stop loss and trailing stop loss. It uses EMA and WMA crossover as entry signals, adopts dual take profit and dual stop loss risk…
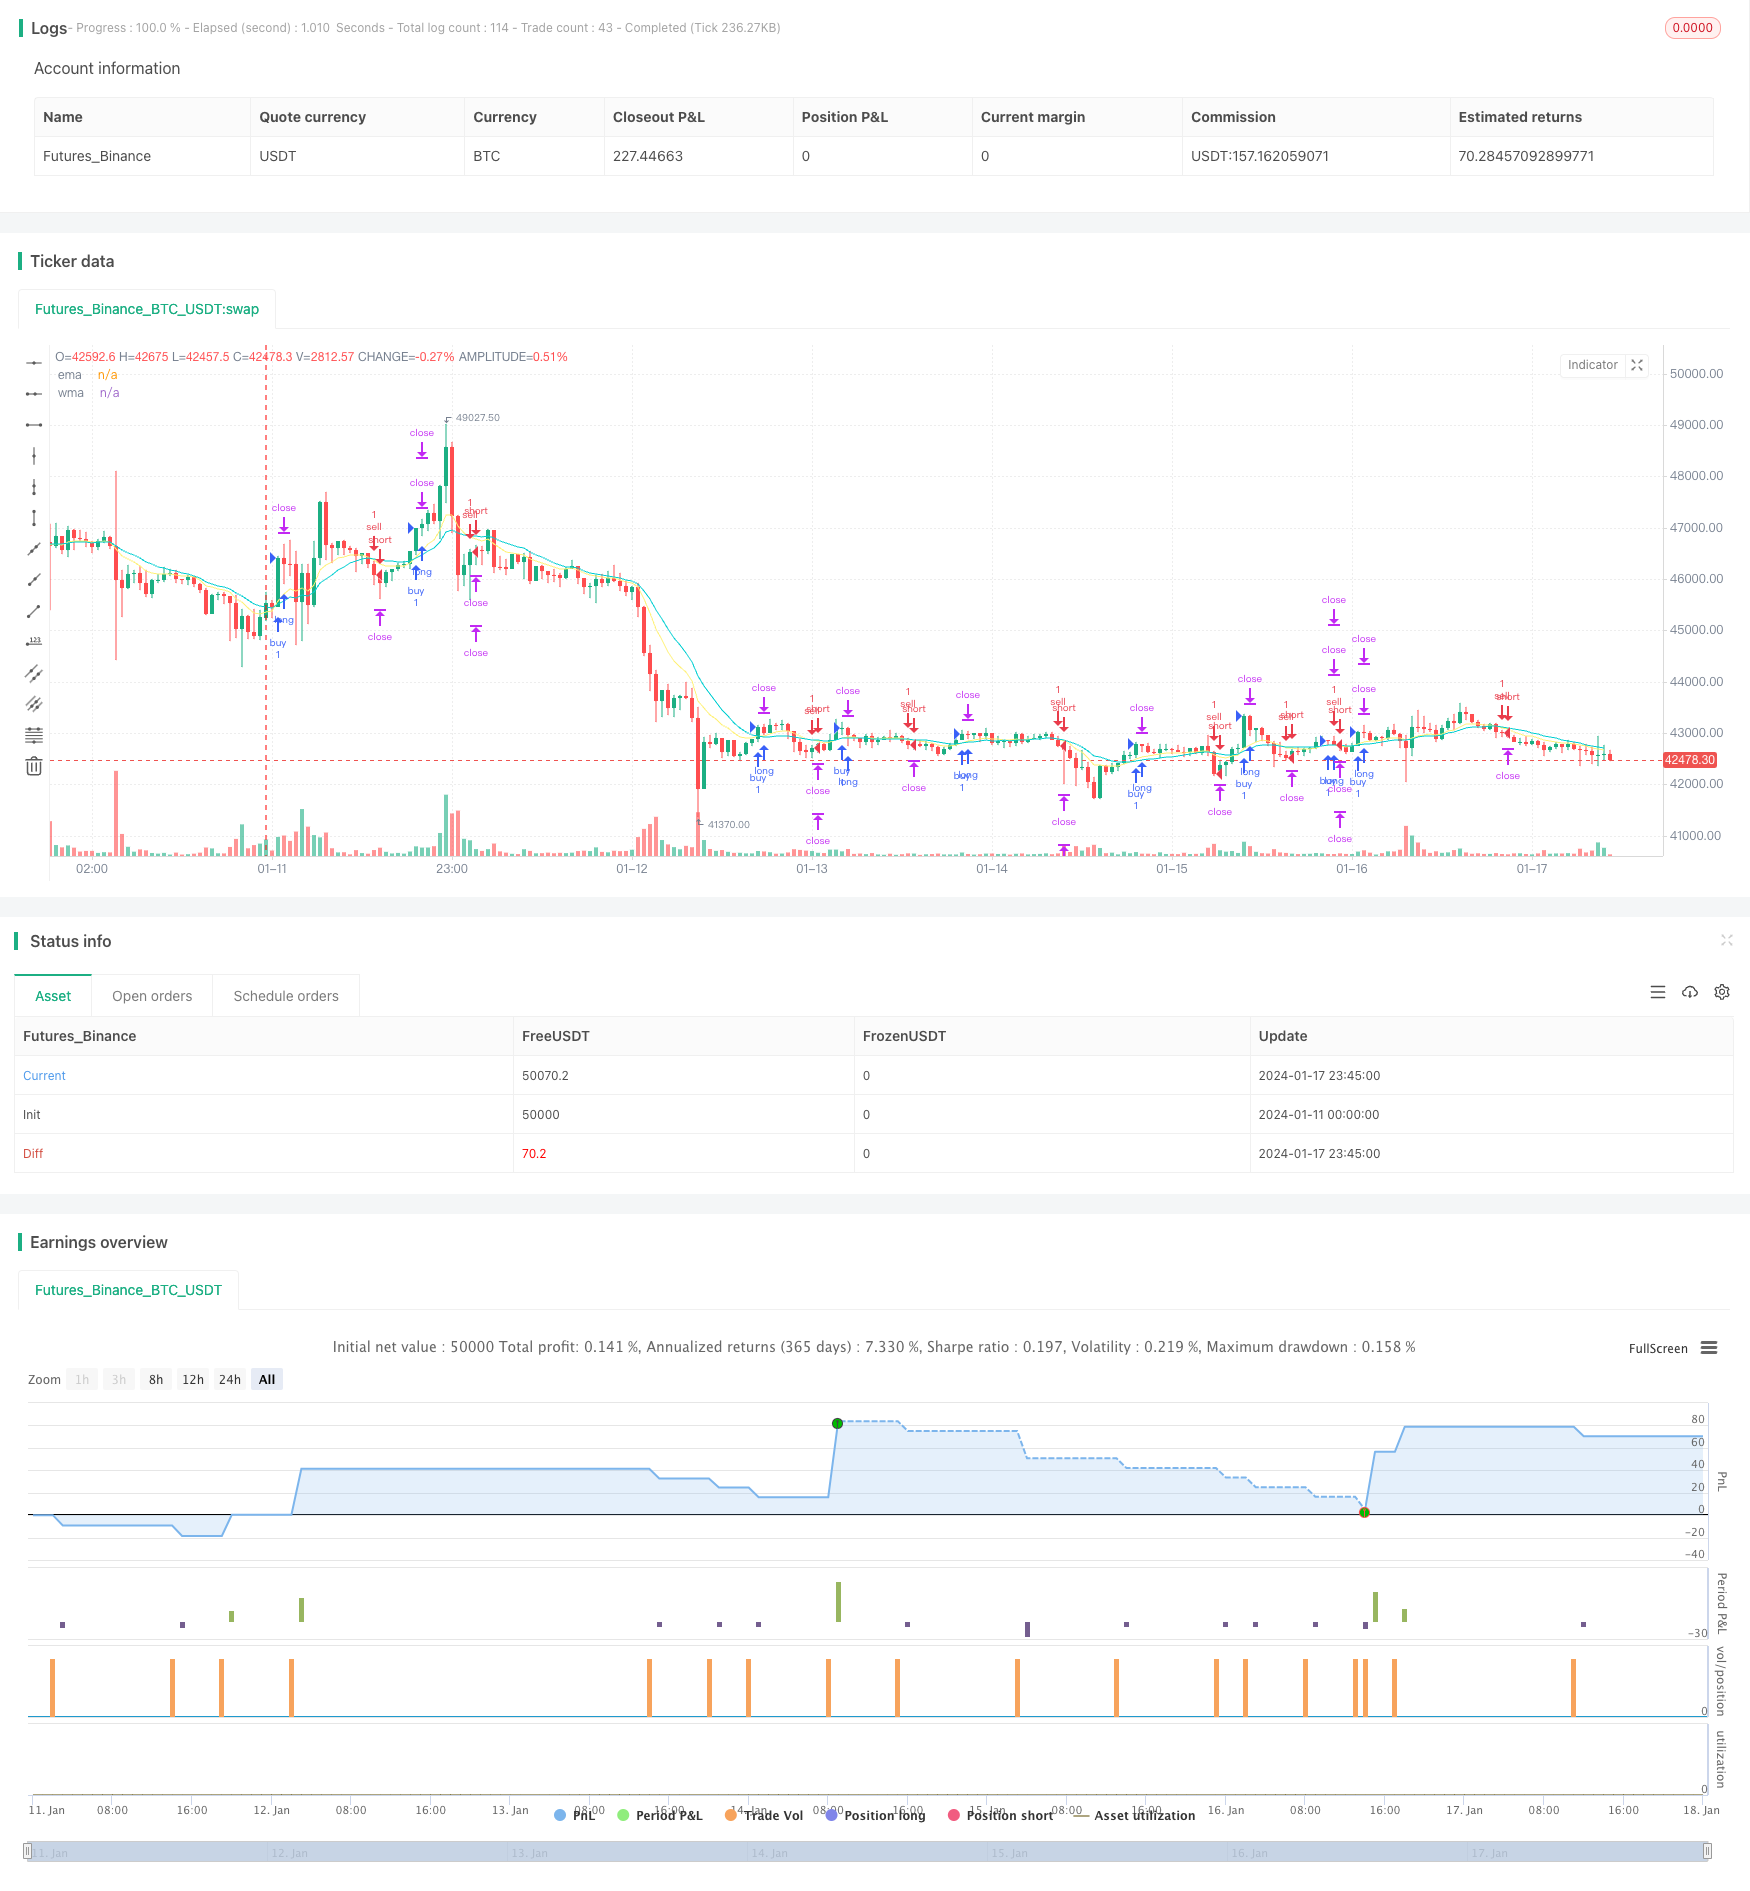
Overview
This is a Bitcoin quantitative trading strategy based on dual take profit, dual stop loss and trailing stop loss. It uses EMA and WMA crossover as entry signals, adopts dual take profit and dual stop loss risk management methodology, and applies trailing stop loss after the first take profit is achieved to lock in partial profits while seeking greater profits.
Strategy Logic
Long entry when EMA crosses over WMA from below, and short entry when EMA crosses under WMA from above.
On the profit side, there are two take profit targets. The first take profit is set at 20 pips above the entry price, and the second take profit is set at 40 pips above the entry price.
On the stop loss side, there are also two stop losses. The first stop loss is set at 20 pips below the entry price, and the second stop loss is set at the entry price itself.
When the first take profit is triggered, 50% of the position will be closed, and stop loss will be trailed to the entry price to lock in profits, while seeking for greater profits from the second take profit target.
As such, there can be three possible outcomes for each trade:
- Price hits stop loss first, lose 2% capital.
- Price hits first take profit first for 1% profit, then hits second stop loss, end up with 1% profit.
- Price hits first take profit first for 1% profit, continues to run and hits second take profit, end up with 3% profit.
Advantage Analysis
The biggest advantage of this strategy lies in its risk management methodology. By setting dual take profits and dual stop losses, it can lock in partial profits after the first take profit is achieved, while continuing to seek greater profits. This can significantly improve the profitability.
Another advantage is that by dividing a single trade into three possible outcomes, it lowers the probability of maximum loss, making the overall returns more consistent. Typical strategies have only two outcomes - either hit 2% stop loss or win more than 2%. This strategy has three outcomes - lose 2%, win 1%, and win 3%, which also better controls the tail risks.
Risk Analysis
The main risks of this strategy come from the stop loss setting. If the stop loss distance is too wide, it may result in oversized single trade loss. If the stop loss distance is too tight, it may get stopped out prematurely by market noises. Proper stop loss distance needs to be set based on the characteristics and volatility of different trading instruments.
Another risk is the remaining position after first take profit still carries loss risks. If the subsequent loss exceeds the first take profit, it will offset parts or all of the realized profits. This needs to be addressed by strictly trailing the stop loss to protect profits locked.
Optimization Directions
The following areas can be optimized for the strategy:
Test different parameter combinations to find optimum parameters, such as testing 15 pips, 25 pips take profit/stop loss distances.
Try other technical indicator combinations for entry signals, such as KDJ, MACD crossover.
Optimize percentage of position closed at first take profit, such as 50% may not be optimal, 30% or 70% could perform better potentially.
Test different settings for trailing stop loss speed to balance locking in profits and giving prices enough room to fluctuate.
Conclusion
In conclusion, this is an overall robust strategy, which can significantly improve profitability and reduce tail risks through the dual take profit, dual stop loss and trailing stop loss mechanisms. There is also ample room for optimization via parameter tuning and technical indicator engineering to achieve even better performance. It is suitable for investors who pursue high and steady investment gains.
Parameters
| Name | Default | What it controls |
|---|---|---|
| v_input_1 | true | Buy |
| v_input_2 | true | Sell |
| v_input_3 | 2020 | Start year |
| v_input_4 | true | Start month |
| v_input_5 | true | Start day |
| v_input_6 | false | Start hour |
| v_input_7 | false | Start minute |
| v_input_8 | false | set end time? |
| v_input_9 | 2019 | end year |
| v_input_10 | 12 | end month |
| v_input_11 | 31 | end day |
| v_input_12 | 23 | end hour |
| v_input_13 | 59 | end minute |
| v_input_14 | 10 | EMA period |
| v_input_15 | 20 | WMA period |
| v_input_16 | 20 | pip |
Source Pine Script
/*backtest
start: 2024-01-11 00:00:00
end: 2024-01-18 00:00:00
period: 45m
basePeriod: 5m
exchanges: [{"eid":"Futures_Binance","currency":"BTC_USDT"}]
*/

//@version=4
strategy("SL1 Pips after TP1 (MA)", commission_type=strategy.commission.cash_per_order, overlay=true)

// Strategy
Buy  = input(true)
Sell = input(true)

// Date Range
start_year    = input(title='Start year'   ,defval=2020)
start_month   = input(title='Start month'  ,defval=1)
start_day     = input(title='Start day'    ,defval=1)
start_hour    = input(title='Start hour'   ,defval=0)
start_minute  = input(title='Start minute' ,defval=0)
end_time      = input(title='set end time?',defval=false)
end_year      = input(title='end year'     ,defval=2019)
end_month     = input(title='end month'    ,defval=12)
end_day       = input(title='end day'      ,defval=31)
end_hour      = input(title='end hour'     ,defval=23)
end_minute    = input(title='end minute'   ,defval=59)

// MA
ema_period = input(title='EMA period',defval=10)
wma_period = input(title='WMA period',defval=20)
ema        = ema(close,ema_period)
wma        = wma(close,wma_period)

// Entry Condition
buy =
 crossover(ema,wma) and
 nz(strategy.position_size) == 0 and Buy

sell =
 crossunder(ema,wma) and
 nz(strategy.position_size) == 0 and Sell

// Pips
pip = input(20)*10*syminfo.mintick

// Trading parameters //
var bool  LS  = na
var bool  SS  = na
var float EP  = na
var float TVL = na
var float TVS = na
var float TSL = na
var float TSS = na
var float TP1 = na
var float TP2 = na
var float SL1 = na
var float SL2 = na

if buy or sell and strategy.position_size == 0
    EP  := close
    SL1 := EP - pip     * (sell?-1:1)
    SL2 := EP - pip     * (sell?-1:1)
    TP1 := EP + pip     * (sell?-1:1)
    TP2 := EP + pip * 2 * (sell?-1:1)

// current trade direction
LS := buy  or strategy.position_size > 0
SS := sell or strategy.position_size < 0

// adjust trade parameters and trailing stop calculations
TVL := max(TP1,open) - pip[1]
TVS := min(TP1,open) + pip[1]
TSL := open[1] > TSL[1] ? max(TVL,TSL[1]):TVL
TSS := open[1] < TSS[1] ? min(TVS,TSS[1]):TVS

if LS and high > TP1
    if open <= TP1
        SL2:=min(EP,TSL)

if SS and low < TP1
    if open >= TP1
        SL2:=max(EP,TSS)

// Closing conditions
close_long  = LS and open < SL2
close_short = SS and open > SL2

// Buy
strategy.entry("buy"  , strategy.long, when=buy and not SS)
strategy.exit ("exit1", from_entry="buy", stop=SL1, limit=TP1, qty_percent=1)
strategy.exit ("exit2", from_entry="buy", stop=SL2, limit=TP2)

// Sell
strategy.entry("sell" , strategy.short, when=sell and not LS)
strategy.exit ("exit3", from_entry="sell", stop=SL1, limit=TP1, qty_percent=1)
strategy.exit ("exit4", from_entry="sell", stop=SL2, limit=TP2)

// Plots
a=plot(strategy.position_size >  0 ? SL1 : na, color=#dc143c, style=plot.style_linebr)
b=plot(strategy.position_size <  0 ? SL1 : na, color=#dc143c, style=plot.style_linebr)
c=plot(strategy.position_size >  0 ? TP1 : na, color=#00ced1, style=plot.style_linebr)
d=plot(strategy.position_size <  0 ? TP1 : na, color=#00ced1, style=plot.style_linebr)
e=plot(strategy.position_size >  0 ? TP2 : na, color=#00ced1, style=plot.style_linebr)
f=plot(strategy.position_size <  0 ? TP2 : na, color=#00ced1, style=plot.style_linebr)
g=plot(strategy.position_size >= 0 ? na  : EP, color=#ffffff, style=plot.style_linebr)
h=plot(strategy.position_size <= 0 ? na  : EP, color=#ffffff, style=plot.style_linebr)

plot(ema,title="ema",color=#fff176)
plot(wma,title="wma",color=#00ced1)
Published by ChaoZhang on the FMZ strategy square · last modified 2024-01-19. Collected in the Quant Trading Vault. Unvalidated research: re-test with your own data and costs before trusting it.
Build this with AgenKit
A spec is not a trading system. Paste this into your coding agent and AgenKit runs a specialist team — architecture, test-first build, risk gates, review — with paper trading on by default.
/agenkit build a production-grade trading bot with a backtest engine, risk controls and paper trading by default from strategies/Dual-Take-Profit-Dual-Stop-Loss-Trailing-Stop-Loss-Bitcoin-Quantitative-Strategy.md- npx agenkit install engineering-kit in your project
- Paste the command into your agent and approve each phase
- Get tests, backtest, risk controls and a paper-trading switch
Understand it first
Before you run this, read the lesson behind the idea and how to backtest it honestly. Specs like this one are the survivors of an unknown number of trials; deflate their results accordingly.
Related specs
- 200 EMA VWAP MFI Trend Following StrategyPine Script · Trend following · 1d
- 4 EMA Trend StrategyPine Script · Trend following · 1d
- ADX MA and EMA Long Only Trend Tracking StrategyPine Script · Trend following · 1d
- ATR Dynamic Trend Following and EMA Crossover Trading StrategyPine Script · Trend following · 1d
- ATR and Moving Average Crossover Hybrid StrategyPine Script · Trend following · 1h
- ATR and T3 Moving Average StrategyPine Script · Trend following · 5m