Strategy vault / Trend following
Dual Timeframe DI Trend Following Strategy
This strategy uses Average Directional Index (DI+) and Negative Directional Index (DI-) on two timeframes to determine the trend direction for long and short trades. When DI+ is higher than DI- on both larger and…
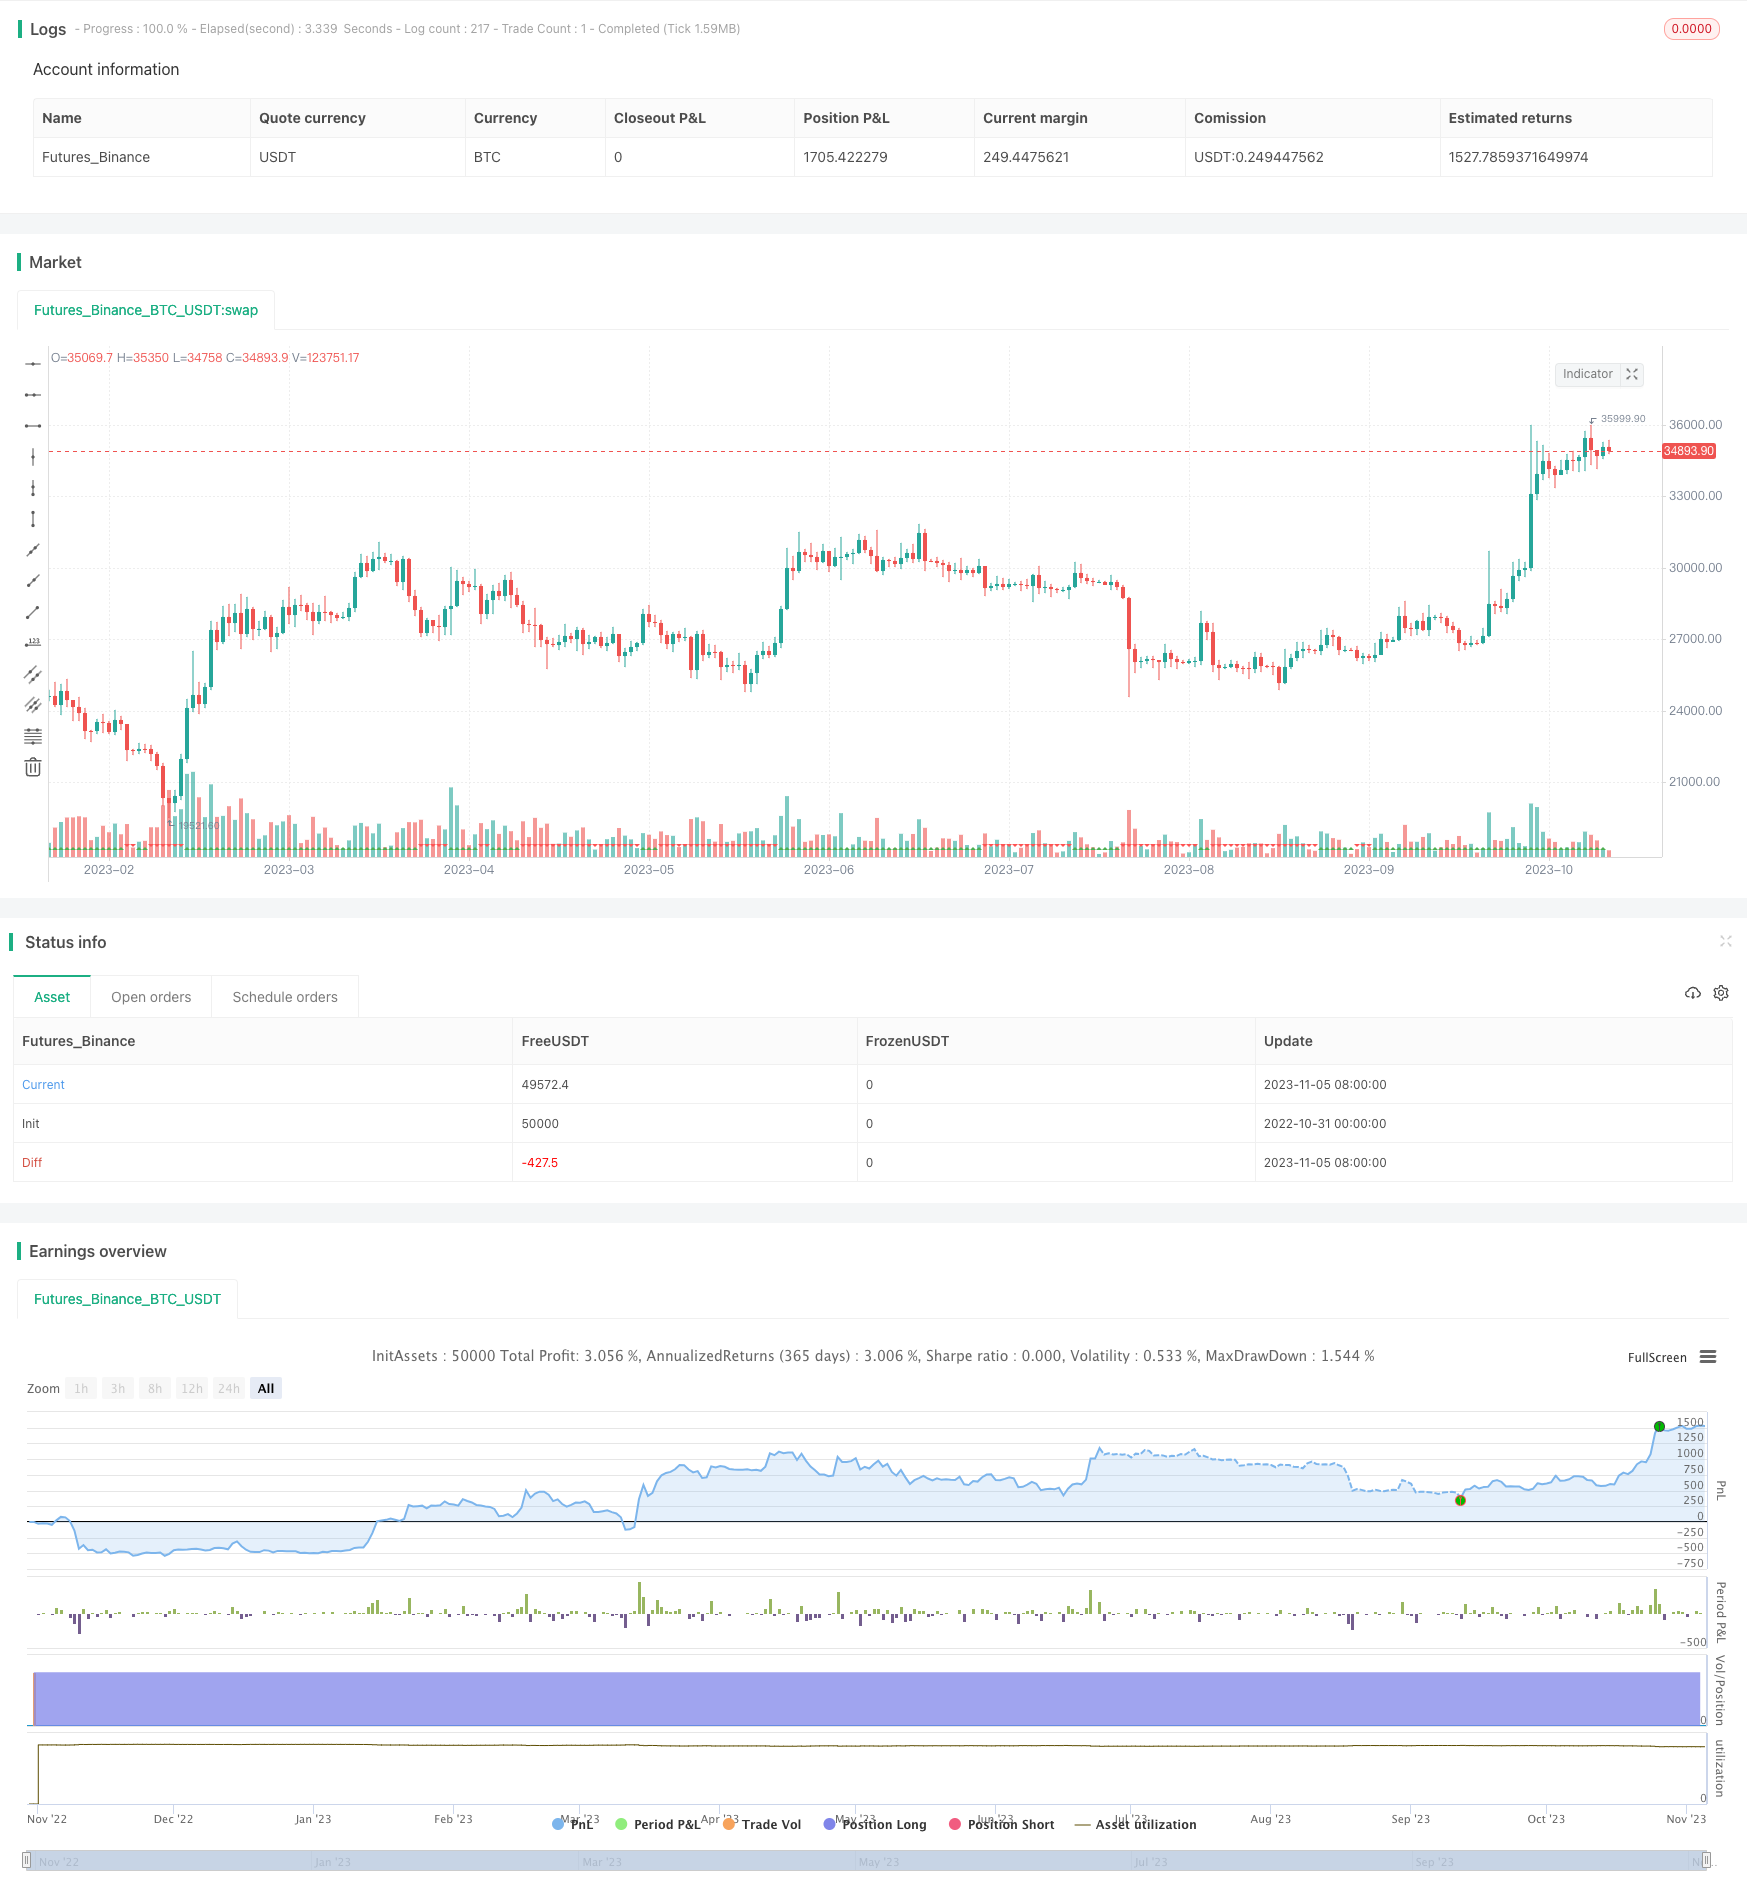
Overview
This strategy uses Average Directional Index (DI+) and Negative Directional Index (DI-) on two timeframes to determine the trend direction for long and short trades. When DI+ is higher than DI- on both larger and smaller timeframes, it indicates an upward trend and a long signal is triggered. When DI- is higher than DI+ on both frames, it indicates a downward trend and a short signal is triggered.
How it Works
The strategy is based on several principles:
Calculate DI+ and DI-. Get DI+ and DI- by using high, close and low prices.
Compare DI+ and DI- on two timeframes. Calculate DI+ and DI- respectively on the main chart timeframe (e.g. 1 hour) and a larger timeframe (e.g. daily). Compare the values between the two timeframes.
Determine trend direction. When DI+ is greater than DI- on both larger and smaller timeframes, it indicates an upward trend. When DI- is greater than DI+ on both frames, it indicates a downward trend.
Trigger trading signals. DI+>DI- on both frames gives long signal. DI->DI+ on both frames gives short signal.
Set stop loss. Use ATR to calculate dynamic stop loss for trend following.
Exit conditions. Exit when stop loss is hit or price reverses.
Advantages
The strategy has the following advantages:
Using dual timeframe DI filters out some false breakouts.
ATR trailing stop maximizes profit protection and avoids stops being too tight.
Timely stop loss controls loss on single trades.
Trading with the trend allows continuously catching trends.
Simple and clear rules, easy to implement for live trading.
Risks and Solutions
There are also several risks:
DI has lagging effect, may miss entry timing. Can optimize parameters or add other indicators.
Dual timeframe may have divergence between larger and smaller TF. Add more timeframe validation.
Stop loss too aggressive may cause over-trading. Loosen ATR multiplier.
Whipsaw in sideways market can cause frequent trades. Add filters to reduce trading frequency.
Parameter optimization relies on historical data and may be overfitted. Evaluate parameter robustness prudently.
Optimization Directions
The strategy can be improved in the following aspects:
Optimize DI calculation parameters for best parameter set.
Add other indicator filters to improve signal accuracy, e.g. MACD, KDJ etc.
Enhance stop loss strategy to adapt more market conditions, such as trailing stop or pending orders.
Add trading session filters to avoid significant news events.
Test parameter robustness on different products to improve adaptiveness.
Introduce machine learning to train model on historical data.
Conclusion
In summary, this is a typical trend following strategy that uses DI to determine trend direction and set stop loss to lock in profits along the trend. The advantage lies in its clear logic and ease of implementation for live trading. There are also rooms for improvement via parameter optimization, adding filters etc. With further optimization and robustness test, it can become a very practical trend following strategy.
Parameters
| Name | Default | What it controls |
|---|---|---|
| v_input_1 | 14 | (?Directional IndicatorDI+ DI-)adx_len |
| v_input_timeframe_1 | DI +/- in Timeframe 1 | |
| v_input_timeframe_2 | 1D | DI +/- in Timeframe 2 |
| v_input_string_1 | Long entered | (?Alerts)Alert MSG for buying (Long position) |
| v_input_string_2 | Long closed | Alert MSG for closing (Long position) |
| v_input_2 | timestamp(01 Apr 2020 13:30 +0000) | (?Time horizon of backtests)Backtest Start Time |
| v_input_float_1 | 2 | (?Stop loss)ATR Multiplier for trailing stoploss |
| v_input_int_1 | 14 | Length of ATR for trailing stoploss |
Source Pine Script
/*backtest
start: 2022-10-31 00:00:00
end: 2023-11-06 00:00:00
period: 1d
basePeriod: 1h
exchanges: [{"eid":"Futures_Binance","currency":"BTC_USDT"}]
*/

// This source code is subject to the terms of the Mozilla Public License 2.0 at https://mozilla.org/MPL/2.0/
// © DojiEmoji

//@version=5
strategy("DI+/- multi TF Strat [KL]", overlay=true, pyramiding=1, initial_capital=1000000000, default_qty_type=strategy.percent_of_equity, default_qty_value=5)
var string GROUP_ALERT    = "Alerts"
var string GROUP_SL       = "Stop loss"
var string GROUP_ORDER    = "Order size"
var string GROUP_TP       = "Profit taking"
var string GROUP_HORIZON  = "Time horizon of backtests"
var string GROUP_IND      = "Directional IndicatorDI+ DI-"

// ADX Indicator {
adx_len = input(14, group=GROUP_IND, tooltip="Typically 14")
tf1 = input.timeframe("", title="DI +/- in Timeframe 1", group=GROUP_IND, tooltip="Main: DI+ > DI-")
tf2 = input.timeframe("1D", title="DI +/- in Timeframe 2", group=GROUP_IND, tooltip="Confirmation: DI+ > DI-")
// adx_thres = input(20, group=GROUP_IND)   //threshold not used in this strategy

get_ADX(_high, _close, _low) =>
// (high, close, mid) -> [plus_DM, minus_DM]
    // Based on TradingView user BeikabuOyaji's implementation
    _tr = math.max(math.max(_high - _low, math.abs(_high - nz(_close[1]))), math.abs(_low - nz(_close[1])))
    smooth_tr = 0.0
    smooth_tr := nz(smooth_tr[1]) - nz(smooth_tr[1]) / adx_len + _tr

    smooth_directional_mov_plus = 0.0
    smooth_directional_mov_plus := nz(smooth_directional_mov_plus[1]) - nz(smooth_directional_mov_plus[1]) / adx_len + (_high - nz(_high[1]) > nz(_low[1]) - _low ? math.max(_high - nz(_high[1]), 0) : 0)

    smooth_directional_mov_minus = 0.0
    smooth_directional_mov_minus := nz(smooth_directional_mov_minus[1]) - nz(smooth_directional_mov_minus[1]) / adx_len + (nz(_low[1]) - _low > _high - nz(_high[1]) ? math.max(nz(_low[1]) - _low, 0) : 0)

    plus_DM = smooth_directional_mov_plus / smooth_tr * 100
    minus_DM = smooth_directional_mov_minus / smooth_tr * 100
    // DX = math.abs(plus_DM - minus_DM) / (plus_DM + minus_DM) * 100   // DX not used in this strategy
    [plus_DM, minus_DM]

// DI +/- from timeframes 1 and 2
[plus_DM_tf1, minus_DM_tf1] = get_ADX(request.security(syminfo.tickerid, tf1, high), request.security(syminfo.tickerid, tf1, close),request.security(syminfo.tickerid, tf1, low))
[plus_DM_tf2, minus_DM_tf2] = get_ADX(request.security(syminfo.tickerid, tf2, high),request.security(syminfo.tickerid, tf2, close),request.security(syminfo.tickerid, tf2, low))
// } end of block: ADX Indicator


var string ENUM_LONG      = "LONG"
var string LONG_MSG_ENTER = input.string("Long entered", title="Alert MSG for buying (Long position)", group=GROUP_ALERT)
var string LONG_MSG_EXIT  = input.string("Long closed", title="Alert MSG for closing (Long position)", group=GROUP_ALERT)
backtest_timeframe_start = input(defval=timestamp("01 Apr 2020 13:30 +0000"), title="Backtest Start Time", group=GROUP_HORIZON)
within_timeframe         = true

// Signals for entry
_uptrend_confirmed = plus_DM_tf1 > minus_DM_tf1 and plus_DM_tf2 > minus_DM_tf2
entry_signal_long = _uptrend_confirmed

plotshape(_uptrend_confirmed, style=shape.triangleup, location=location.bottom, color=color.green)
plotshape(not _uptrend_confirmed, style=shape.triangledown, location=location.bottom, color=color.red)

// Trailing stop loss ("TSL") {
tsl_multi                 = input.float(2.0, title="ATR Multiplier for trailing stoploss", group=GROUP_SL)
SL_buffer                 = ta.atr(input.int(14, title="Length of ATR for trailing stoploss", group=GROUP_SL)) * tsl_multi
TSL_source_long           = low
var stop_loss_price_long  = float(0)
var pos_opened_long       = false

stop_loss_price_long := pos_opened_long ? math.max(stop_loss_price_long, TSL_source_long - SL_buffer) : TSL_source_long - SL_buffer

// MAIN: {
if pos_opened_long and TSL_source_long <= stop_loss_price_long
    pos_opened_long := false
    alert(LONG_MSG_EXIT, alert.freq_once_per_bar)
    strategy.close(ENUM_LONG, comment=close < strategy.position_avg_price ? "stop loss" : "take profit")

// (2) Update the stoploss to latest trailing amt.
if pos_opened_long
    strategy.exit(ENUM_LONG, stop=stop_loss_price_long, comment="SL")

// (3) INITIAL ENTRY:
if within_timeframe and entry_signal_long
    pos_opened_long := true
    alert(LONG_MSG_ENTER, alert.freq_once_per_bar)
    strategy.entry(ENUM_LONG, strategy.long, comment="long")

// Plotting:
TSL_transp_long = pos_opened_long and within_timeframe ? 0 : 100
plot(stop_loss_price_long, color=color.new(color.green, TSL_transp_long))

// CLEAN UP: Setting variables back to default values once no longer in use
if ta.change(strategy.position_size) and strategy.position_size == 0
    pos_opened_long := false

if not pos_opened_long
    stop_loss_price_long := float(0)

// } end of MAIN block
Published by ChaoZhang on the FMZ strategy square · last modified 2023-11-07. Collected in the Quant Trading Vault. Unvalidated research: re-test with your own data and costs before trusting it.
Build this with AgenKit
A spec is not a trading system. Paste this into your coding agent and AgenKit runs a specialist team — architecture, test-first build, risk gates, review — with paper trading on by default.
/agenkit build a production-grade trading bot with a backtest engine, risk controls and paper trading by default from strategies/Dual-Timeframe-DI-Trend-Following-Strategy.md- npx agenkit install engineering-kit in your project
- Paste the command into your agent and approve each phase
- Get tests, backtest, risk controls and a paper-trading switch
Understand it first
Before you run this, read the lesson behind the idea and how to backtest it honestly. Specs like this one are the survivors of an unknown number of trials; deflate their results accordingly.
Related specs
- Extreme version of Noros Trend Moving Averages StrategyPine Script · Trend following · 1h
- Multi Dimensional Short Term Trend Predictor Technical Analysis and Volatility Adaptive Trading StrategyPine Script · Trend following · 1h
- Multi Indicator Dynamic Trend Following Strategy Based on EMA and SMAPine Script · Trend following · 1d
- Advanced Quantitative Trading Strategy Multi Dimensional Super Trend ATR Dynamic Tracking SystemPine Script · Trend following · 1h
- Dual EMA Crossover Trend Following Strategy with ATR and ADX FiltersPine Script · Trend following · 1d
- Dynamic Trend Identification Strategy with Exponential Moving Average and Adaptive Volatility ThresholdPine Script · Trend following · 1h