Dual Timeframe Momentum Strategy
This strategy is a dual timeframe momentum strategy. It determines the trend direction on the higher timeframe using a Simple Moving Average (SMA) and identifies reversal points on the lower timeframe using pivot…
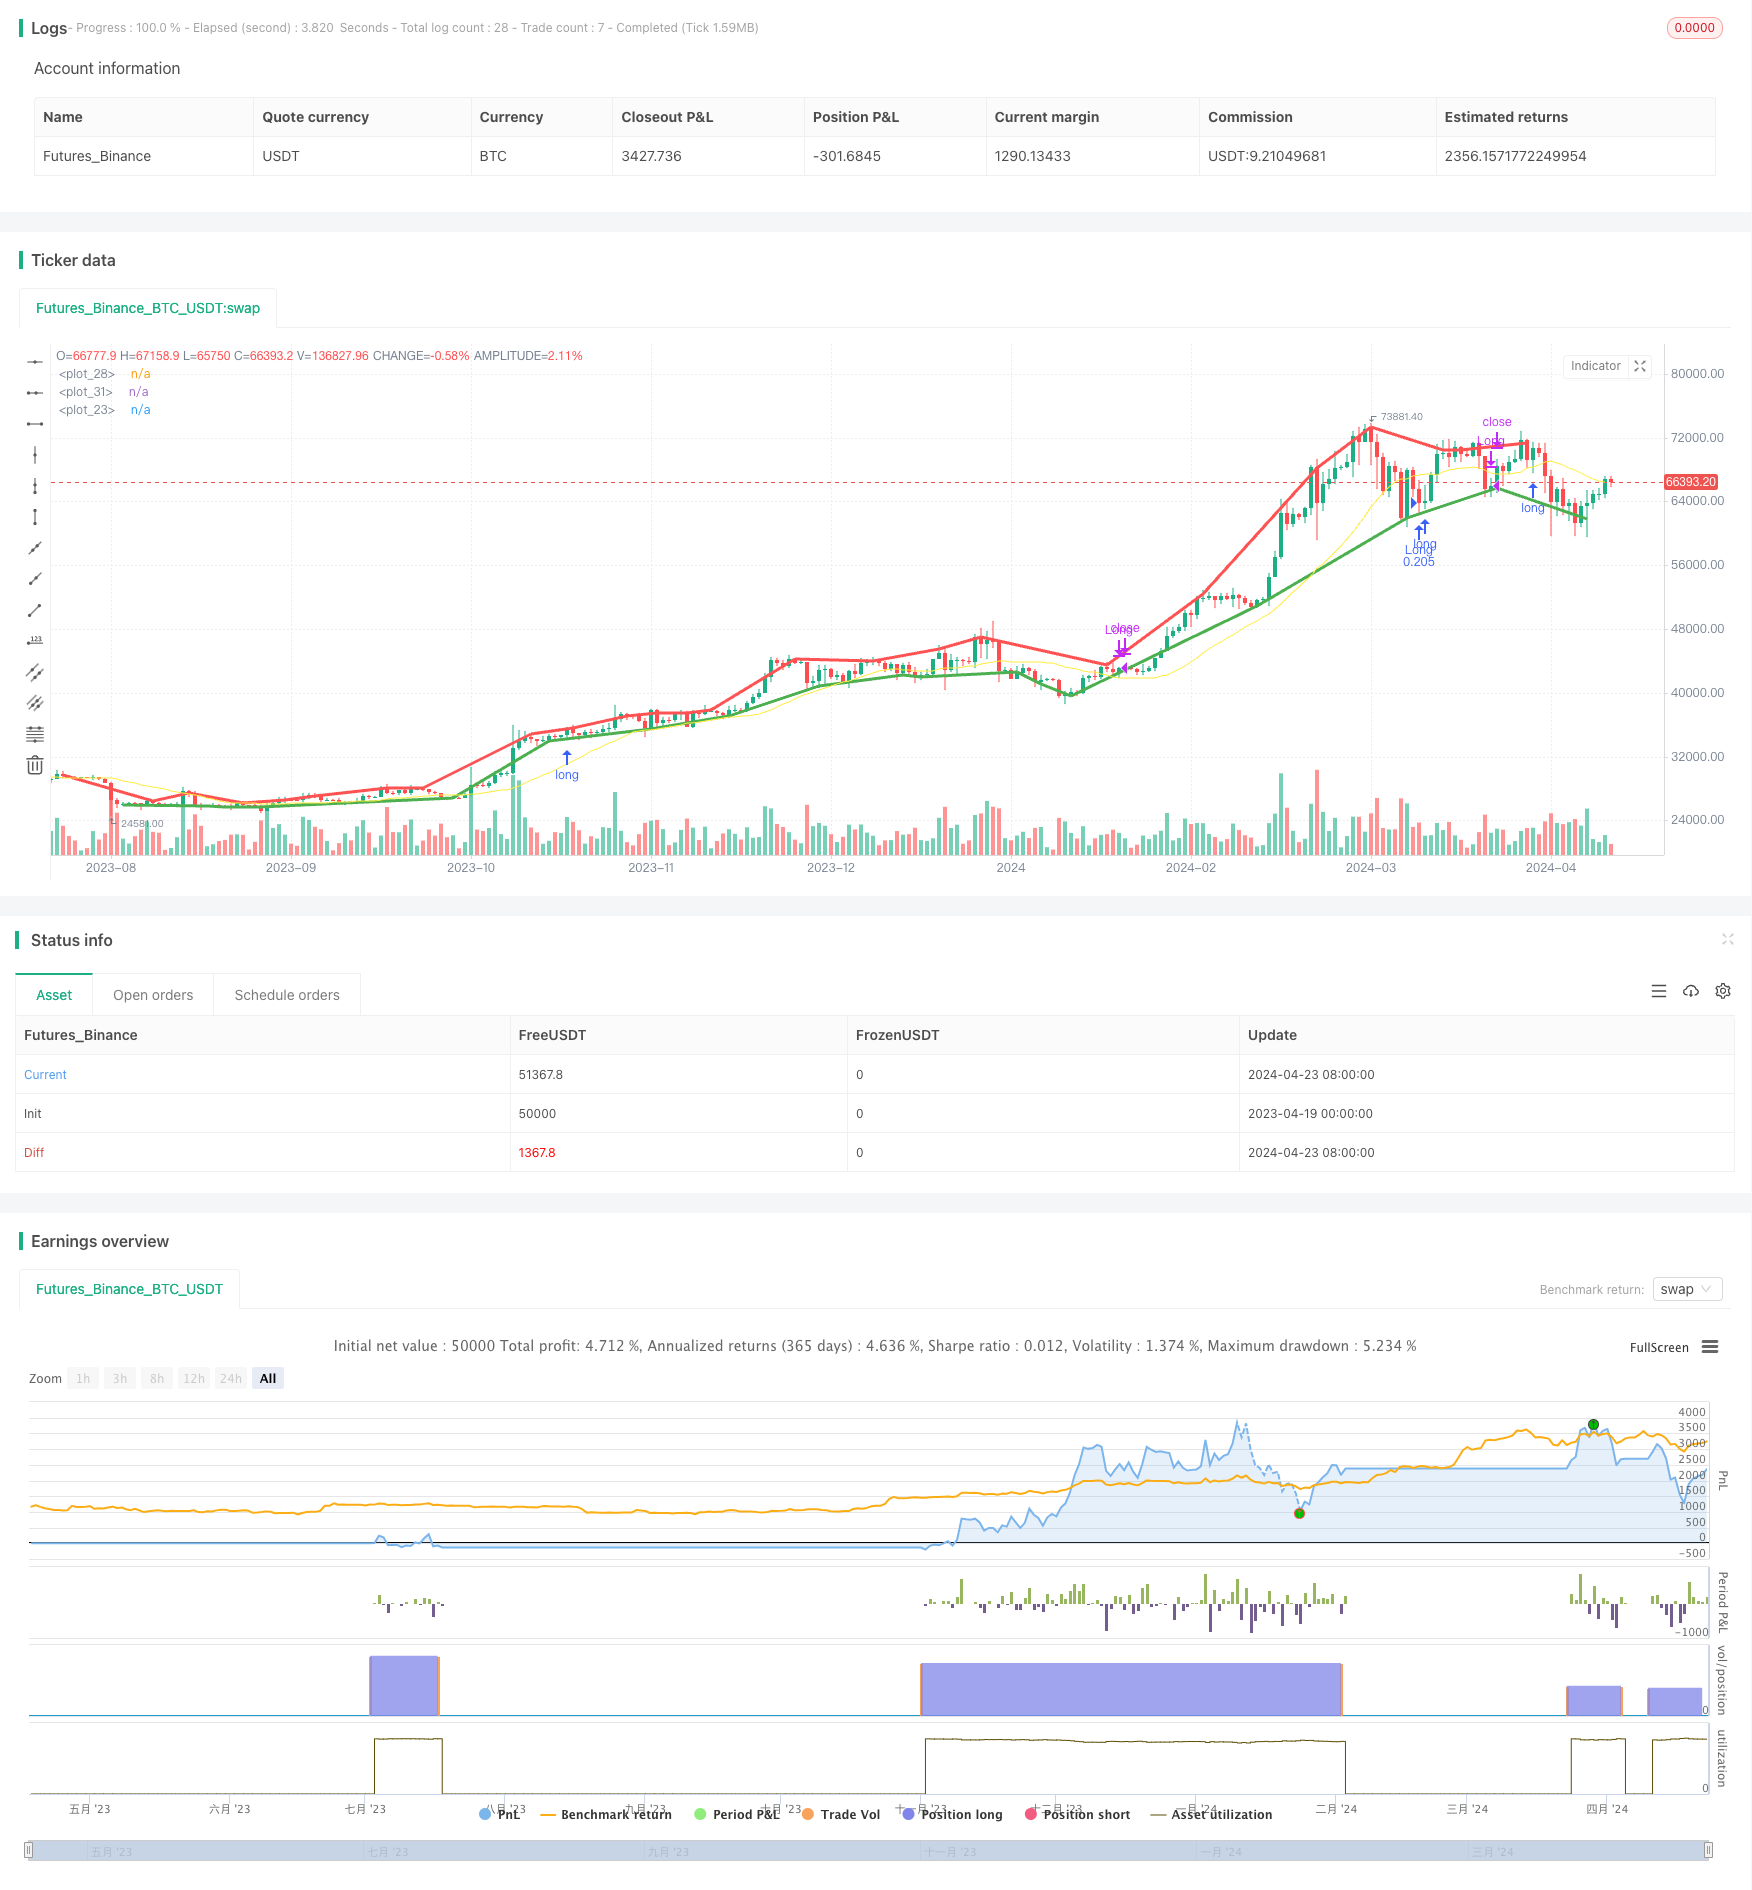
Overview
This strategy is a dual timeframe momentum strategy. It determines the trend direction on the higher timeframe using a Simple Moving Average (SMA) and identifies reversal points on the lower timeframe using pivot points (PivotLow and PivotHigh). It enters long when the higher timeframe shows an uptrend and a bullish pivot point appears on the lower timeframe, and enters short when the higher timeframe shows a downtrend and a bearish pivot point appears on the lower timeframe.
Strategy Principles
The main principle of this strategy is that the trend direction of the higher timeframe will influence the movement of the lower timeframe. When the higher timeframe shows an uptrend, pullbacks on the lower timeframe are more likely to be buying opportunities; when the higher timeframe shows a downtrend, rebounds on the lower timeframe are more likely to be shorting opportunities. This strategy uses the Simple Moving Average (SMA) to determine the trend direction of the higher timeframe and pivot points (PivotLow and PivotHigh) to identify reversal points on the lower timeframe.
Strategy Advantages
- Dual timeframe analysis, leveraging the impact of the higher timeframe on the lower timeframe, increases the probability of successful trades.
- Using SMA to determine the trend direction is relatively reliable, and using pivot points to capture reversal points is relatively accurate.
- Parameters are adjustable, making the strategy highly adaptable. Users can adjust the higher and lower timeframes, the period of the SMA, and the parameters of the pivot points according to their needs.
- The logic is clear and easy to understand and implement.
Strategy Risks
- Risk of trend change. If the trend of the higher timeframe suddenly changes, the lower timeframe may not have reacted yet, causing the strategy to fail.
- Risk of parameter settings. Inappropriate parameter settings may lead to poor strategy performance. For example, choosing an SMA period that is too short may lead to frequent trading, while choosing one that is too long may lead to lagging trend judgments.
- Risk of extreme market conditions. In extreme market conditions (such as sharp rises or falls), this strategy may fail because the lower timeframe may not follow the trend of the higher timeframe.
Strategy Optimization Directions
- Add trend change detection. Logic can be added to determine whether the trend of the higher timeframe has changed in order to adjust trading on the lower timeframe more quickly.
- Optimize parameter selection. Parameter optimization methods (such as genetic algorithms, grid search, etc.) can be used to find the optimal parameter combination.
- Add risk control. Risk control measures (such as stop-loss, position management, etc.) can be added to reduce losses under extreme market conditions.
- Multi-factor fusion. Other indicators or factors (such as volatility, volume, etc.) can be considered to be incorporated into the strategy to improve its robustness.
Summary
This dual timeframe momentum strategy leverages the connection between higher and lower timeframes, determining the trend direction on the higher timeframe and capturing reversal points on the lower timeframe to achieve trend following and reversal trading. The strategy has clear logic and obvious advantages, but also has some risks. In the future, the strategy can be optimized from aspects such as trend change detection, parameter optimization, risk control, and multi-factor fusion to improve its adaptability and robustness.
Parameters
| Name | Default | What it controls |
|---|---|---|
| v_input_int_1 | 20 | Moving Average Period |
| v_input_source_1_close | 0 | Source: close | high | low | open | hl2 | hlc3 | hlcc4 | ohlc4 |
| v_input_timeframe_1 | 240 | Resolution |
| v_input_int_2 | 5 | Pivot Let Bars |
| v_input_int_3 | 2 | Pivot Right Bars |
Source Pine Script
/*backtest
start: 2023-04-19 00:00:00
end: 2024-04-24 00:00:00
period: 1d
basePeriod: 1h
exchanges: [{"eid":"Futures_Binance","currency":"BTC_USDT"}]
*/

// This Pine Script™ code is subject to the terms of the Mozilla Public License 2.0 at https://mozilla.org/MPL/2.0/
// © Riester

//@version=5
strategy("Dual Timeframe Momentum", overlay=true, precision=6, pyramiding=0, initial_capital=1000, default_qty_type=strategy.percent_of_equity, default_qty_value=25.0, commission_value=0.05)

n = input.int(20, "Moving Average Period", minval=1)
src = input.source(close, "Source")
high_tf = input.timeframe("240", "Resolution")
pivot_l = input.int(5, "Pivot Let Bars")
pivot_r = input.int(2, "Pivot Right Bars")

//-----------------------------------------------------------------------------------------------------------------------------------------------------------------
// Calculations
//-----------------------------------------------------------------------------------------------------------------------------------------------------------------

// 1. Define low and high timeframe prices
low_src = src
high_src = request.security(syminfo.tickerid, high_tf, src)

// 2. Use simple moving average to determine trend of higher timeframe (up or down)
high_tf_ma = ta.sma(high_src, n)
plot(high_tf_ma,  color=color.yellow)
high_tf_trend = high_tf_ma > high_tf_ma[1] ? 1 : -1

// 3. Use pivots to identify reversals on the low timeframe
low_tf_pl = ta.pivotlow(high_src, pivot_l, pivot_r)
plot(low_tf_pl, style=plot.style_line, linewidth=3, color= color.green, offset=-pivot_r)

low_tf_ph = ta.pivothigh(high_src, pivot_l, pivot_r)
plot(low_tf_ph, style=plot.style_line, linewidth=3, color= color.red, offset=-pivot_r)

bool long = low_tf_pl and high_tf_trend == 1
bool short = low_tf_ph and high_tf_trend == -1

//-----------------------------------------------------------------------------------------------------------------------------------------------------------------
// Plots
//-----------------------------------------------------------------------------------------------------------------------------------------------------------------

// this message is an alert that can be sent to a webhook, which allows for simple automation if you have a server that listens to alerts and trades programmatically.
enter_long_alert = '{"side": "Long", "order": "Enter", "price": ' + str.tostring(open) + ', "timestamp": ' + str.tostring(timenow) + '}'
exit_long_alert = '{"side": "Long", "order": "Exit", "price": ' + str.tostring(open) + ', "timestamp": ' + str.tostring(timenow) + '}'

if long
    strategy.entry(id="Long", direction=strategy.long, limit=open, alert_message=enter_long_alert)

if short
    strategy.close(id="Long", comment="Close Long", alert_message=exit_long_alert)
Published by ChaoZhang on the FMZ strategy square · last modified 2024-04-25. Collected in the Quant Trading Vault. Unvalidated research: re-test with your own data and costs before trusting it.
Build this with AgenKit
A spec is not a trading system. Paste this into your coding agent and AgenKit runs a specialist team — architecture, test-first build, risk gates, review — with paper trading on by default.
/agenkit build a production-grade trading bot with a backtest engine, risk controls and paper trading by default from strategies/Dual-Timeframe-Momentum-Strategy.md- npx agenkit install engineering-kit in your project
- Paste the command into your agent and approve each phase
- Get tests, backtest, risk controls and a paper-trading switch
Understand it first
Before you run this, read the lesson behind the idea and how to backtest it honestly. Specs like this one are the survivors of an unknown number of trials; deflate their results accordingly.
Related specs
- KST EMA Momentum Trend Following StrategyPine Script · Momentum · 1d
- Multi Timeframe Momentum Confluence Automated Trading StrategyPine Script · Momentum · 1h
- Multi factor Adaptive Momentum Tracking StrategyPine Script · Momentum · 3m
- Pivot and Momentum StrategyPine Script · Momentum · 1d
- Advanced Automated Trading System Multi indicator Momentum and Support Resistance Trend AnalysisPine Script · Momentum · 1d
- Buy Sell Strategy Based on Volume Candlestick PatternsPine Script · Momentum · 1d