Strategy vault / Trend following
Dual Timeframe Trend Tracking Strategy
This strategy uses double moving averages configured on the daily and hourly charts to determine the major trend direction on the daily chart and enter and exit trades on the hourly chart. It goes long when the daily…
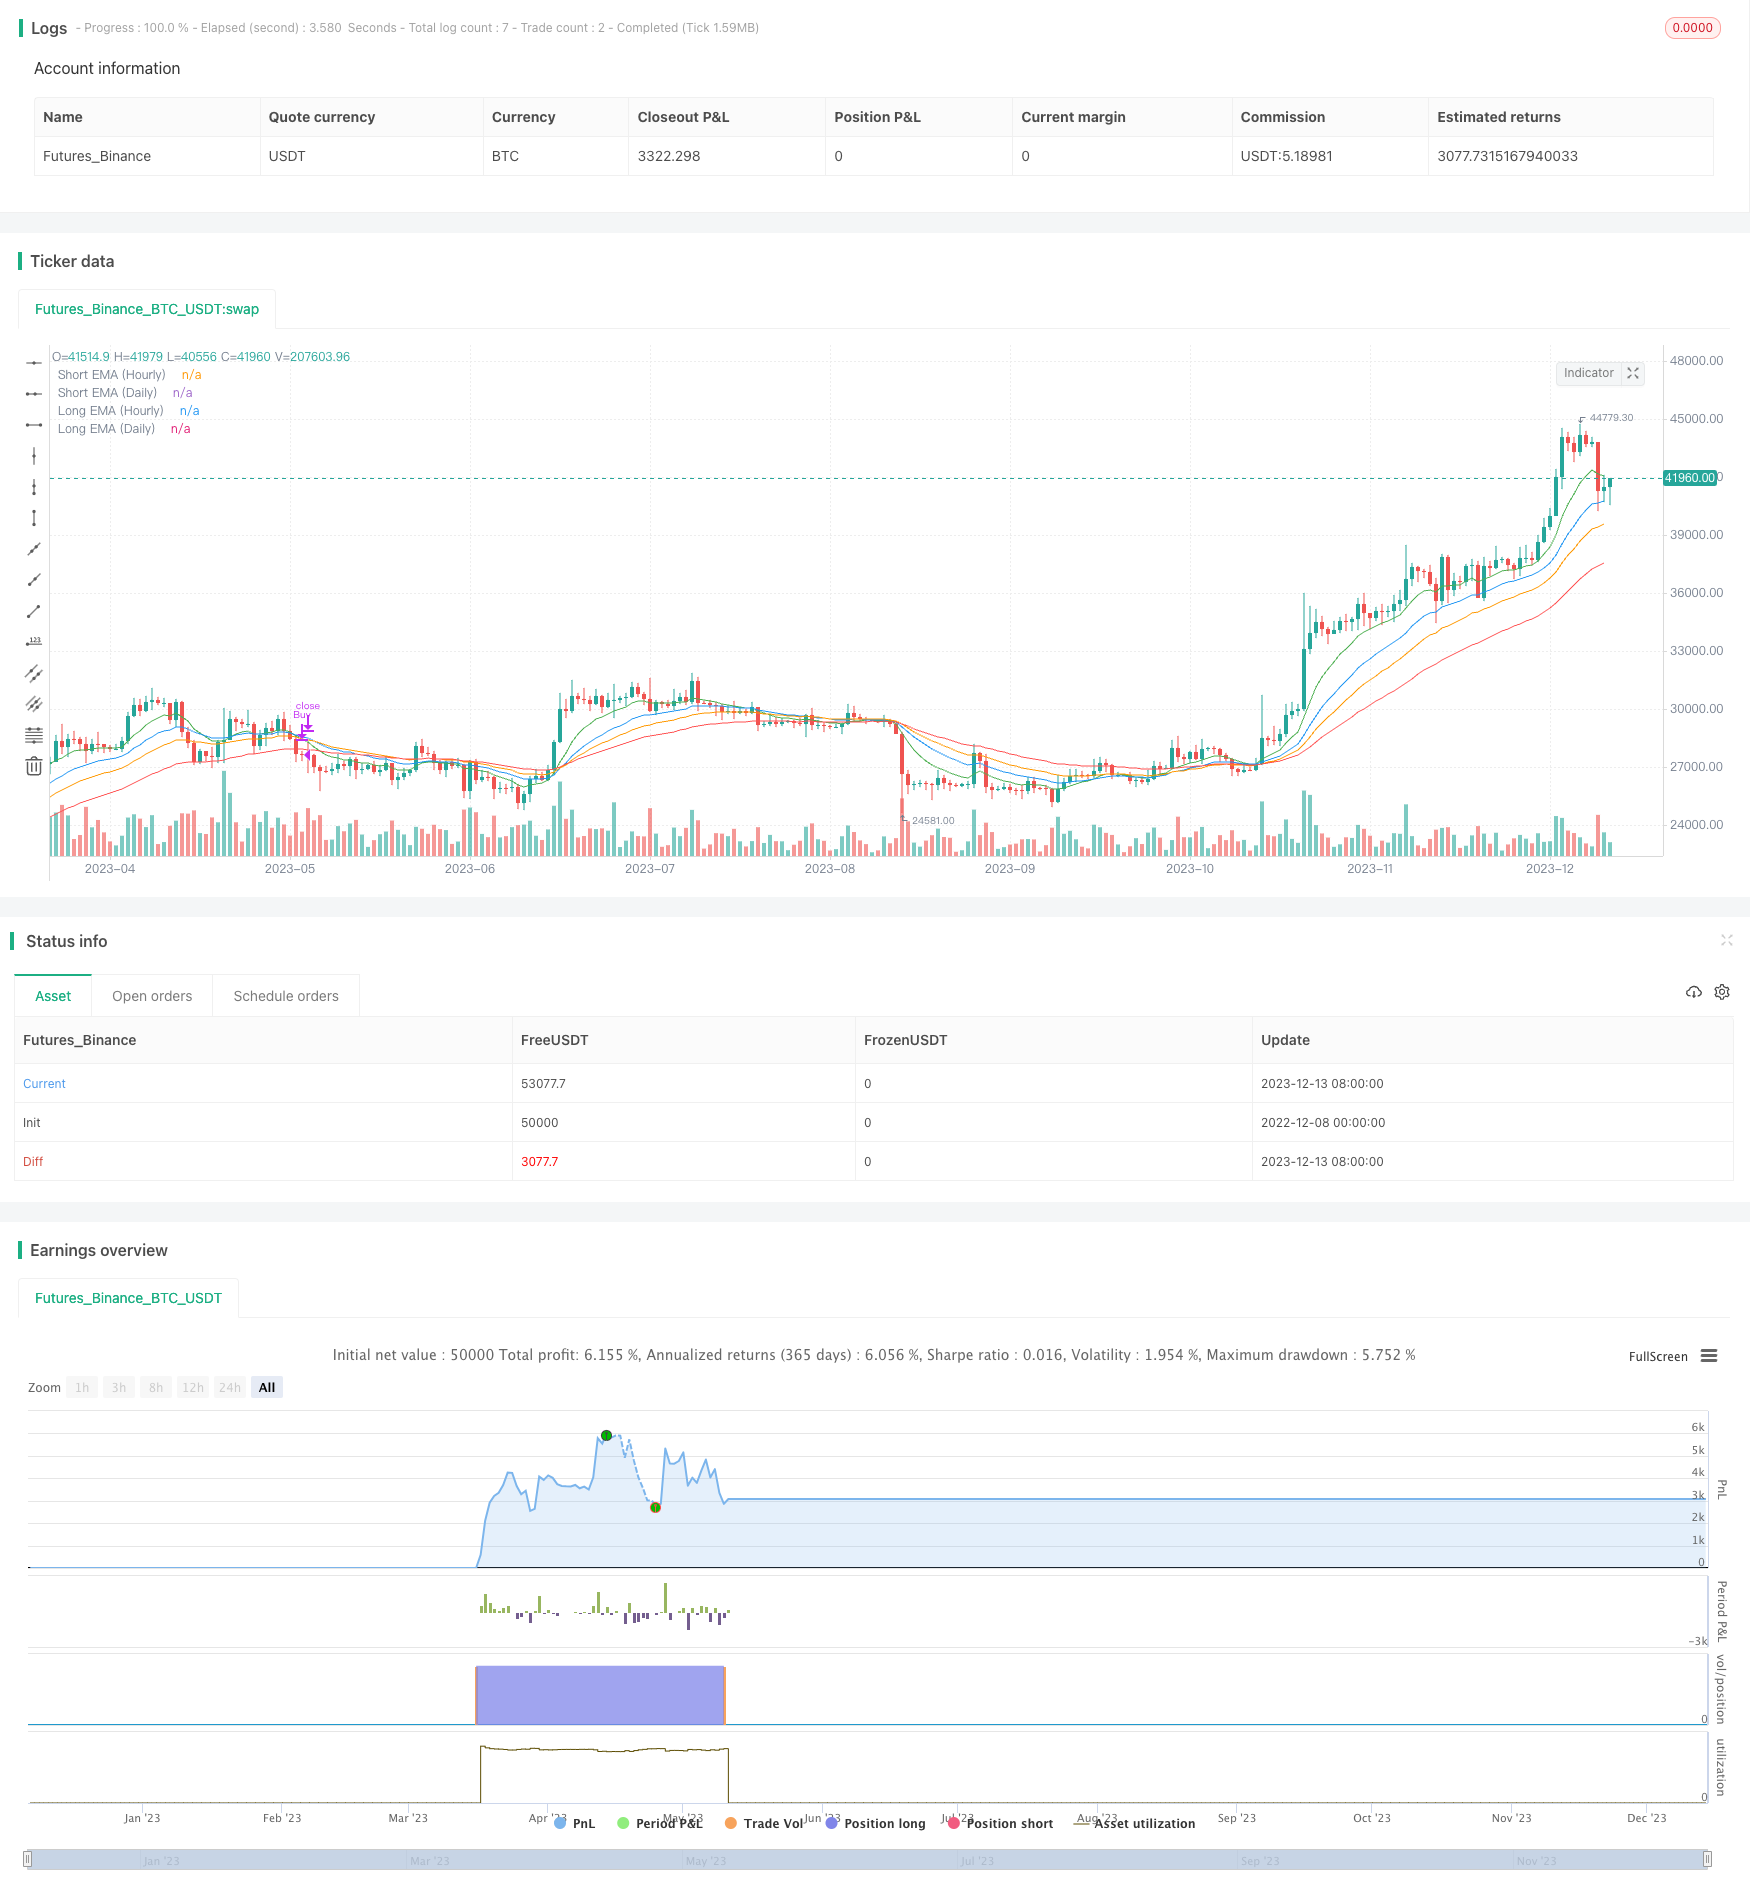
Overview
This strategy uses double moving averages configured on the daily and hourly charts to determine the major trend direction on the daily chart and enter and exit trades on the hourly chart. It goes long when the daily chart indicates an upward trend and the hourly chart sees a golden cross, and closes the position when the daily chart shows an upward trend but the hourly chart sees a death cross. This configuration allows us to capture short-to-medium-term opportunities while avoiding the impacts of short-term market fluctuations.
Strategy Logic
- Calculate fast and slow EMA lines on the daily chart
- Determine an upward trend when the fast EMA line crosses above the slow EMA line
- Also calculate fast and slow EMA lines on the hourly chart
- Go long when the hourly fast EMA crosses above the slow EMA
- Close the position when the hourly fast EMA crosses below the slow EMA
Advantage Analysis
The main advantages of this dual timeframe configuration are:
- Captures short-term trading opportunities in line with major trends, improving profitability
- The double EMA filter avoids whipsaws
- Only trades when trend background is favorable, effectively controlling risk
- Combining multiple timeframes improves decision accuracy
Risk Analysis
Main risks of this strategy are:
- Incorrect major trend judgement leads to larger stop loss risk
- Volatile hourly price action can generate false signals
- Improper parameter tuning causes overtrading and whipsaws
These risks can be mitigated by widening stop loss levels, optimizing parameters, or adding filters.
Optimization Directions
This strategy can be further optimized by:
- Adding additional indicators like volume to improve signal accuracy
- Implementing adaptive stop loss mechanisms to actively manage risk
- Finding optimal moving average parameter combinations
- Judging trends across even higher timeframes for robustness
Conclusion
This strategy leverages a dual timeframe analysis to capture short-to-medium-term opportunities within major trends. The double EMA configuration filters out noise. This provides solid profitability while effectively managing risk. Further optimizations can make the strategy more robust and efficient for wider application.
Parameters
| Name | Default | What it controls |
|---|---|---|
| v_input_int_1 | 20 | Short EMA Length (Daily) |
| v_input_int_2 | 50 | Long EMA Length (Daily) |
| v_input_int_3 | 10 | Short EMA Length (Hourly) |
| v_input_int_4 | 30 | Long EMA Length (Hourly) |
Source Pine Script
/*backtest
start: 2022-12-08 00:00:00
end: 2023-12-14 00:00:00
period: 1d
basePeriod: 1h
exchanges: [{"eid":"Futures_Binance","currency":"BTC_USDT"}]
*/

//@version=5
strategy("Dual Time Frame Strategy", overlay=true)

// Define Daily Time Frame Inputs
lenShort = input.int(20, title="Short EMA Length (Daily)", minval=1)
lenLong = input.int(50, title="Long EMA Length (Daily)", minval=1)

// Calculate EMAs on Daily Time Frame
emaShort_D = ta.ema(close, lenShort)
emaLong_D = ta.ema(close, lenLong)

// Define Hourly Time Frame Inputs
lenShort_H = input.int(10, title="Short EMA Length (Hourly)", minval=1)
lenLong_H = input.int(30, title="Long EMA Length (Hourly)", minval=1)

// Calculate EMAs on Hourly Time Frame
emaShort_H = ta.ema(close, lenShort_H)
emaLong_H = ta.ema(close, lenLong_H)

// Daily Time Frame Condition
dailyUpTrend = emaShort_D > emaLong_D

// Hourly Time Frame Condition
hourlyBuy = ta.crossover(emaShort_H, emaLong_H)
hourlySell = ta.crossunder(emaShort_H, emaLong_H)

// Strategy Entry and Exit Conditions
if (dailyUpTrend and hourlyBuy)
    strategy.entry("Buy", strategy.long)

if (dailyUpTrend and hourlySell)
    strategy.close("Buy")

// Plot EMAs for Daily and Hourly Time Frames
plot(emaShort_D, color=color.blue, title="Short EMA (Daily)")
plot(emaLong_D, color=color.red, title="Long EMA (Daily)")

plot(emaShort_H, color=color.green, title="Short EMA (Hourly)")
plot(emaLong_H, color=color.orange, title="Long EMA (Hourly)")
Published by ChaoZhang on the FMZ strategy square · last modified 2023-12-15. Collected in the Quant Trading Vault. Unvalidated research: re-test with your own data and costs before trusting it.
Build this with AgenKit
A spec is not a trading system. Paste this into your coding agent and AgenKit runs a specialist team — architecture, test-first build, risk gates, review — with paper trading on by default.
/agenkit build a production-grade trading bot with a backtest engine, risk controls and paper trading by default from strategies/Dual-Timeframe-Trend-Tracking-Strategy.md- npx agenkit install engineering-kit in your project
- Paste the command into your agent and approve each phase
- Get tests, backtest, risk controls and a paper-trading switch
Understand it first
Before you run this, read the lesson behind the idea and how to backtest it honestly. Specs like this one are the survivors of an unknown number of trials; deflate their results accordingly.
Related specs
- 200 EMA VWAP MFI Trend Following StrategyPine Script · Trend following · 1d
- 4 EMA Trend StrategyPine Script · Trend following · 1d
- ADX MA and EMA Long Only Trend Tracking StrategyPine Script · Trend following · 1d
- ATR Dynamic Trend Following and EMA Crossover Trading StrategyPine Script · Trend following · 1d
- ATR and Moving Average Crossover Hybrid StrategyPine Script · Trend following · 1h
- ATR and T3 Moving Average StrategyPine Script · Trend following · 5m