Dual Timeframe Volatility Spread Trading Strategy
The dual timeframe volatility spread trading strategy judges the overbought/oversold status of the market by calculating the spread between RSI indicators of two different time cycles to implement low risk trend trading.
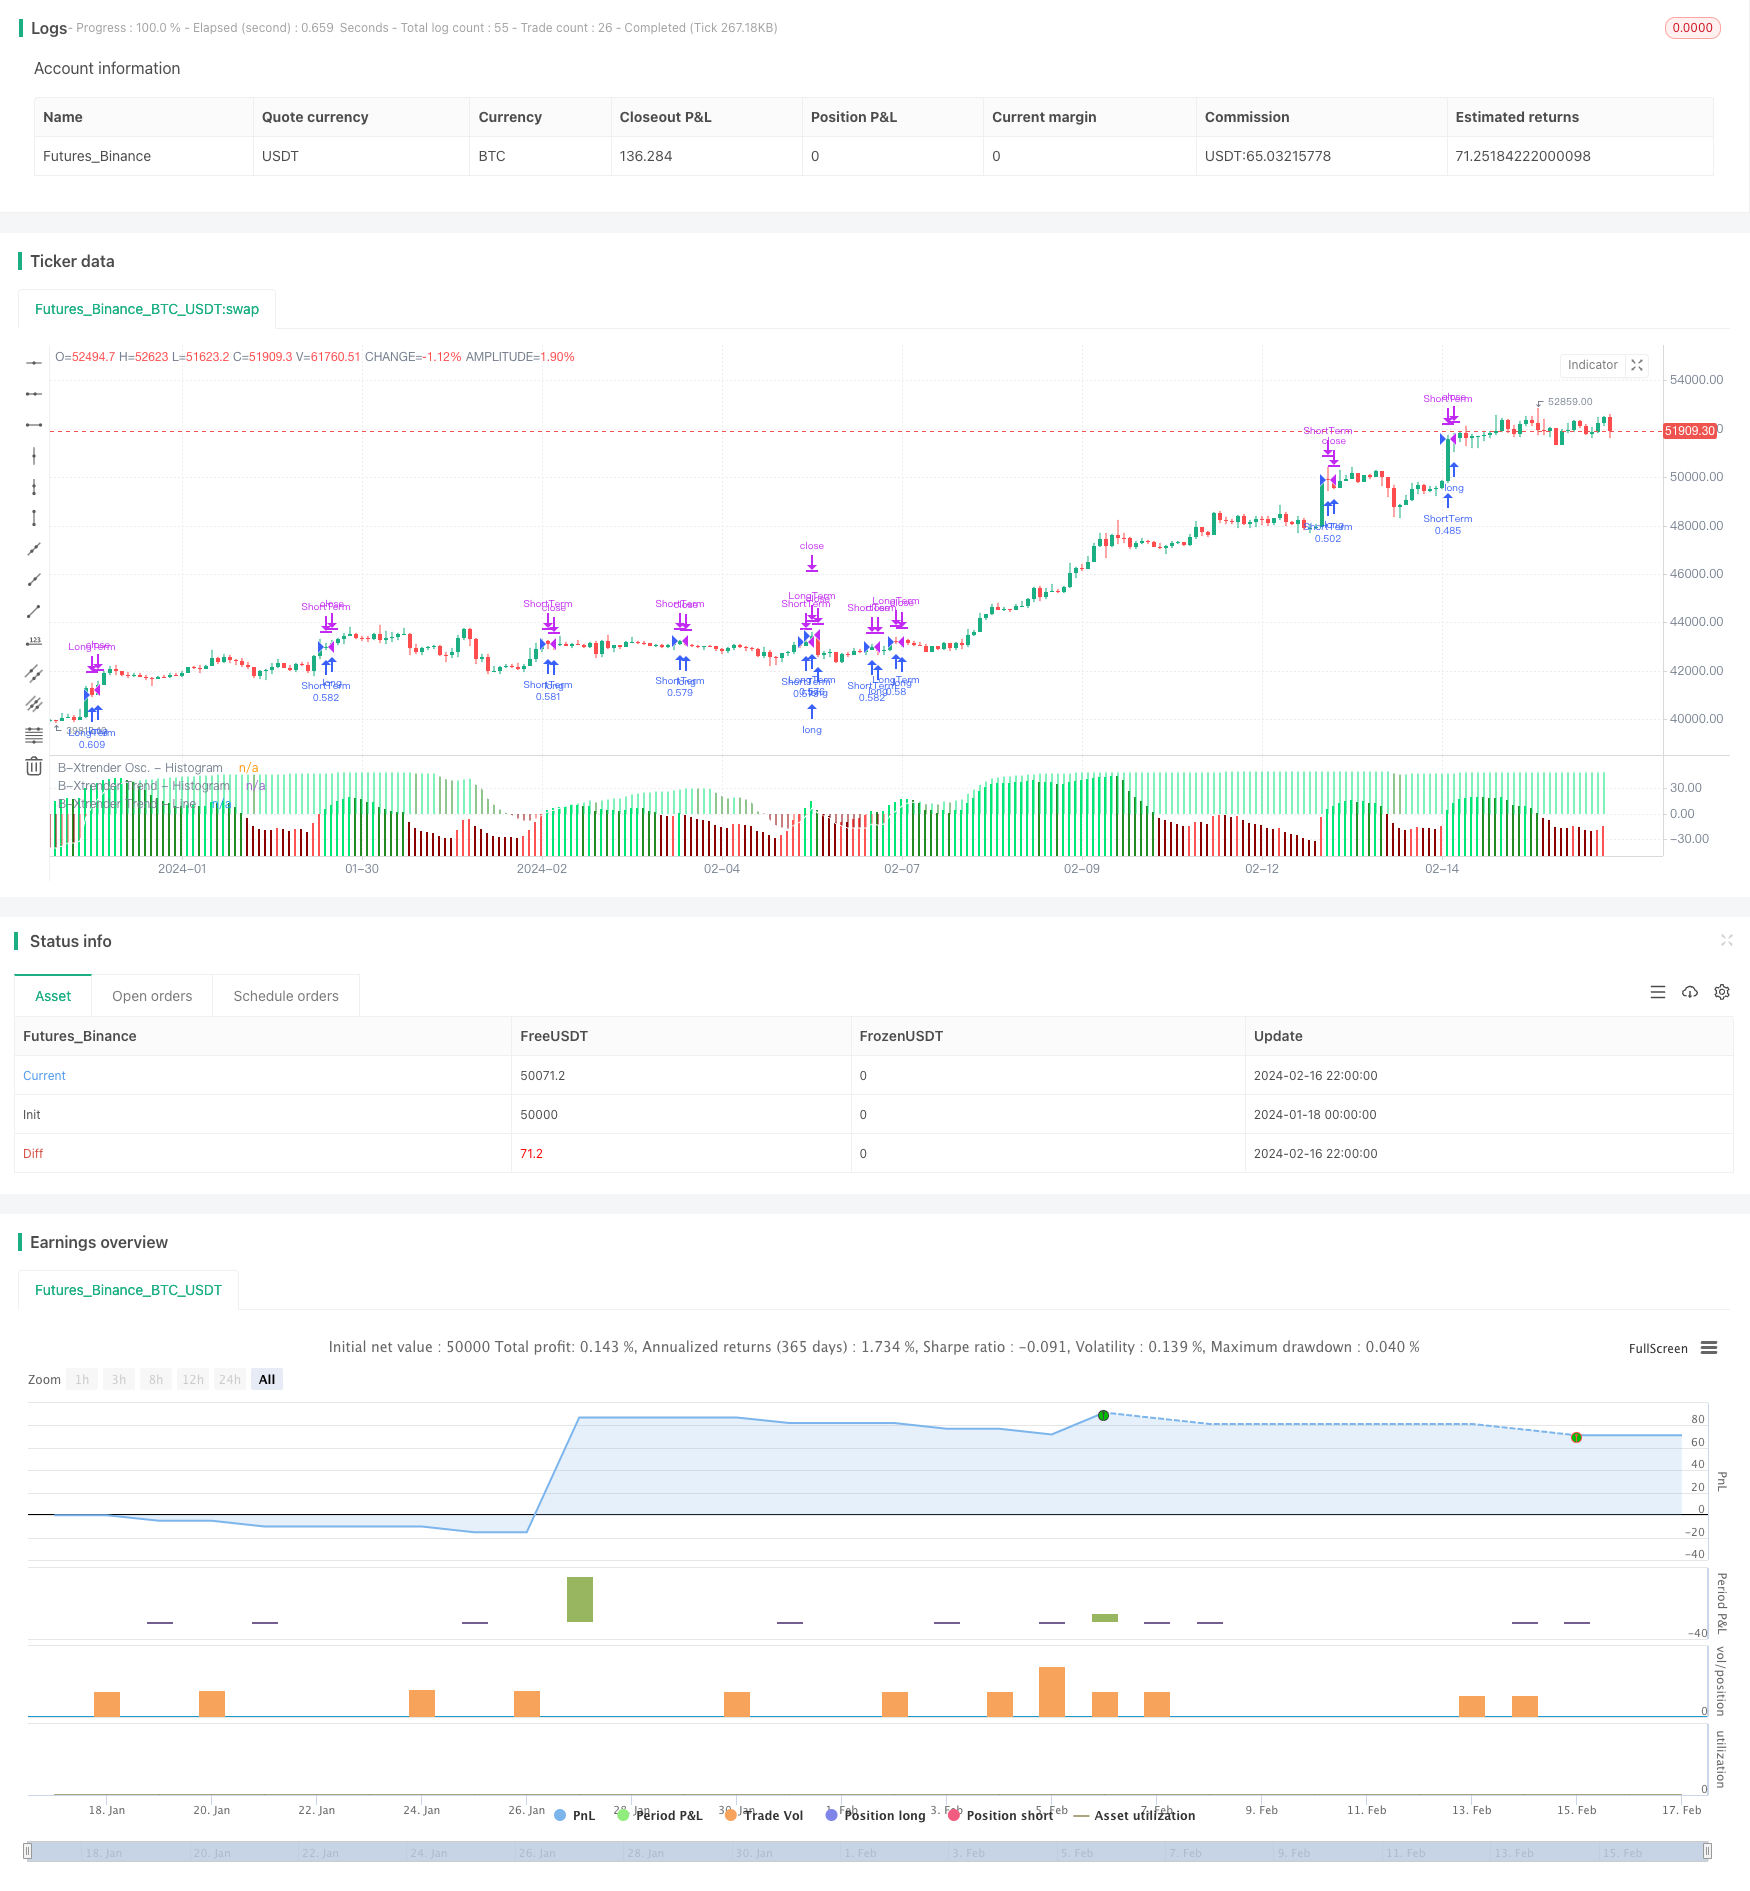
Overview
The dual timeframe volatility spread trading strategy judges the overbought/oversold status of the market by calculating the spread between RSI indicators of two different time cycles to implement low risk trend trading.
Strategy Principle
The core indicators of this strategy are shortTermXtrender and longTermXtrender. shortTermXtrender calculates the RSI spread on the short-term timeframe, and longTermXtrender calculates the RSI spread on the long-term timeframe.
The short-term timeframe adopts the price difference between 7-day EMA and 4-day LMA to calculate RSI, and then the price difference with 50 constitutes shortTermXtrender. The long-term timeframe adopts the price difference between RSI of 4-day EMA and 50 to constitute longTermXtrender.
When shortTermXtrender crosses above 0, go long; when longTermXtrender crosses above 0, also go long. The stop loss principle after going long is to stop loss when shortTermXtrender crosses below 0; when longTermXtrender crosses below 0, stop loss too.
In this way, by judging on dual timeframes, more false breakouts can be filtered out.
Advantage Analysis
The biggest advantage of this strategy is that the trend judgment is accurate. The combination of dual timeframes can effectively filter out noise and lock in the target trend direction. This provides a guarantee for low-risk trend tracking trading.
In addition, the strategy provides room for parameter optimization. Users can adjust parameters such as SMA cycle and RSI parameters according to different varieties and time cycles to optimize strategy results.
Risk Analysis
The main risk of this strategy is the wrong judgment of long and short. In oscillating markets, it is easy to generate wrong signals. If the position is still opened at this time, there will be the risk of loss.
In addition, improper parameter settings can also lead to poor results. If the time cycle parameter is set too short, the probability of misjudgment will increase; if the time cycle parameter is set too long, the opportunity for the trend will be missed. This requires users to test and optimize parameters for different markets.
Optimization Directions
The strategy can be optimized in the following aspects:
Increase profit taking mechanism. Currently there is no profit taking setting in the strategy. Profit can be taken in time after reaching the target profit.
Increase position management. Positions can be dynamically adjusted based on capital size, volatility and other indicators.
Test parameter settings for different varieties. Users can test the optimal parameter combination by backtesting different timeframes such as daily and 60 minutes.
Increase machine learning assisted judgment. Models can be trained to determine market conditions and dynamically adjust strategy parameters to improve win rate.
Summary
The dual timeframe volatility spread trading strategy achieves efficient trend capturing by constructing dual timeframe indicators. The strategy has large optimization space. Users can optimize through parameter adjustment, profit taking management, position management, etc. to obtain better strategy results. This strategy is suitable for users with some trading experience.
Parameters
| Name | Default | What it controls |
|---|---|---|
| v_input_1 | 7 | ShortTermSMA |
| v_input_2 | 4 | ShortTermLMA |
| v_input_3 | 2 | ShortTermRSI |
| v_input_4 | 4 | LongTermMA |
| v_input_5 | 2 | LongTermRSI |
| v_input_6 | true | UseFactors |
| v_input_7 | true | TradeShortTerm |
| v_input_8 | true | TradeLongTerm |
| v_input_9 | true | From Day |
| v_input_10 | true | From Month |
| v_input_11 | 2018 | From Year |
| v_input_12 | true | To Day |
| v_input_13 | true | To Month |
| v_input_14 | 2020 | To Year |
Source Pine Script
/*backtest
start: 2024-01-18 00:00:00
end: 2024-02-17 00:00:00
period: 2h
basePeriod: 15m
exchanges: [{"eid":"Futures_Binance","currency":"BTC_USDT"}]
*/

//@version=4
//study("MavXtrender")
strategy("MavXtrender")

ShortTermSMA = input(7)
ShortTermLMA = input(4)
ShortTermRSI = input(2)

LongTermMA  = input(4)
LongTermRSI  = input(2)

UseFactors = input(true)
TradeShortTerm = input(true)
TradeLongTerm = input(true)

count = TradeShortTerm == true ? 1 : 0
count := TradeLongTerm == true ? count + 1 : count
// set position size
Amount = strategy.equity / (close * count)

ShortTermLMA := UseFactors == true ? round(ShortTermSMA * ShortTermLMA) : ShortTermLMA
ShortTermRSI := UseFactors == true ? round(ShortTermSMA * ShortTermRSI) : ShortTermRSI
LongTermMA := UseFactors == true ? round(ShortTermSMA * LongTermMA) : LongTermMA
LongTermRSI := UseFactors == true ? round(ShortTermSMA * LongTermRSI) : LongTermRSI

shortTermXtrender = rsi(ema(close, ShortTermSMA) - ema(close, ShortTermLMA), ShortTermRSI ) - 50
longTermXtrender  = rsi( ema(close, LongTermMA), LongTermRSI ) - 50

// === INPUT BACKTEST RANGE ===
FromDay   = input(defval = 1, title = "From Day", minval = 1, maxval = 31)
FromMonth = input(defval = 1, title = "From Month", minval = 1, maxval = 12)
FromYear  = input(defval = 2018, title = "From Year", minval = 2012)
ToDay     = input(defval = 1, title = "To Day", minval = 1, maxval = 31)
ToMonth   = input(defval = 1, title = "To Month", minval = 1, maxval = 12)
ToYear    = input(defval = 2020, title = "To Year", minval = 2012)

// === FUNCTION EXAMPLE ===
start     = timestamp(FromYear, FromMonth, FromDay, 00, 00)  // backtest start window
finish    = timestamp(ToYear, ToMonth, ToDay, 23, 59)        // backtest finish window
window()  => true

strategy.entry("ShortTerm", strategy.long, qty = Amount, when = window() and crossover(shortTermXtrender,0) and TradeShortTerm)
strategy.entry("LongTerm", strategy.long, qty = Amount, when = window() and crossover(longTermXtrender,0) and TradeLongTerm)

strategy.close("ShortTerm", when = crossunder(shortTermXtrender,0) or time > finish)
strategy.close("LongTerm", when = crossunder(longTermXtrender,0) or time > finish)

shortXtrenderCol = shortTermXtrender > 0 ? shortTermXtrender > shortTermXtrender[1] ? color.lime : #228B22 : shortTermXtrender > shortTermXtrender[1] ? color.red : #8B0000
plot(shortTermXtrender, color=shortXtrenderCol, style=plot.style_columns, linewidth=1, title="B-Xtrender Osc. - Histogram", transp = 50)

longXtrenderCol = longTermXtrender> 0 ? longTermXtrender > longTermXtrender[1] ? color.lime : #228B22 : longTermXtrender > longTermXtrender[1] ? color.red : #8B0000
plot(longTermXtrender , color=longXtrenderCol, style=plot.style_histogram, linewidth=2, title="B-Xtrender Trend - Histogram", transp = 80)
plot(longTermXtrender , color=color.white,     style=plot.style_line,      linewidth=1, title="B-Xtrender Trend - Line",      transp = 80)
Published by ChaoZhang on the FMZ strategy square · last modified 2024-02-18. Collected in the Quant Trading Vault. Unvalidated research: re-test with your own data and costs before trusting it.
Build this with AgenKit
A spec is not a trading system. Paste this into your coding agent and AgenKit runs a specialist team — architecture, test-first build, risk gates, review — with paper trading on by default.
/agenkit build a spread arbitrage engine with WebSocket order routing and leg-risk controls from strategies/Dual-Timeframe-Volatility-Spread-Trading-Strategy.md- npx agenkit install engineering-kit in your project
- Paste the command into your agent and approve each phase
- Get tests, backtest, risk controls and a paper-trading switch
Understand it first
Before you run this, read the lesson behind the idea and how to backtest it honestly. Specs like this one are the survivors of an unknown number of trials; deflate their results accordingly.
Related specs
- multiple auxiliary RSI indicator strategyPine Script · Arbitrage · 1d
- Oscillating Market Long StrategyPine Script · Arbitrage · 1d
- Triple Moving Average Quantitative Trading Strategy 433095Pine Script · Arbitrage · 1d
- Cross Cycle Arbitrage Strategy Based on Multiple IndicatorsPine Script · Arbitrage · 1h
- Momentum Arbitrage Strategy Backtest AnalysisPine Script · Arbitrage · 1h
- The Triple Moving Average Channel Strategy for Patiently Mining Valuable Information from Candlestick LinesPine Script · Arbitrage · 1d