Strategy vault / Mean reversion
Dynamic CCI Support and Resistance Strategy
This strategy uses the pivot points of the CCI indicator to calculate dynamic support and resistance levels, and combines trend judgment to find buy and sell signals. The strategy integrates the reversal…
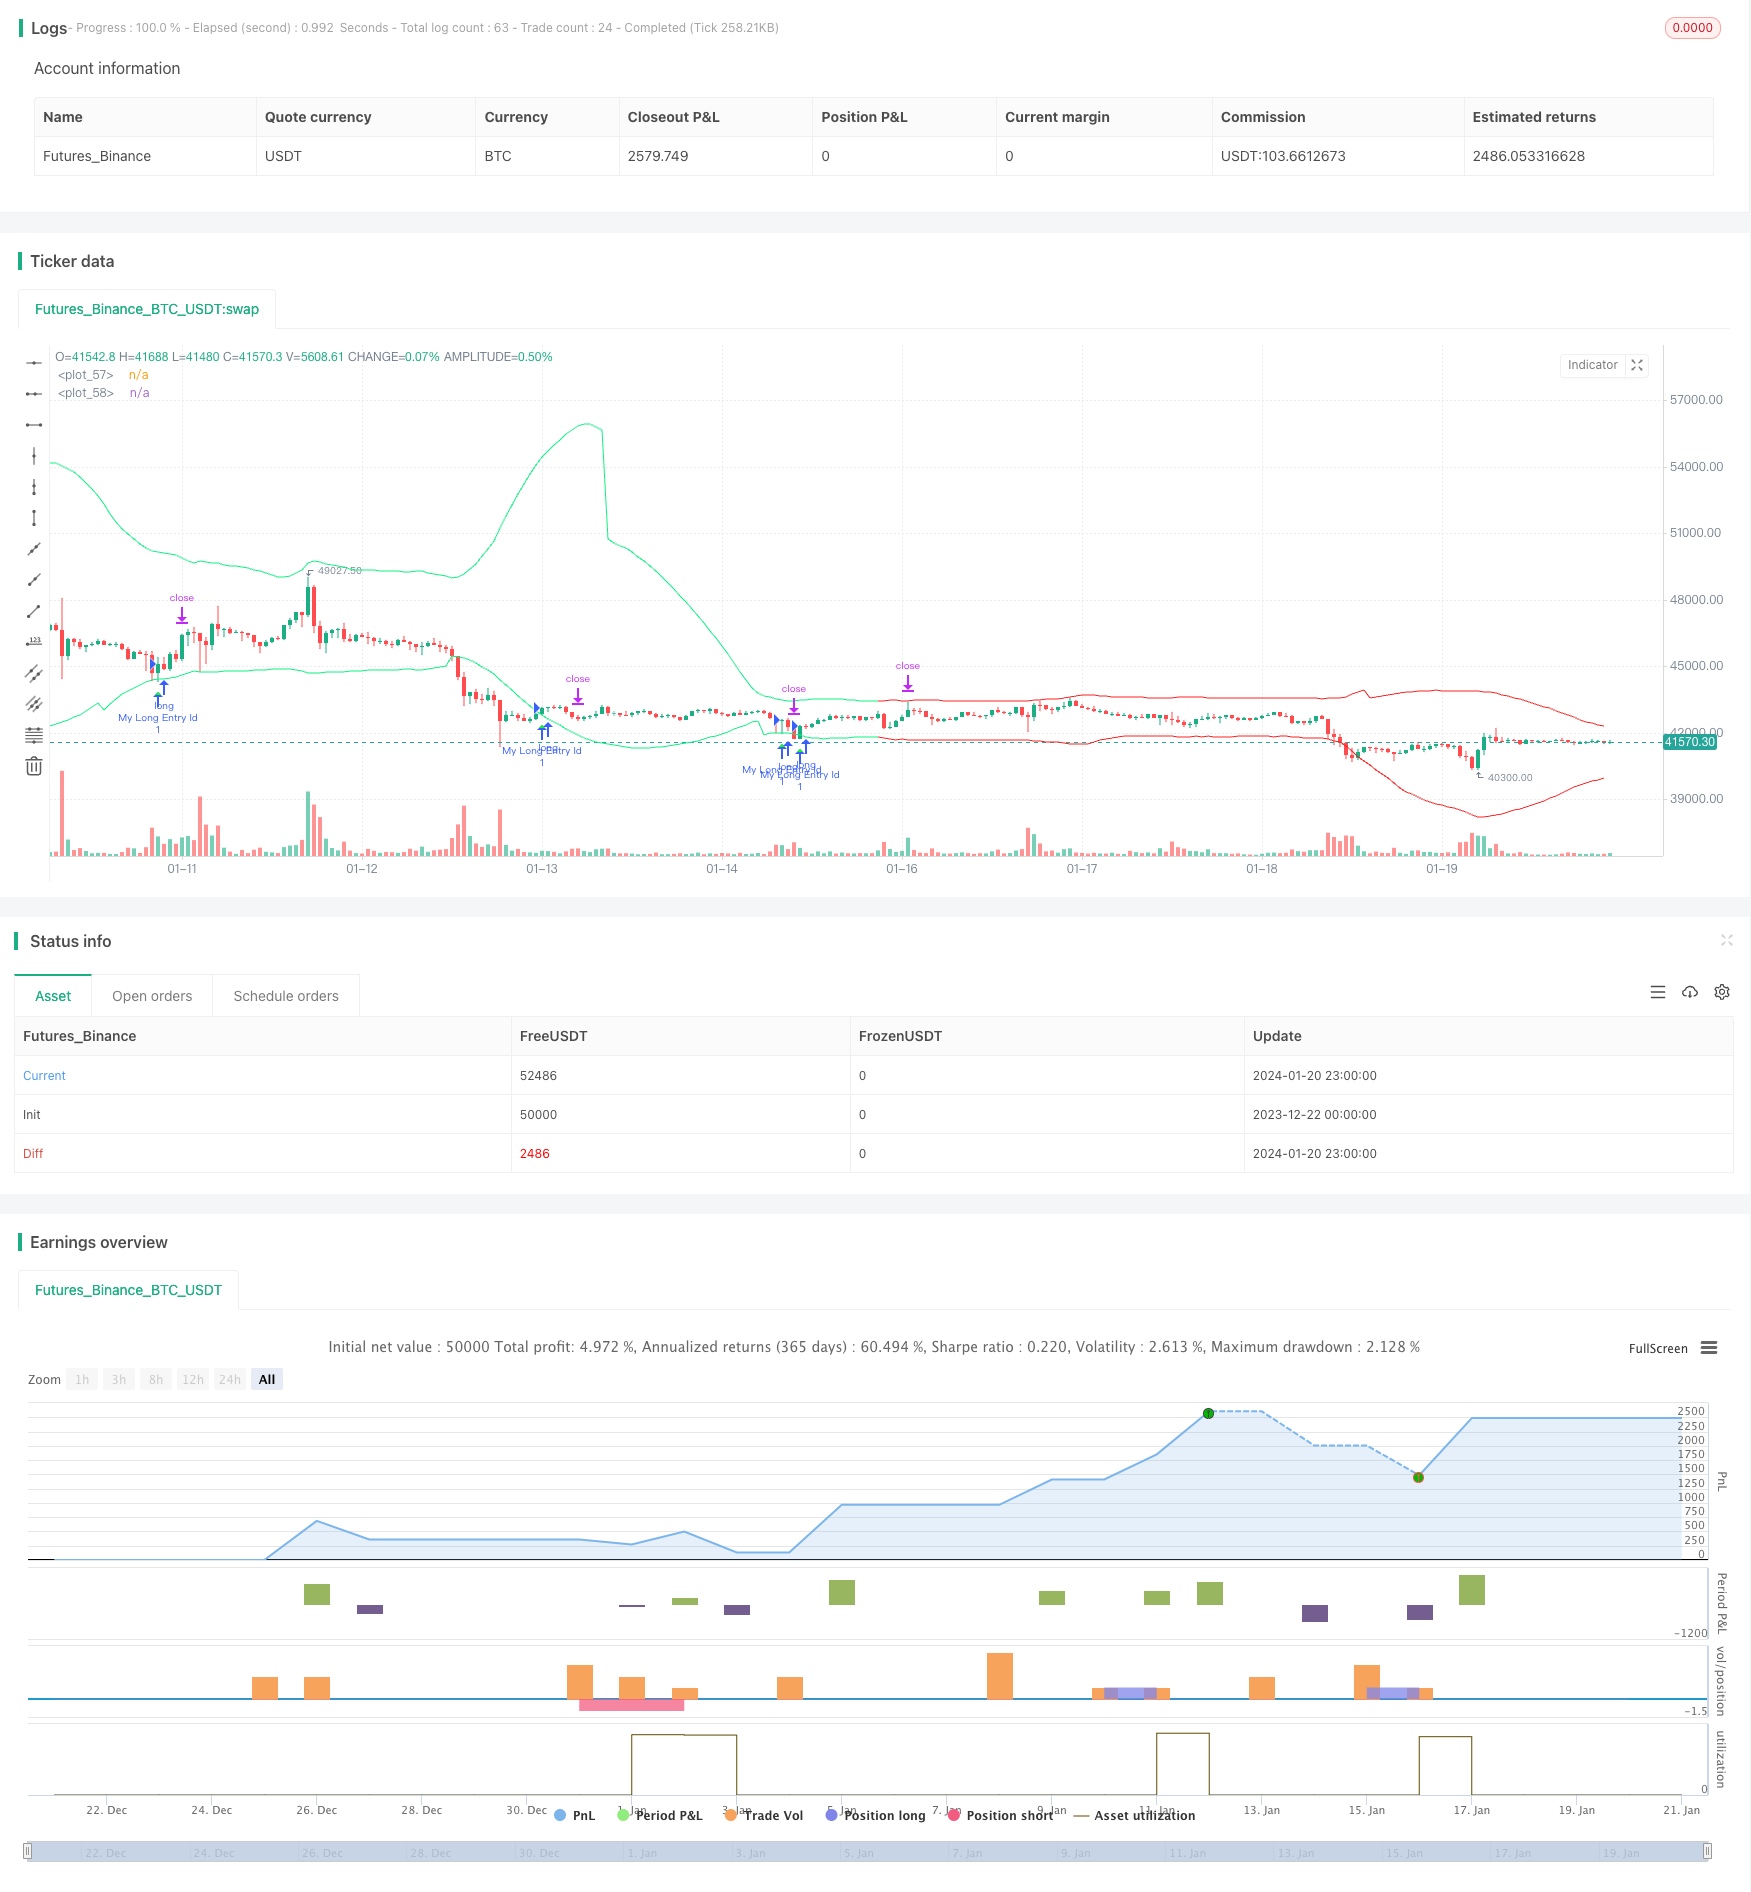
Overview
This strategy uses the pivot points of the CCI indicator to calculate dynamic support and resistance levels, and combines trend judgment to find buy and sell signals. The strategy integrates the reversal characteristics of CCI and the trend tracking ability to capture reversal points in the medium-term trend for profit.
Strategy Principle
CCI indicator can show whether the market is too weak or too strong. The two extremes of 80 and -80 can be used to determine whether the market has entered an overbought or oversold state. This strategy utilizes this characteristic of CCI. By calculating the pivot points of the left and right 50 bars, the upper and lower pivot points are obtained. Then support and resistance lines are constructed dynamically by adding or subtracting a buffer on the basis of the pivot points.
A buy signal is generated when the close is higher than the open and lower than the upper support level. A sell signal is generated when the close is lower than the open and higher than the lower resistance level. In order to filter out trading signals against the main trend direction, the strategy also combines EMA and slope indicators to determine the current main trend direction. Long entry trades are only placed when the trend is determined as bullish. Short entry trades are only placed when the trend is determined as bearish.
The stop loss and take profit are calculated dynamically based on the ATR indicator, making the risk control of this strategy more reasonable.
Advantage Analysis
- Taking advantage of the reversal characteristic of CCI, entries are made near potential reversal points, increasing the probability of profit.
- Combining with trend judgment avoids trading against the trend and reduces losses.
- Dynamic stop loss and take profit settings make risk control more sensible.
- Customizable parameters such as CCI length, buffer size, etc. adapt to more market environments.
Risk Analysis
- CCI indicator tends to generate false signals, needing the filter from trend judgment.
- Reversals do not always succeed, with certain probability of loss risk.
- Improper parameter settings may lead to over-trading or missing opportunities.
Methods like parameter optimization, adjusting stop loss range, etc. can help reduce risks. Also, this strategy can be used as an auxiliary tool for other indicators, not having to completely rely on its signals.
Optimization Directions
- Optimize buffer size to adapt to markets of different volatility levels.
- Optimize ATR period parameters for more accurate dynamic stop loss and take profit.
- Test different CCI parameter settings.
- Test the effects of other types of trend judgment indicators.
Conclusion
This strategy integrates the long/short screening ability from CCI and the filter confirmation from trend judgment, possessing certain practical value. The dynamic stop loss and take profit also makes the risk controllable when applying the strategy in actual trading. Through parameter optimization and improvements, better results can be expected.
Parameters
| Name | Default | What it controls |
|---|---|---|
| v_input_int_1 | 50 | cci length |
| v_input_int_2 | 50 | right pivot |
| v_input_int_3 | 50 | left pivot |
| v_input_float_1 | 10 | buffer |
| v_input_bool_1 | true | trend matter? |
| v_input_bool_2 | false | show mid? |
| v_input_string_1 | 0 | trend type: cross | slope |
| v_input_int_4 | 100 | slow ma length |
| v_input_int_5 | 50 | fast ma length |
| v_input_int_6 | 5 | slope's length for trend detection |
| v_input_float_2 | 1.1 | ksl |
| v_input_float_3 | 2.2 | ktp |
| v_input_timeframe_1 | D | Time Frame of Last Period for Calculating max |
Source Pine Script
/*backtest
start: 2023-12-22 00:00:00
end: 2024-01-21 00:00:00
period: 1h
basePeriod: 15m
exchanges: [{"eid":"Futures_Binance","currency":"BTC_USDT"}]
*/

// This Pine Script™ code is subject to the terms of the Mozilla Public License 2.0 at https://mozilla.org/MPL/2.0/
// © AliSignals


//@version=5
strategy("CCI based support and resistance strategy", overlay=true  )


cci_length = input.int(50, "cci length")
right_pivot = input.int(50, "right pivot")
left_pivot = input.int(50, "left pivot")
buffer = input.float(10.0, "buffer")
trend_matter = input.bool(true, "trend matter?")
showmid = input.bool ( false , "show mid?")
trend_type = input.string("cross","trend type" ,options = ["cross","slope"])
slowma_l = input.int(100, "slow ma length")
fastma_l = input.int(50, "fast ma length")
slope_l = input.int(5,  "slope's length for trend detection")
ksl = input.float(1.1)
ktp = input.float(2.2)
restf = input.timeframe(title="Time Frame of Last Period for Calculating max" , defval="D")


// Calculating Upper and Lower CCI
cci = ta.cci(hlc3,cci_length)

uppercci = 0.0
lowercci = 0.0

uppercci := fixnan(ta.pivothigh(cci, left_pivot, right_pivot)) - buffer
lowercci := fixnan(ta.pivotlow (cci, left_pivot, right_pivot)) + buffer
midccci  = math.avg(uppercci,lowercci)


// Support and Resistance based on CCI
res = uppercci*(0.015*ta.dev(hlc3,cci_length))+ ta.sma(hlc3,cci_length)
sup = lowercci*(0.015*ta.dev(hlc3,cci_length))+ ta.sma(hlc3,cci_length)
mid =  midccci*(0.015*ta.dev(hlc3,cci_length))+ ta.sma(hlc3,cci_length)


// Calculating trend
t_cross  = 0
t_cross := ta.ema(close,fastma_l) > ta.ema(close,slowma_l) ? 1 : ta.ema(close,fastma_l) < ta.ema(close,slowma_l) ? -1 : t_cross[1]

t_slope  = 0
t_slope := ta.ema(close,slowma_l) > ta.ema(close,slowma_l)[slope_l] ? 1 : ta.ema(close,slowma_l) < ta.ema(close,slowma_l)[slope_l]  ? -1 : t_slope[1]

t  = 0
t := trend_type == "cross" ? t_cross : trend_type == "slope" ? t_slope : na

colort =  trend_matter == false ? color.rgb(201, 251, 0) : t == 1 ? color.rgb(14, 243, 132) :  t == -1 ? color.rgb(255, 34, 34) : na
bull_t = trend_matter == false or t ==  1
bear_t = trend_matter == false or t == -1

plot(res, color = colort)
plot(sup, color = colort)
plot(showmid == true ? mid : na)


// Long and Short enter condition
buy  = bull_t == 1 and ta.lowest (2) < sup and close > open and close > sup
sell = bear_t == 1 and ta.highest(2) > res and close < open and close < res

plotshape( buy , color=color.rgb(6, 255, 23) , location = location.belowbar, style = shape.triangleup  , size = size.normal)
plotshape( sell, color=color.rgb(234, 4, 4) ,  location = location.abovebar, style = shape.triangledown, size = size.normal)


atr = ta.atr(100)


CLOSE=request.security(syminfo.tickerid, restf, close)
max = 0.0
max := CLOSE == CLOSE[1] ? math.max(max[1], atr) : atr
act_atr = 0.0
act_atr := CLOSE == CLOSE[1] ? act_atr[1] : max[1]

atr1 =  math.max(act_atr, atr)

dis_sl = atr1 * ksl
dis_tp = atr1 * ktp


var float longsl  = open[1] - dis_sl
var float shortsl = open[1] + dis_sl
var float longtp =   open[1] + dis_tp
var float shorttp =  open[1] - dis_tp


longCondition = buy
if (longCondition)
    strategy.entry("My Long Entry Id", strategy.long)

shortCondition = sell
if (shortCondition)
    strategy.entry("My Short Entry Id", strategy.short)


longsl  := strategy.position_size > 0  ? longsl[1]  : close - dis_sl
shortsl := strategy.position_size < 0 ? shortsl[1] : close + dis_sl
longtp  := strategy.position_size > 0  ? longtp[1]  : close + dis_tp
shorttp := strategy.position_size < 0 ? shorttp[1] : close - dis_tp


if strategy.position_size > 0
    strategy.exit(id="My Long close Id", from_entry ="My Long Entry Id" , stop=longsl, limit=longtp)
if strategy.position_size < 0
    strategy.exit(id="My Short close Id", from_entry ="My Short Entry Id" , stop=shortsl, limit=shorttp)
Published by ChaoZhang on the FMZ strategy square · last modified 2024-01-22. Collected in the Quant Trading Vault. Unvalidated research: re-test with your own data and costs before trusting it.
Build this with AgenKit
A spec is not a trading system. Paste this into your coding agent and AgenKit runs a specialist team — architecture, test-first build, risk gates, review — with paper trading on by default.
/agenkit build a production-grade trading bot with a backtest engine, risk controls and paper trading by default from strategies/Dynamic-CCI-Support-and-Resistance-Strategy.md- npx agenkit install engineering-kit in your project
- Paste the command into your agent and approve each phase
- Get tests, backtest, risk controls and a paper-trading switch
Understand it first
Before you run this, read the lesson behind the idea and how to backtest it honestly. Specs like this one are the survivors of an unknown number of trials; deflate their results accordingly.
Related specs
- MACD RSI and EMA StrategyPine Script · Mean reversion · 1d
- Advanced Momentum EMA Trend Following with RSI Overbought Oversold Trading StrategyPine Script · Mean reversion · 1d
- Oma and Apollo Dual Rail Trading StrategyPine Script · Mean reversion · 5m
- Reversal Fluctuation CAT StrategyPine Script · Mean reversion · 2h
- Bollinger Bands Trend Reversal StrategyPine Script · Mean reversion · 10m
- Dual Channel Tracking Reversal StrategyPine Script · Mean reversion · 1h