Strategy vault / Trend following
Dynamic Dual EMA Crossover Quantitative Trading Strategy
This strategy is a quantitative trading system based on the crossover of 13 and 21-period Exponential Moving Averages (EMA). It identifies market trend changes through the observation of short-term and long-term EMA…
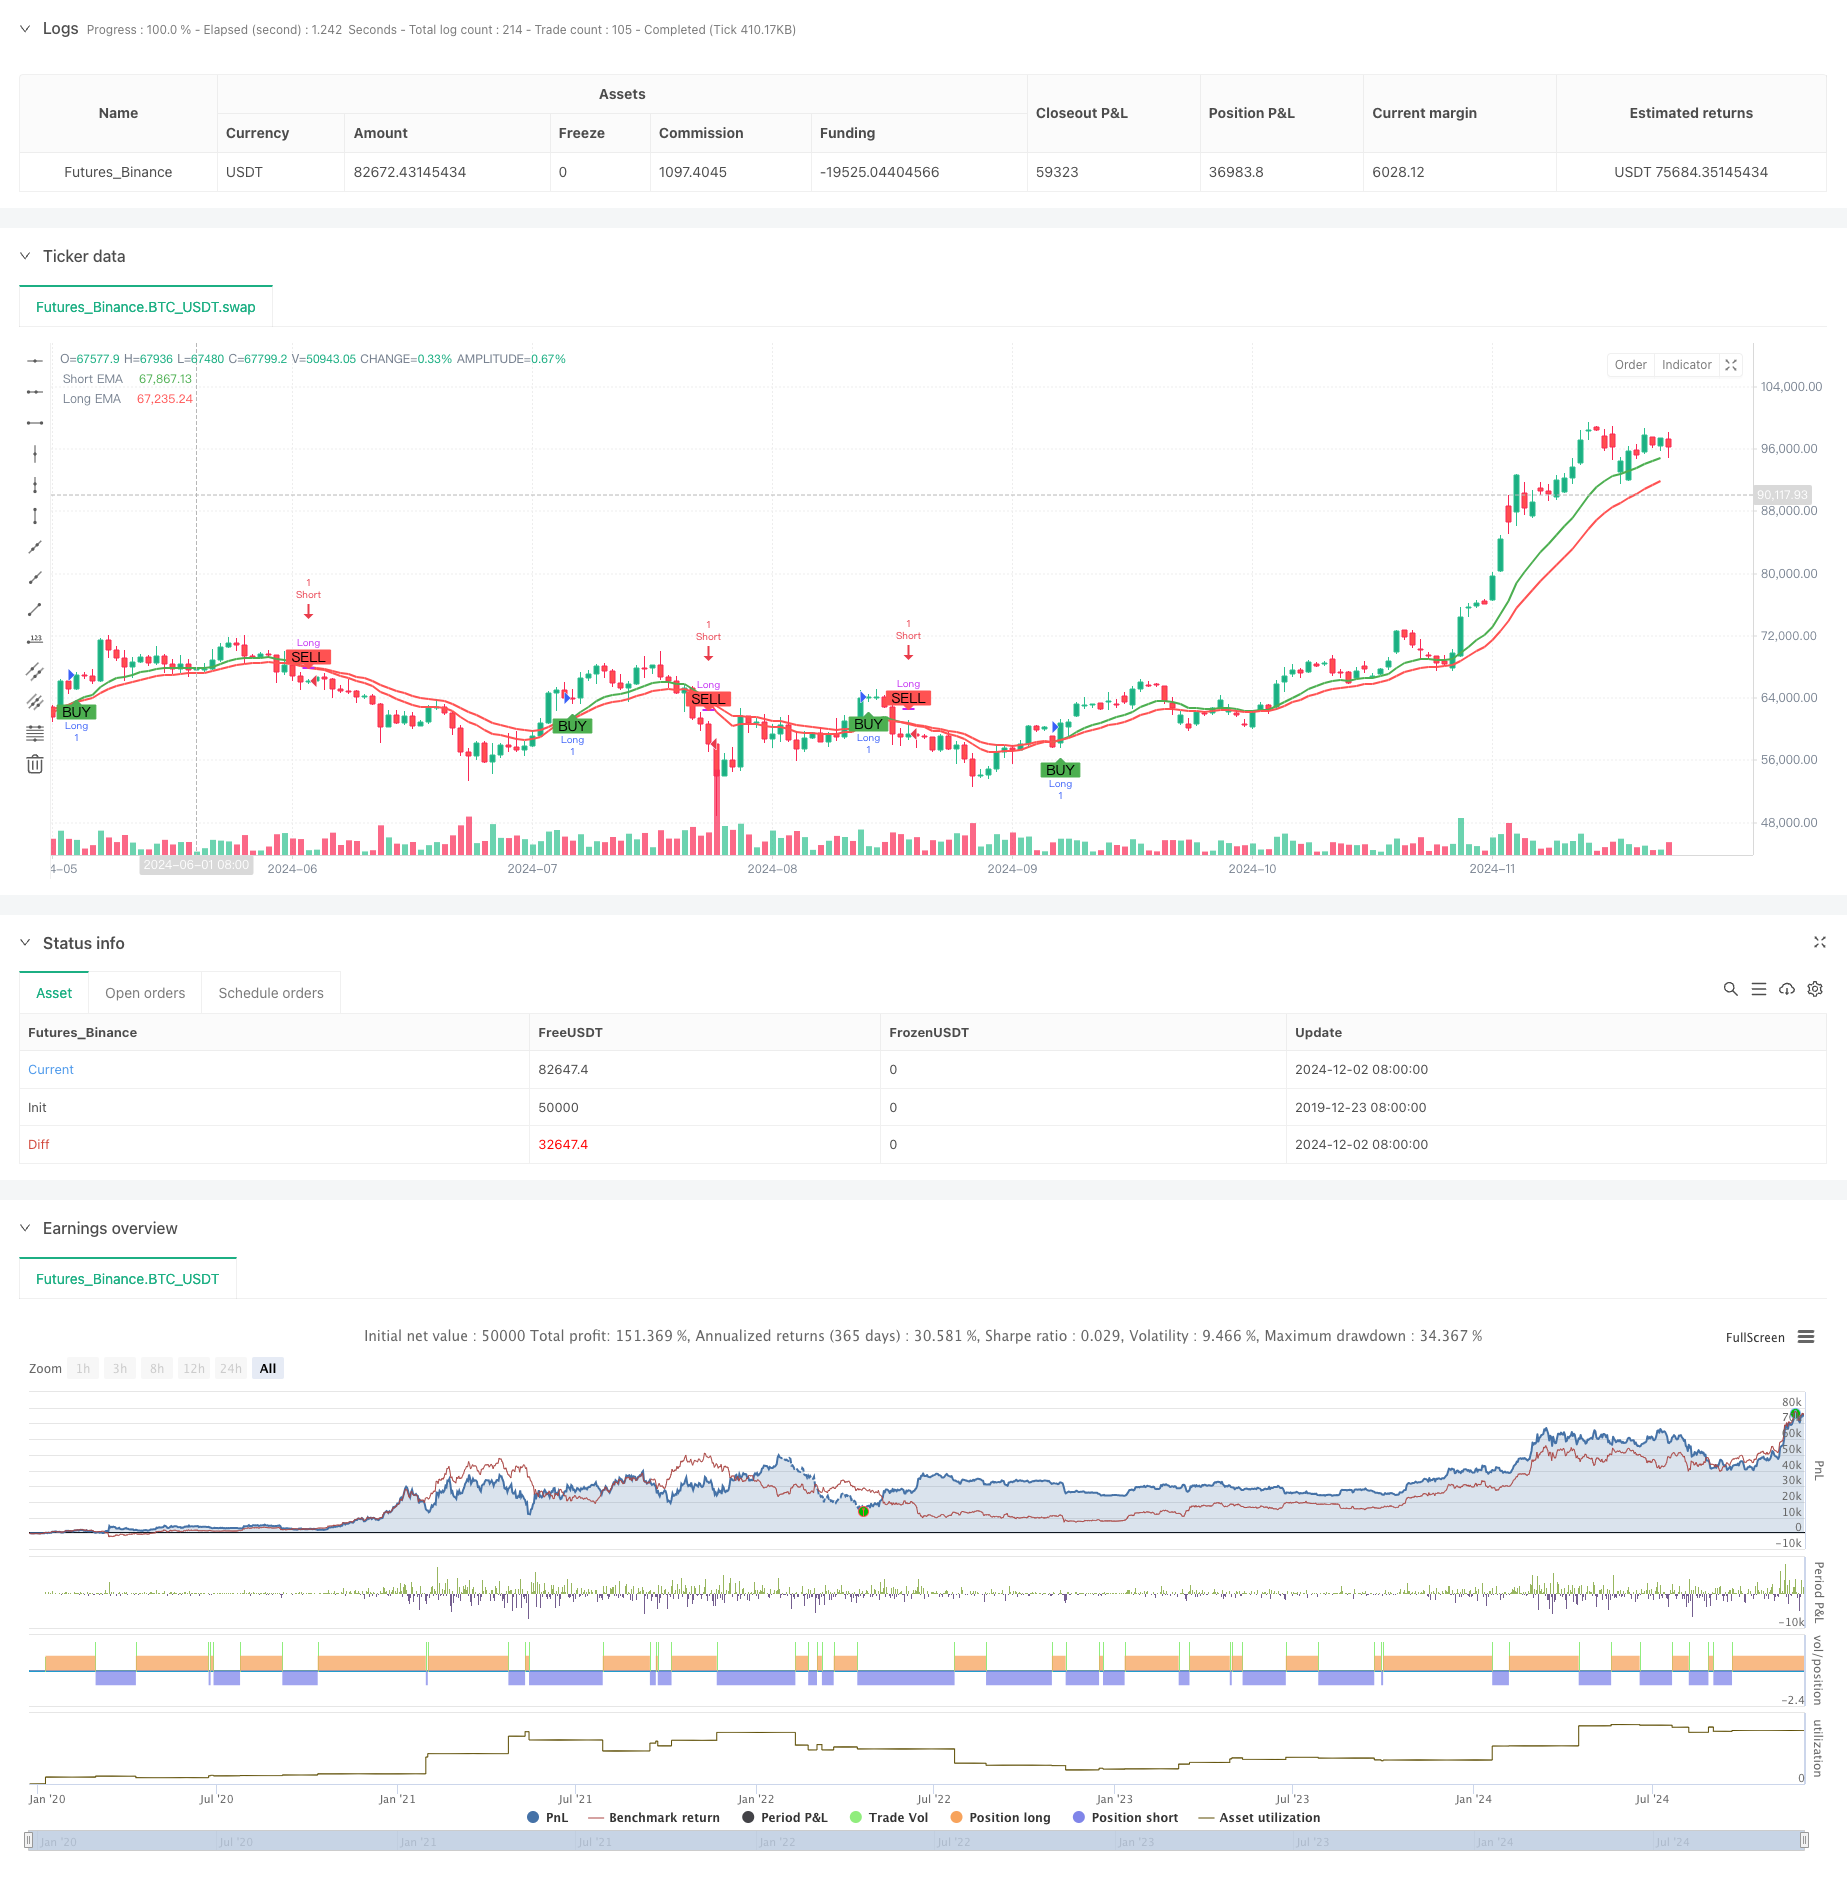
Overview
This strategy is a quantitative trading system based on the crossover of 13 and 21-period Exponential Moving Averages (EMA). It identifies market trend changes through the observation of short-term and long-term EMA crossovers, generating long positions at golden crosses and short positions at death crosses. The strategy's unique feature lies in its dynamic color changes, enhancing visual feedback and helping traders identify trading signals more intuitively.
Strategy Principle
The core logic relies on two EMAs with different periods: a 13-period short-term EMA and a 21-period long-term EMA. When the short-term EMA crosses above the long-term EMA, it forms a golden cross, indicating an uptrend formation and generating a buy signal. Conversely, when the short-term EMA crosses below the long-term EMA, it forms a death cross, indicating a downtrend formation and generating a sell signal. The strategy employs dynamic color display, changing EMA line colors upon crossovers - green for bullish signals and red for bearish signals, providing visual feedback that helps traders quickly assess market conditions.
Strategy Advantages
- Clear Signals: Generates precise buy and sell signals through EMA crossovers, eliminating subjective judgment.
- Visual Intuition: Dynamic color changes provide additional visual confirmation, making trading opportunities easier to identify.
- Trend Following: Effectively captures medium to long-term trends, suitable for trending markets.
- Simple Implementation: Clear code structure, easy to understand and maintain.
- High Automation: Fully automated trade execution, reducing human intervention.
Strategy Risks
- Choppy Market Risk: Prone to false signals in sideways, volatile markets, leading to frequent trading.
- Lag Risk: Moving averages inherently lag, potentially missing optimal entry points.
- Quick Reversal Risk: Strategy may not respond quickly enough to sudden market reversals.
- Parameter Sensitivity: Strategy performance heavily depends on EMA period selection.
Strategy Optimization Directions
- Implement Trend Strength Filtering: Add indicators like ADX to filter signals in weak trend markets.
- Add Stop Loss Mechanisms: Implement dynamic stop losses for risk control, such as ATR-based stops.
- Optimize Period Parameters: Back-test different EMA periods to adapt to various market conditions.
- Include Volume Confirmation: Incorporate volume analysis to improve signal reliability.
- Add Volatility Adjustment: Dynamically adjust position sizes based on market volatility.
Summary
The Dynamic Dual EMA Crossover Quantitative Strategy combines classic technical analysis with modern visualization techniques. It generates trading signals through EMA crossovers and enhances visual feedback through dynamic color changes, making trading decisions more intuitive. While inherent risks exist, the strategy can become an effective trading tool through proper optimization and risk management. Traders are advised to conduct thorough backtesting and adjust strategy parameters based on market conditions and personal risk tolerance before live implementation.
Source Pine Script
/*backtest
start: 2019-12-23 08:00:00
end: 2024-12-03 00:00:00
period: 1d
basePeriod: 1d
exchanges: [{"eid":"Futures_Binance","currency":"BTC_USDT"}]
*/

//@version=5
strategy("EMA Strategy by clf", overlay=true)

// Input parameters for EMAs
shortEmaLength = input(13, title="Short EMA Length")
longEmaLength = input(21, title="Long EMA Length")

// Calculate EMAs
shortEma = ta.ema(close, shortEmaLength)
longEma = ta.ema(close, longEmaLength)

// Define the color variable with type
var color emaColor = na

// Determine the colors for the EMAs based on crossovers
if (ta.crossover(shortEma, longEma))
    emaColor := color.green
else if (ta.crossunder(shortEma, longEma))
    emaColor := color.red

// Plot EMAs on the chart with dynamic colors
plot(shortEma, title="Short EMA", color=emaColor, linewidth=2)
plot(longEma, title="Long EMA", color=color.red, linewidth=2)

// Generate buy and sell signals
longCondition = ta.crossover(shortEma, longEma)
shortCondition = ta.crossunder(shortEma, longEma)

// Plot buy and sell signals
plotshape(series=longCondition, location=location.belowbar, color=color.green, style=shape.labelup, text="BUY")
plotshape(series=shortCondition, location=location.abovebar, color=color.red, style=shape.labeldown, text="SELL")

// Strategy entry and exit
strategy.entry("Long", strategy.long, when=longCondition)
strategy.close("Long", when=shortCondition)

strategy.entry("Short", strategy.short, when=shortCondition)
strategy.close("Short", when=longCondition)
Published by ChaoZhang on the FMZ strategy square · last modified 2024-12-04. Collected in the Quant Trading Vault. Unvalidated research: re-test with your own data and costs before trusting it.
Build this with AgenKit
A spec is not a trading system. Paste this into your coding agent and AgenKit runs a specialist team — architecture, test-first build, risk gates, review — with paper trading on by default.
/agenkit build a production-grade trading bot with a backtest engine, risk controls and paper trading by default from strategies/Dynamic-Dual-EMA-Crossover-Quantitative-Trading-Strategy.md- npx agenkit install engineering-kit in your project
- Paste the command into your agent and approve each phase
- Get tests, backtest, risk controls and a paper-trading switch
Understand it first
Before you run this, read the lesson behind the idea and how to backtest it honestly. Specs like this one are the survivors of an unknown number of trials; deflate their results accordingly.
Related specs
- Multi Exponential Moving Average Crossover Strategy with Volume Based ATR Dynamic Stop Loss OptimizationPine Script · Trend following · 2d
- Multi Factor Trend Price Action Strategy with Dynamic Risk Management SystemPine Script · Trend following · 2h
- DPO EMA Trend Crossover Quantitative Strategy ResearchPine Script · Trend following · 1d
- Dual EMA Crossover Trend Following Strategy with ATR and ADX FiltersPine Script · Trend following · 1d
- Advanced Multi Indicator Trend Confirmation Trading StrategyPine Script · Trend following · 1d
- Advanced Quantitative Trading Multi Moving Average Crossover System with Volume Filter StrategyPine Script · Trend following · 1d