Strategy vault / Trend following
Dynamic Moving Average Crossover Strategy
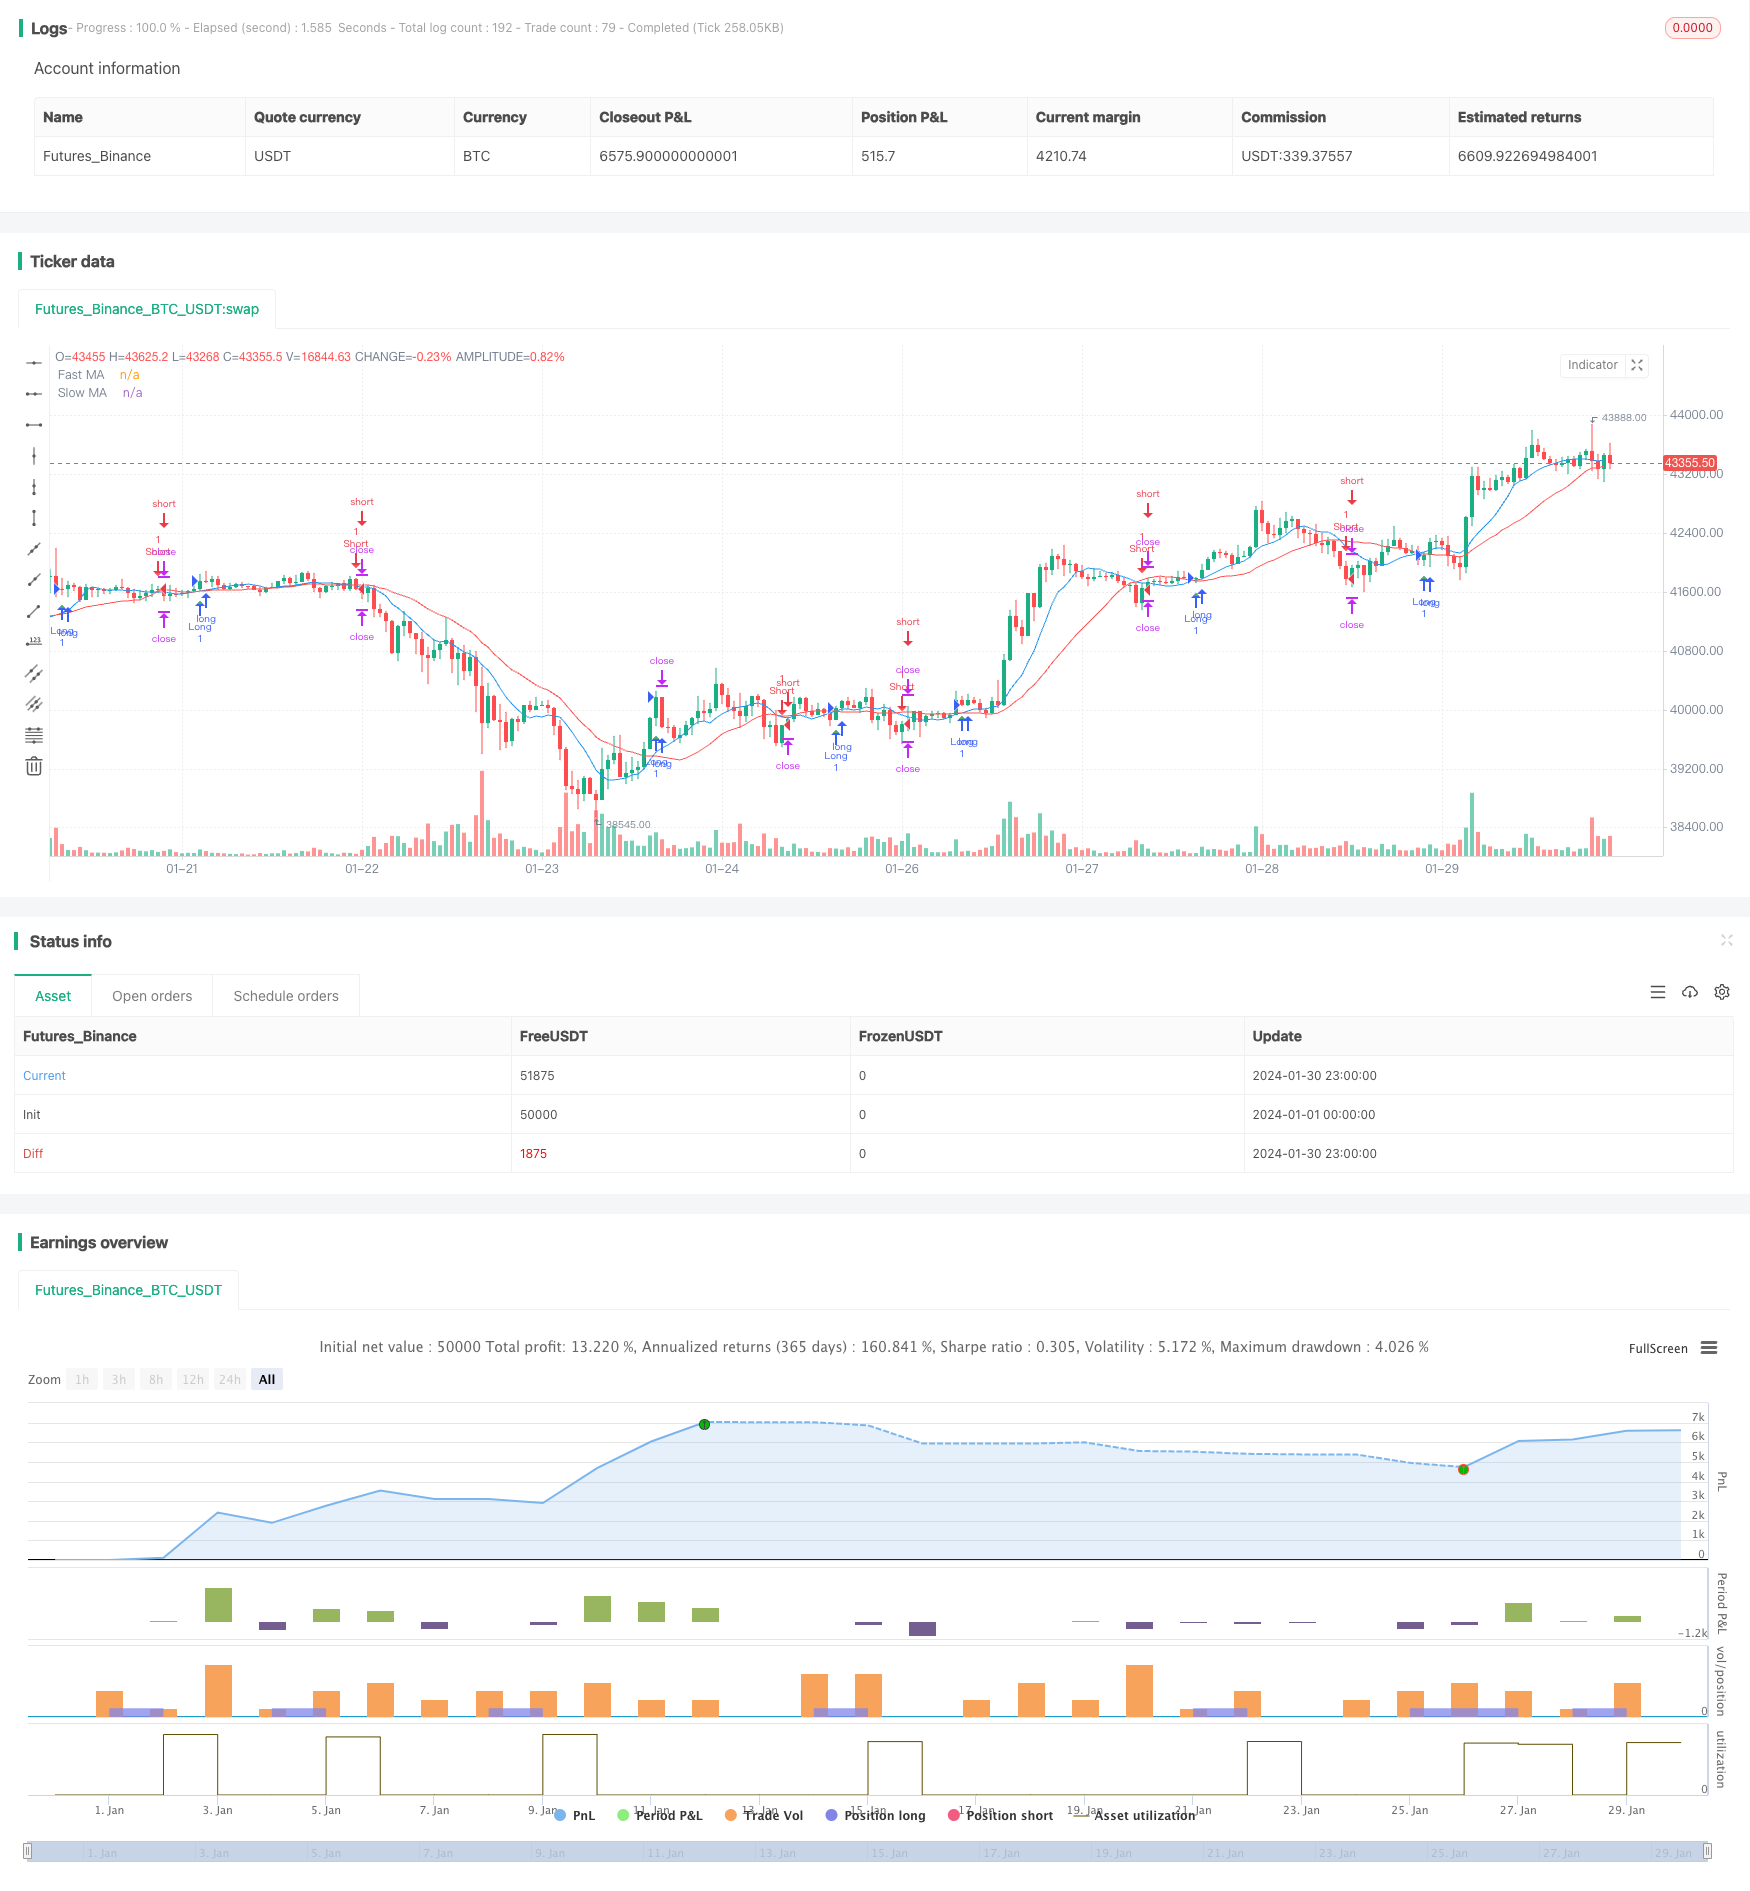
The Dynamic Moving Average Crossover Strategy is a typical trend-following strategy. It generates buy and sell signals by calculating the fast moving average (Fast MA) and slow moving average (Slow MA) and detecting…
Overview
The Dynamic Moving Average Crossover Strategy is a typical trend-following strategy. It generates buy and sell signals by calculating the fast moving average (Fast MA) and slow moving average (Slow MA) and detecting crosses between them to capture trend reversal points in the market.
Strategy Logic
The core logic of this strategy is: when the fast moving average crosses above the slow moving average from below, a buy signal is generated; when the fast moving average crosses below the slow moving average from above, a sell signal is generated.
Moving averages can effectively filter market noise and capture price trends. The fast moving average is more sensitive and can timely capture changes in the trend; the slow moving average is more stable and can effectively filter out the impact of short-term fluctuations. When the fast and slow MAs have a golden cross (moving up from below), it indicates that the market has entered a bullish phase; when they see a death cross (moving down from above), it indicates that the market has entered a bearish phase.
This strategy will immediately issue trading signals when the moving averages cross, adopt a trend-chasing strategy to follow market trends and earn bigger profits. At the same time, the strategy sets stop loss and take profit to strictly control risks.
Advantage Analysis
- Good backtest performance of the strategy, capturing big moves by following trends
- Clear signals generated by moving average crosses, easy to implement
- With stop loss and take profit to strictly control risks
Risk Analysis
- Prone to signal errors and suffering severe losses
- High trading frequency, short holding periods
- Need reasonable parameter settings
Improvements can be made by optimizing parameters, adjusting the moving average periods, adding filter conditions etc.
Optimization Directions
- Adjust moving average parameters to find optimal parameter combinations
- Add momentum indicators etc. as filters to reduce false signals
- Optimize stop loss and take profit settings
- Combine other indicators to determine trend direction
Conclusion
The Dynamic Moving Average Crossover Strategy overall performs quite well. Further improvements can be made by optimizing parameters. The strategy is easy to implement and suitable for beginner's practice. But the risk of false signals should be watched out for, and needs to be used together with other indicators to perform better.
Parameters
| Name | Default | What it controls |
|---|---|---|
| v_input_int_1 | 9 | Fast MA Length |
| v_input_int_2 | 21 | Slow MA Length |
| v_input_float_1 | true | Stop Loss (%) |
| v_input_float_2 | 2 | Take Profit (%) |
Source Pine Script
/*backtest
start: 2024-01-01 00:00:00
end: 2024-01-31 00:00:00
period: 1h
basePeriod: 15m
exchanges: [{"eid":"Futures_Binance","currency":"BTC_USDT"}]
*/

//@version=5
strategy("Simple Moving Average Crossover", shorttitle="SMAC", overlay=true)

// Define input parameters
fast_length = input.int(9, title="Fast MA Length")
slow_length = input.int(21, title="Slow MA Length")
stop_loss = input.float(1, title="Stop Loss (%)", minval=0, maxval=100)
take_profit = input.float(2, title="Take Profit (%)", minval=0, maxval=100)

// Calculate moving averages
fast_ma = ta.sma(close, fast_length)
slow_ma = ta.sma(close, slow_length)

// Define conditions for long and short signals
long_condition = ta.crossover(fast_ma, slow_ma)
short_condition = ta.crossunder(fast_ma, slow_ma)

// Plot moving averages on the chart
plot(fast_ma, title="Fast MA", color=color.blue)
plot(slow_ma, title="Slow MA", color=color.red)

// Execute long and short trades
if (long_condition)
    strategy.entry("Long", strategy.long)
if (short_condition)
    strategy.entry("Short", strategy.short)

// Set stop loss and take profit levels
stop_loss_price = close * (1 - stop_loss / 100)
take_profit_price = close * (1 + take_profit / 100)
strategy.exit("Take Profit/Stop Loss", stop=stop_loss_price, limit=take_profit_price)

// Plot signals on the chart
plotshape(series=long_condition, title="Buy Signal", location=location.belowbar, color=color.green, style=shape.triangleup, size=size.small)
plotshape(series=short_condition, title="Sell Signal", location=location.abovebar, color=color.red, style=shape.triangledown, size=size.small)
Published by ChaoZhang on the FMZ strategy square · last modified 2024-02-01. Collected in the Quant Trading Vault. Unvalidated research: re-test with your own data and costs before trusting it.
Build this with AgenKit
A spec is not a trading system. Paste this into your coding agent and AgenKit runs a specialist team — architecture, test-first build, risk gates, review — with paper trading on by default.
/agenkit build a production-grade trading bot with a backtest engine, risk controls and paper trading by default from strategies/Dynamic-Moving-Average-Crossover-Strategy.md- npx agenkit install engineering-kit in your project
- Paste the command into your agent and approve each phase
- Get tests, backtest, risk controls and a paper-trading switch
Understand it first
Before you run this, read the lesson behind the idea and how to backtest it honestly. Specs like this one are the survivors of an unknown number of trials; deflate their results accordingly.
Related specs
- ADX MA and EMA Long Only Trend Tracking StrategyPine Script · Trend following · 1d
- ATR and Moving Average Crossover Hybrid StrategyPine Script · Trend following · 1h
- Adaptive FVG Detection and MA Trend Trading Strategy with Dynamic ResistancePine Script · Trend following · 1d
- Adaptive Risk Management Strategy Based on Dynamic ATR and Moving Average CrossoverPine Script · Trend following · 2h
- Adaptive Trading Strategy Based on Stochastic RSI Dual Line CrossoverPine Script · Trend following · 4h
- Adaptive Volatility Based Trend Following Short Strategy with Time Delay and Stop Loss ProtectionPine Script · Trend following · 2m