Strategy vault / Trend following
Dynamic Moving Average Trend Crossover Strategy
The Dynamic Moving Average Trend Crossover Strategy is a trading system based on the Moving Average Convergence Divergence (MACD) indicator. This strategy relies on the difference between short-term and long-term…
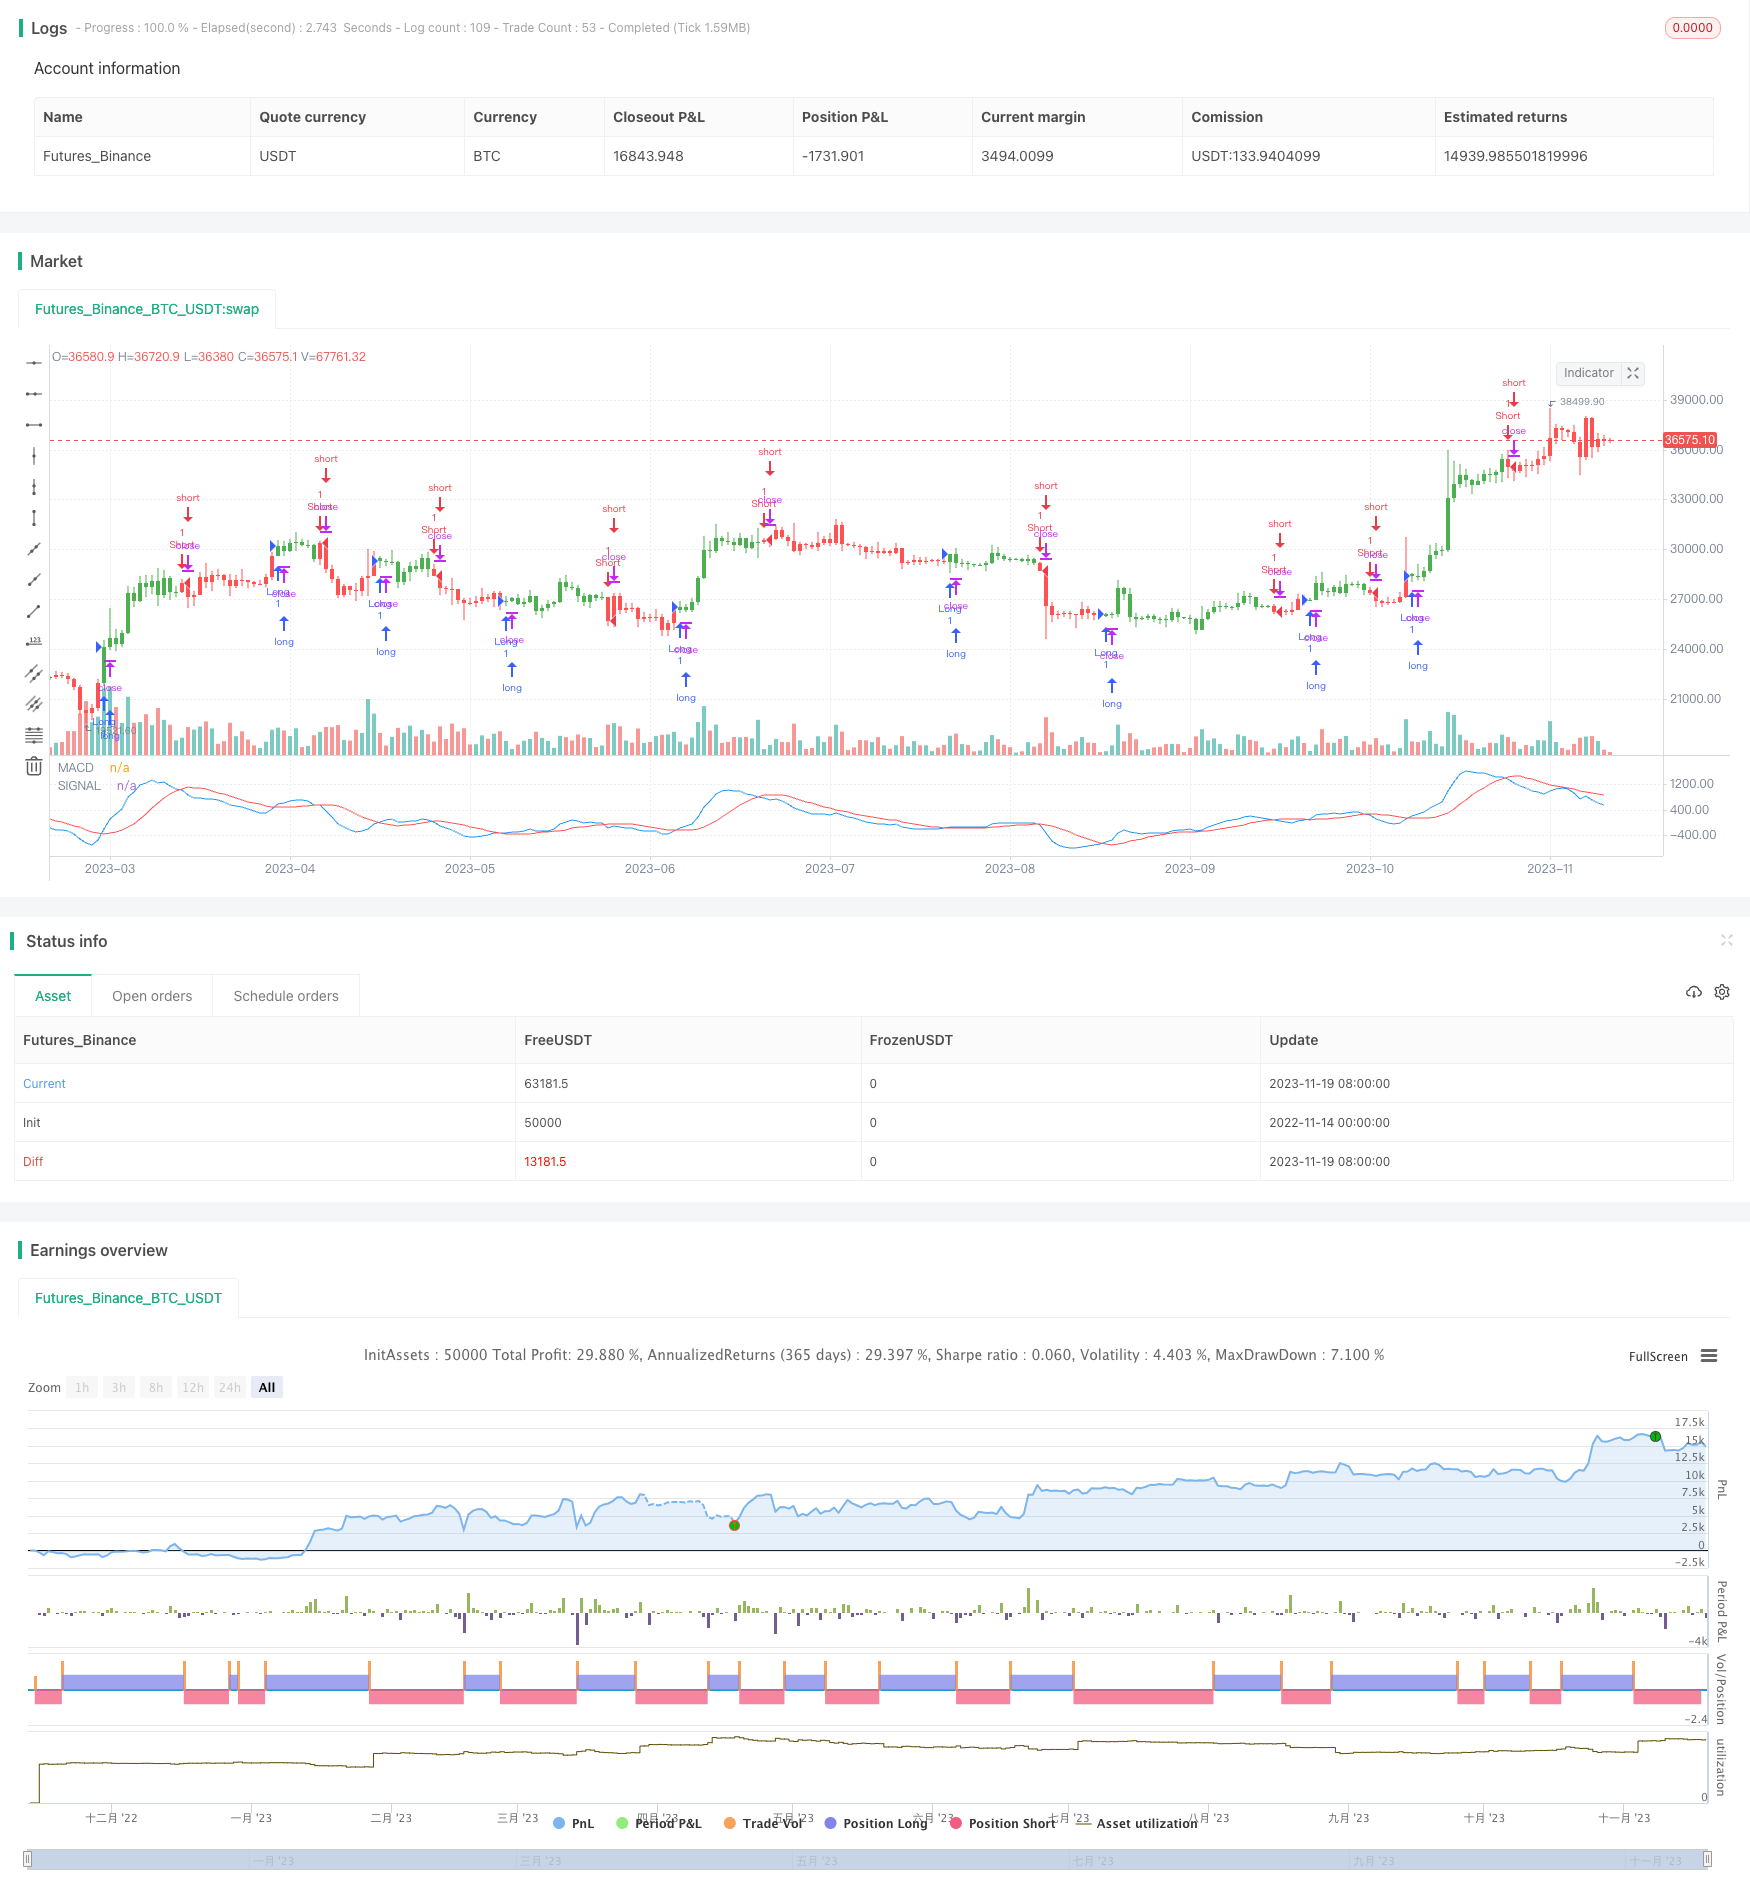
Overview
The Dynamic Moving Average Trend Crossover Strategy is a trading system based on the Moving Average Convergence Divergence (MACD) indicator. This strategy relies on the difference between short-term and long-term moving averages to make buy or sell decisions, with the main idea being the monitoring of the relationship between short-term and long-term trends to predict potential market changes.
Strategy Principle
This strategy utilizes two different period Exponential Moving Averages (EMA): a fast EMA (8 days) and a slow EMA (16 days). The MACD value is derived from the difference between these two EMAs. Additionally, the strategy incorporates a signal line, which is the Simple Moving Average (SMA) of the MACD over 11 days. A buy signal is generated when the MACD line crosses above the signal line, indicating a bullish trend, and a sell signal when it crosses below, indicating a bearish trend.
At the code level, the strategy calculates the fast and slow EMAs, then derives the MACD value. Subsequently, the MACD's SMA is calculated as the signal line. The position is determined by comparing the position of the MACD to the signal line. Moreover, the strategy offers a reverse trading option, allowing entry into the market on opposite signals.
Strategy Advantages
The main advantage of the Dynamic Moving Average Trend Crossover Strategy lies in its simplicity and sensitivity to changes in market trends. By using EMAs of different periods, this strategy effectively captures deviations between short-term and long-term trends, thus responding timely to market changes. The addition of the signal line further enhances the accuracy of the strategy, enabling investors to identify trend reversals more quickly.
Risk Analysis
While the Dynamic Moving Average Trend Crossover Strategy performs well in many situations, it also carries certain risks. The primary risk is the generation of misleading signals in highly volatile markets or during unclear trends. Additionally, reliance on historical data may lead to delayed responses. To mitigate these risks, investors can combine the strategy with other technical indicators or market analyses for decision-making.
Optimization Directions
Optimization of this strategy can include adjusting the lengths of the EMA periods, incorporating additional technical indicators, and considering market volatility factors. Adjusting the period lengths can make the strategy more adaptable to different market conditions. Introducing other indicators, such as
RSI or Bollinger Bands, can provide a more comprehensive view of the market. Considering market volatility factors, such as adjusting the strategy with ATR, can enhance the adaptability and robustness of the strategy.
Conclusion
The Dynamic Moving Average Trend Crossover Strategy is a quantitative trading strategy centered around the MACD. It aims to grasp market movements by analyzing the relationship between short-term and long-term trends. While this strategy is straightforward and effective, it is important to be aware of its limitations and potential risks. By continuously optimizing and integrating other analytical tools, investors can better utilize this strategy for effective market operations.
Parameters
| Name | Default | What it controls |
|---|---|---|
| v_input_1 | 8 | fastLength |
| v_input_2 | 16 | slowLength |
| v_input_3 | 11 | signalLength |
| v_input_4 | false | Trade reverse |
Source Pine Script
/*backtest
start: 2022-11-14 00:00:00
end: 2023-11-20 00:00:00
period: 1d
basePeriod: 1h
exchanges: [{"eid":"Futures_Binance","currency":"BTC_USDT"}]
*/

//@version=2
////////////////////////////////////////////////////////////
//  Copyright by HPotter v1.0 06/09/2017
// MACD – Moving Average Convergence Divergence. The MACD is calculated
// by subtracting a 26-day moving average of a security's price from a
// 12-day moving average of its price. The result is an indicator that
// oscillates above and below zero. When the MACD is above zero, it means
// the 12-day moving average is higher than the 26-day moving average.
// This is bullish as it shows that current expectations (i.e., the 12-day
// moving average) are more bullish than previous expectations (i.e., the
// 26-day average). This implies a bullish, or upward, shift in the supply/demand
// lines. When the MACD falls below zero, it means that the 12-day moving average
// is less than the 26-day moving average, implying a bearish shift in the
// supply/demand lines.
// A 9-day moving average of the MACD (not of the security's price) is usually
// plotted on top of the MACD indicator. This line is referred to as the "signal"
// line. The signal line anticipates the convergence of the two moving averages
// (i.e., the movement of the MACD toward the zero line).
// Let's consider the rational behind this technique. The MACD is the difference
// between two moving averages of price. When the shorter-term moving average rises
// above the longer-term moving average (i.e., the MACD rises above zero), it means
// that investor expectations are becoming more bullish (i.e., there has been an
// upward shift in the supply/demand lines). By plotting a 9-day moving average of
// the MACD, we can see the changing of expectations (i.e., the shifting of the
// supply/demand lines) as they occur.
//  You can change long to short in the Input Settings
//  WARNING:
//  - For purpose educate only
//  - This script to change bars colors.
////////////////////////////////////////////////////////////
strategy(title="MACD Crossover", shorttitle="MACD Crossover")
fastLength = input(8, minval=1)
slowLength = input(16,minval=1)
signalLength=input(11,minval=1)
reverse = input(false, title="Trade reverse")
// hline(0, color=purple, linestyle=dashed)
fastMA = ema(close, fastLength)
slowMA = ema(close, slowLength)
macd = fastMA - slowMA
signal = sma(macd, signalLength)
pos = iff(signal < macd , 1,
	   iff(signal > macd, -1, nz(pos[1], 0)))
possig = iff(reverse and pos == 1, -1,
          iff(reverse and pos == -1, 1, pos))
if (possig == 1)
    strategy.entry("Long", strategy.long)
if (possig == -1)
    strategy.entry("Short", strategy.short)
barcolor(possig == -1 ? red: possig == 1 ? green : blue )
plot(signal, color=red, title="SIGNAL")
plot(macd, color=blue, title="MACD")
Published by ChaoZhang on the FMZ strategy square · last modified 2023-11-21. Collected in the Quant Trading Vault. Unvalidated research: re-test with your own data and costs before trusting it.
Build this with AgenKit
A spec is not a trading system. Paste this into your coding agent and AgenKit runs a specialist team — architecture, test-first build, risk gates, review — with paper trading on by default.
/agenkit build a production-grade trading bot with a backtest engine, risk controls and paper trading by default from strategies/Dynamic-Moving-Average-Trend-Crossover-Strategy.md- npx agenkit install engineering-kit in your project
- Paste the command into your agent and approve each phase
- Get tests, backtest, risk controls and a paper-trading switch
Understand it first
Before you run this, read the lesson behind the idea and how to backtest it honestly. Specs like this one are the survivors of an unknown number of trials; deflate their results accordingly.
Related specs
- Bollinger Bands and RSI Trend Following StrategyPine Script · Trend following · 1h
- EMA and RSI Trend Trading StrategyPine Script · Trend following · 1d
- Multi Indicator Trend Following Strategy with Dynamic Risk ManagementPine Script · Trend following · 2h
- Multi Technical Indicator Moving Average Crossover Trend Following Quantitative Trading StrategyPine Script · Trend following · 1h
- Moving Vegas Channel Crossover StrategyPine Script · Trend following · 1d
- Three RSI Moving Average Bands StrategyPine Script · Trend following · 1h