Strategy vault / Trend following
Dynamic Moving Average Trend Trading Strategy
This strategy is based on the Dynamic Moving Average indicator, combined with Bollinger Bands and RSI for trade signal filtering. It implements a trend following long only strategy. The strategy judges the trend by…
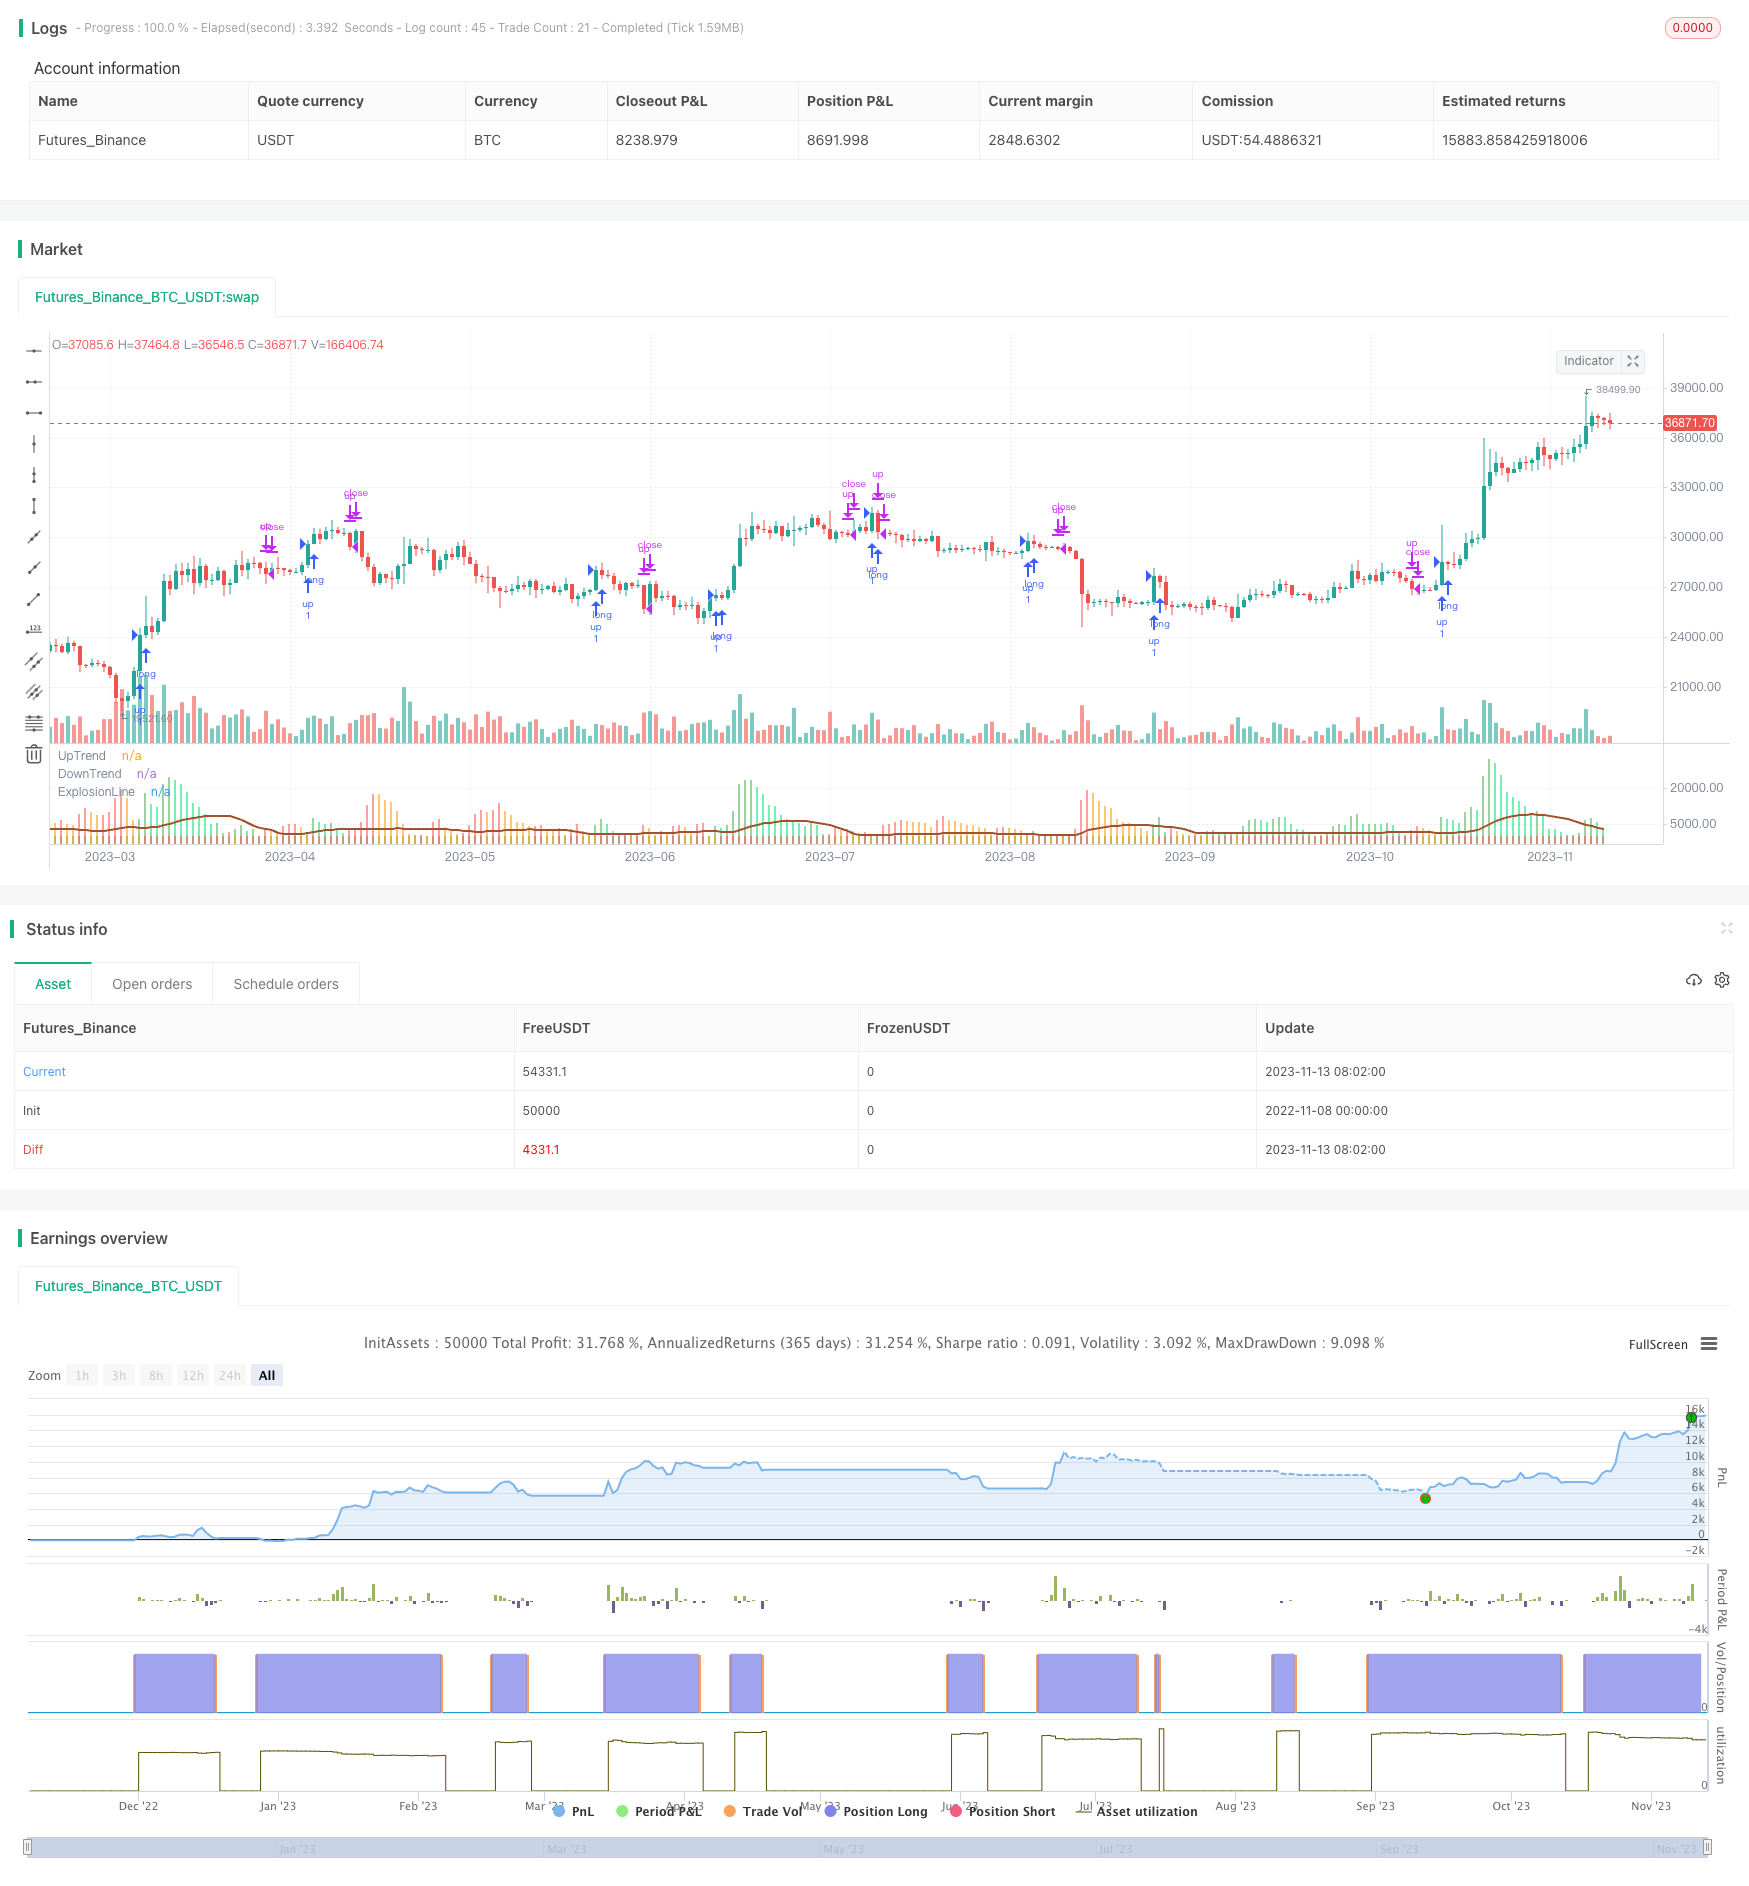
Overview
This strategy is based on the Dynamic Moving Average indicator, combined with Bollinger Bands and RSI for trade signal filtering. It implements a trend following long only strategy. The strategy judges the trend by calculating the change of Heiken Ashi closing price Dynamic Moving Average and compares it with Bollinger Bands to generate trade signals. With the RSI filter, it can effectively identify trend explosive points for trend tracking.
Strategy Logic
The core of this strategy is to calculate the change of Heiken Ashi closing price Dynamic Moving Average. Specifically, it calculates the difference between the current bar's MA and the MA of previous two bars, then multiplies it by a sensitivity coefficient to get the accurate MA change value.
Then this change value is compared with the difference between Bollinger Bands upper band and lower band. If the MA change is greater than the BB difference, it is considered as a "trend explosion". When the explosion is positive, i.e. the MA change is positive, it generates a long signal and green bar. When the explosion is negative, i.e. the MA change is negative, it generates a close signal and red bar.
In addition, this strategy has a RSI filter that only allows long signals when RSI is higher than a threshold, avoiding the risk of trend reversal.
Advantages
- Dynamic MA to effectively track trend changes
- BB as a dynamic indicator combined with MA for better trend explosion identification
- RSI filter avoids false signals from low rebounds
- Long only suitable for persistent bull market
- Flexible adjustable parameters for different products and timeframes
Risks
- Long only cannot profit from downtrend
- Overly dependent on parameter optimization for different products and timeframes
- Unable to capture trend reversal effectively, may lead to large losses
- Improper RSI filter settings may miss trading opportunities
- High sensitivity may generate noisy trades
Risk control methods include: proper parameter tuning for robustness, combining other indicators to judge trend reversal, use only in clear long-term trends, etc.
Optimization Directions
There is some room for further optimization:
Try different price sources like close, moving averages etc. for better smoothing
Adjust MA and BB period parameters for optimization across different products
Try ratio relationship instead of sensitivity coefficient for more intuitive indicator value
Add other filters like trendlines, volume etc. to improve signal quality
Develop short strategy based on indicator patterns
Incorporate stop loss mechanisms for better risk control
Conclusion
Overall this is a relatively stable trend following strategy. It uses dynamic moving average to determine trend direction, BB to identify explosive points, RSI to filter false signals, realizing a long only trend system. But it also has some risks, requiring parameter tuning for different products and timeframes, and inability to profit from downtrends. There is room for further improvements like enhancing signal quality, developing short strategy, adding stop loss etc. to achieve better performance.
Parameters
| Name | Default | What it controls |
|---|---|---|
| v_input_1 | 150 | Sensitivity |
| v_input_2 | 20 | MacD FastEMA Length |
| v_input_3 | 40 | MacD SlowEMA Length |
| v_input_4 | 20 | BB Channel Length |
| v_input_5 | 1.5 | BB Stdev Multiplier |
| v_input_6 | 40 | RSI Value trade filter |
Source Pine Script
/*backtest
start: 2022-11-08 00:00:00
end: 2023-11-14 00:00:00
period: 1d
basePeriod: 1h
exchanges: [{"eid":"Futures_Binance","currency":"BTC_USDT"}]
*/

//@version=5

///////////Original Script Courtesy of Lazy_Bear.... Absolute Legend\\\\\\\\\\\\\\\

strategy('SmoothedWaddah', overlay=false, initial_capital=1)
sensitivity = input(150, title='Sensitivity')
fastLength = input(20, title='MacD FastEMA Length')
slowLength = input(40, title='MacD SlowEMA Length')
channelLength = input(20, title='BB Channel Length')
mult = input(1.5, title='BB Stdev Multiplier')
RSI14filter = input(40, title='RSI Value trade filter')

////////////MacD Calculation of price//////////////////////////////
calc_macd(source, fastLength, slowLength) =>
    fastMA = ta.ema(source, fastLength)
    slowMA = ta.ema(source, slowLength)
    fastMA - slowMA

/////////BolingerBand Calculation of Price///////////////////////
calc_BBUpper(source, length, mult) =>
    basis = ta.sma(source, length)
    dev = mult * ta.stdev(source, length)
    basis + dev

calc_BBLower(source, length, mult) =>
    basis = ta.sma(source, length)
    dev = mult * ta.stdev(source, length)
    basis - dev

//////heinkenashi chart call for closing price "smoothing mechanism"\\\\\\\\\\\\\\\\\\\\\\\\\\\
point = request.security(ticker.heikinashi(syminfo.tickerid), timeframe.period, close)

////////////////////T1 is change in MacD current  candle from previous candle Sensitivy amplifies calculation/////////////////////
t1 = (calc_macd(point, fastLength, slowLength) - calc_macd(point[1], fastLength, slowLength)) * sensitivity
//////////////////////T2 is  T1 from two candles prior\\\\\\\\\\\\\\\\\\\\\\\\\\\
t2 = (calc_macd(point[2], fastLength, slowLength) - calc_macd(point[3], fastLength, slowLength)) * sensitivity

////////////////E1 is difference in bolinger band upper and lower...E2 is E1 from one candle prior not needed//////////////
e1 = calc_BBUpper(ohlc4, channelLength, mult) - calc_BBLower(ohlc4, channelLength, mult)
//e2 = (calc_BBUpper(close[1], channelLength, mult) - calc_BBLower(close[1], channelLength, mult))

//////signal bar printing.. Up if MacD positive .. Down if MacD negative//////////
trendUp = t1 >= 0 ? t1 : 0
trendDown = t1 < 0 ? -1 * t1 : 0

///////plots difference in macD*Sensitivity, color change if increasing or decreasing.
//////color is green/lime if explosion is up \ color is red/orange if explosion is down/////////
plot(trendUp, style=plot.style_columns, linewidth=1, color=trendUp < trendUp[1] ? color.new(color.lime,45) : color.new(color.green,45), title='UpTrend')
plot(trendDown, style=plot.style_columns, linewidth=1, color=trendDown < trendDown[1] ? color.new(color.orange,45) : color.new(color.red,45), title='DownTrend')
plot(e1, style=plot.style_line, linewidth=2, color=color.new(#A0522D, 0), title='ExplosionLine')


////////////Entry conditions and Concept/////////////////////
////////////Long Only System. T1 is measuring the distance between MACD EMA's. This is Multiplied
////////////by the sensitivity so that it can be compared to the difference between BollingerBand.
/////////////{this could have been a ratio maybe i will work with that in a different script.}
/////////////I found that 135-175 sensitivy allows for values to be compared on most charts.....
////////////If the (difference between the EMA)*(Sensitivity) is greater than (BB upper line- BB lower line)
////////////it is considered an explosion in either the downside or the upside.The indicator will print
///////////a bar higher than the trigger line either green or red (up or down respectively)//////////////////

longCondition = trendUp > e1 and ta.rsi(close, 14) > RSI14filter
if longCondition
    strategy.entry('up', strategy.long)

strategy.close('up', trendDown > e1)
Published by ChaoZhang on the FMZ strategy square · last modified 2023-11-15. Collected in the Quant Trading Vault. Unvalidated research: re-test with your own data and costs before trusting it.
Build this with AgenKit
A spec is not a trading system. Paste this into your coding agent and AgenKit runs a specialist team — architecture, test-first build, risk gates, review — with paper trading on by default.
/agenkit build a production-grade trading bot with a backtest engine, risk controls and paper trading by default from strategies/Dynamic-Moving-Average-Trend-Trading-Strategy.md- npx agenkit install engineering-kit in your project
- Paste the command into your agent and approve each phase
- Get tests, backtest, risk controls and a paper-trading switch
Understand it first
Before you run this, read the lesson behind the idea and how to backtest it honestly. Specs like this one are the survivors of an unknown number of trials; deflate their results accordingly.
Related specs
- Multiple Timeframe Filtered Trend Following StrategyPine Script · Trend following · 1h
- Quantitative Trend Tracking StrategyPine Script · Trend following · 5h
- Bollinger Bands and RSI Trend Following StrategyPine Script · Trend following · 1h
- EMA and RSI Trend Trading StrategyPine Script · Trend following · 1d
- Incremental Order Size Fibonacci Retracement Trend Following StrategyPine Script · Trend following · 1d
- Multi Indicator Trend Following Strategy with Dynamic Risk ManagementPine Script · Trend following · 2h