Strategy vault / Mean reversion
Dynamic PSAR Stock Fluctuation Tracking Strategy
This strategy implements a simple and efficient stock fluctuation tracking and automatic take profit/stop loss strategy based on the Parabolic SAR indicator. It can dynamically track the uptrend and downtrend of…
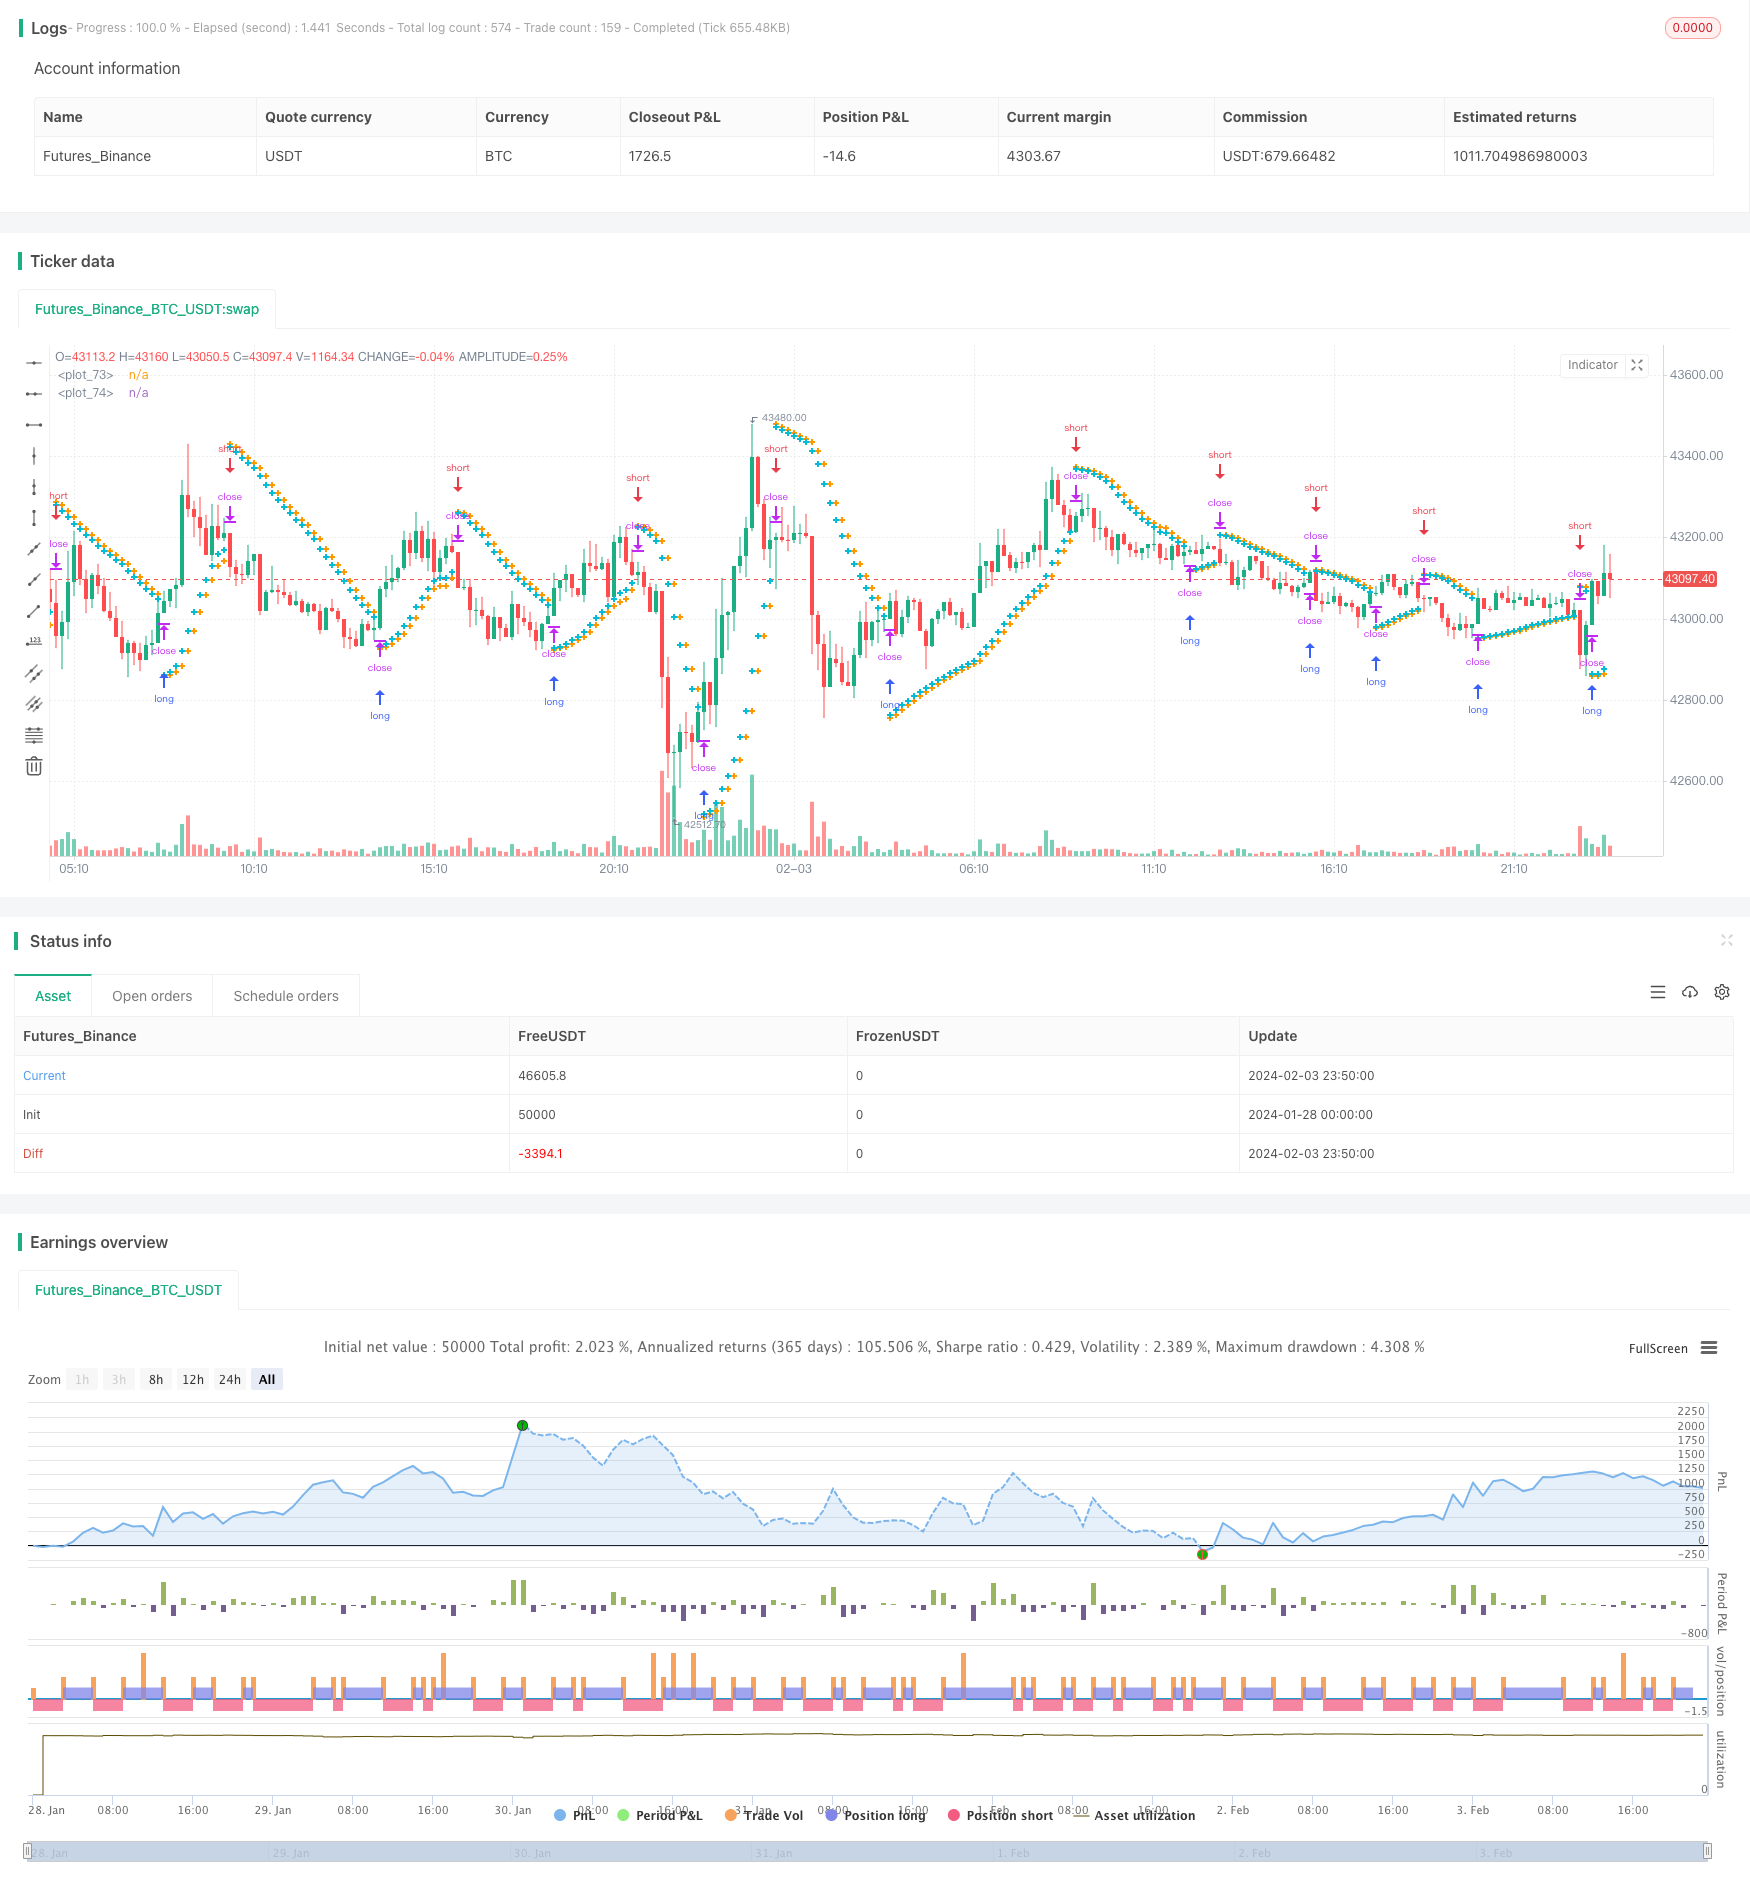
Overview
This strategy implements a simple and efficient stock fluctuation tracking and automatic take profit/stop loss strategy based on the Parabolic SAR indicator. It can dynamically track the uptrend and downtrend of stock prices and automatically set take profit/stop loss points at the reversal points without manual intervention, realizing automated trading.
Strategy Principle
This strategy uses the Parabolic SAR indicator to determine the trend direction of stock price fluctuations. When the PSAR indicator is below the K-line, it indicates an upward trend; when the PSAR indicator is above the K-line, it indicates a downward trend. The strategy tracks changes in PSAR values in real time to determine changes in trends.
When an upward trend is confirmed, the strategy will set a stop loss point at the PSAR point of the next BAR; when a downward trend is confirmed, the strategy will set a take profit point at the PSAR point of the next BAR. This achieves the automatic take profit/stop loss function when stock prices reverse.
At the same time, the strategy has built-in parameters such as starting value, step value and maximum value to adjust the sensitivity of the PSAR indicator, thereby optimizing the effect of take profit/stop loss.
Advantage Analysis
The biggest advantage of this strategy is that it realizes full automation of stock fluctuation tracking and automatic take profit/stop loss. Profits can be realized without manual judgment of market trends, which greatly reduces the time and energy costs of manual trading.
Compared with traditional stop loss/take profit strategies, the take profit/stop loss points of this strategy are variable, which can capture price changes and opportunities more quickly. It also reduces the probability of misjudgment and increases profit potential.
After parameter optimization, this strategy can continuously profit in major trends, while automatically stop loss to protect the principal when reversal comes.
Risk Analysis
The biggest risk of this strategy is the probability that the PSAR indicator misjudges the trend direction. When the stock price has a short-term adjustment and fluctuation, the PSAR indicator may give a wrong signal. At this time, it is necessary to reasonably optimize the parameters of PSAR to improve the accuracy of judgment.
Another risk point is that the take profit/stop loss point is too close to the current price. This may increase the probability that the stop loss point is broken, bringing greater impact to the principal. At this time, appropriately relax the take profit/stop loss range to ensure sufficient buffer space.
Strategy Optimization
The optimization potential of this strategy mainly focuses on adjusting the parameters of the PSAR indicator itself. By testing different stocks and optimizing the settings of starting value, step value and maximum value, the PSAR indicator can be more sensitive to price fluctuations, while ensuring judgment accuracy. This requires a lot of backtesting and analysis work.
Another optimization direction is to set the range of take profit/stop loss. It is necessary to study the intraday fluctuation range of different stocks, and set reasonable profit/loss ratio requirements based on this. This can further reduce the probability of principal loss.
Summary
This strategy utilizes the Parabolic SAR indicator to realize a fully automated stock tracking and automatic take profit/stop loss trading strategy. Its biggest advantage is that no manual intervention is required, which can reduce time and energy costs. The main risks come from misjudgments of indicators, which can be reduced through parameter optimization. In general, this strategy provides an efficient and reliable solution for quantitative trading of stocks.
Parameters
| Name | Default | What it controls |
|---|---|---|
| v_input_1 | 0.02 | start |
| v_input_2 | 0.02 | increment |
| v_input_3 | 0.2 | maximum |
Source Pine Script
/*backtest
start: 2024-01-28 00:00:00
end: 2024-02-04 00:00:00
period: 10m
basePeriod: 1m
exchanges: [{"eid":"Futures_Binance","currency":"BTC_USDT"}]
*/

//@version=4
strategy("Swing Parabolic SAR Strategy", overlay=true)
start = input(0.02)
increment = input(0.02)
maximum = input(0.2)
var bool uptrend = na
var float EP = na
var float SAR = na
var float AF = start
var float nextBarSAR = na
if bar_index > 0
	firstTrendBar = false
	SAR := nextBarSAR
	if bar_index == 1
		float prevSAR = na
		float prevEP = na
		lowPrev = low[1]
		highPrev = high[1]
		closeCur = close
		closePrev = close[1]
		if closeCur > closePrev
			uptrend := true
			EP := high
			prevSAR := lowPrev
			prevEP := high
		else
			uptrend := false
			EP := low
			prevSAR := highPrev
			prevEP := low
		firstTrendBar := true
		SAR := prevSAR + start * (prevEP - prevSAR)
	if uptrend
		if SAR > low
			firstTrendBar := true
			uptrend := false
			SAR := max(EP, high)
			EP := low
			AF := start
	else
		if SAR < high
			firstTrendBar := true
			uptrend := true
			SAR := min(EP, low)
			EP := high
			AF := start
	if not firstTrendBar
		if uptrend
			if high > EP
				EP := high
				AF := min(AF + increment, maximum)
		else
			if low < EP
				EP := low
				AF := min(AF + increment, maximum)
	if uptrend
		SAR := min(SAR, low[1])
		if bar_index > 1
			SAR := min(SAR, low[2])
	else
		SAR := max(SAR, high[1])
		if bar_index > 1
			SAR := max(SAR, high[2])
	nextBarSAR := SAR + AF * (EP - SAR)
	if barstate.isconfirmed
		if uptrend
			strategy.entry("short", strategy.short, stop=nextBarSAR, comment="short")
			strategy.cancel("long")
		else
			strategy.entry("long", strategy.long, stop=nextBarSAR, comment="long")
			strategy.cancel("short")

plot(SAR, style=plot.style_cross, linewidth=3, color=color.orange)
plot(nextBarSAR, style=plot.style_cross, linewidth=3, color=color.aqua)
Published by ChaoZhang on the FMZ strategy square · last modified 2024-02-05. Collected in the Quant Trading Vault. Unvalidated research: re-test with your own data and costs before trusting it.
Build this with AgenKit
A spec is not a trading system. Paste this into your coding agent and AgenKit runs a specialist team — architecture, test-first build, risk gates, review — with paper trading on by default.
/agenkit build a production-grade trading bot with a backtest engine, risk controls and paper trading by default from strategies/Dynamic-PSAR-Stock-Fluctuation-Tracking-Strategy.md- npx agenkit install engineering-kit in your project
- Paste the command into your agent and approve each phase
- Get tests, backtest, risk controls and a paper-trading switch
Understand it first
Before you run this, read the lesson behind the idea and how to backtest it honestly. Specs like this one are the survivors of an unknown number of trials; deflate their results accordingly.
Related specs
- Dual Rail Parabolic SAR Bollinger Bands StrategyPine Script · Mean reversion
- Parabolic SAR Divergence Trading StrategyPine Script · Mean reversion · 1d
- Parabolic SAR Trailing Stop Loss StrategyPine Script · Mean reversion · 3h
- Combining Simple Moving Average and Adaptive Moving Average StrategyPine Script · Mean reversion · 5m
- Multi Dimensional Technical Indicator Cross Confirmation Buy Signal Optimization StrategyPine Script · Mean reversion · 1d
- Multi Indicator Synergistic SAR Reversal Strategy with Filtered Entry ModelPine Script · Mean reversion · 3h