Strategy vault / Trend following
Dynamic Stop Loss and Take Profit Bollinger Bands Strategy
This strategy is a Bollinger Bands-based trading strategy. It uses Bollinger Bands to generate buy and sell signals and dynamically sets stop loss and take profit levels. A buy signal is generated when the price…
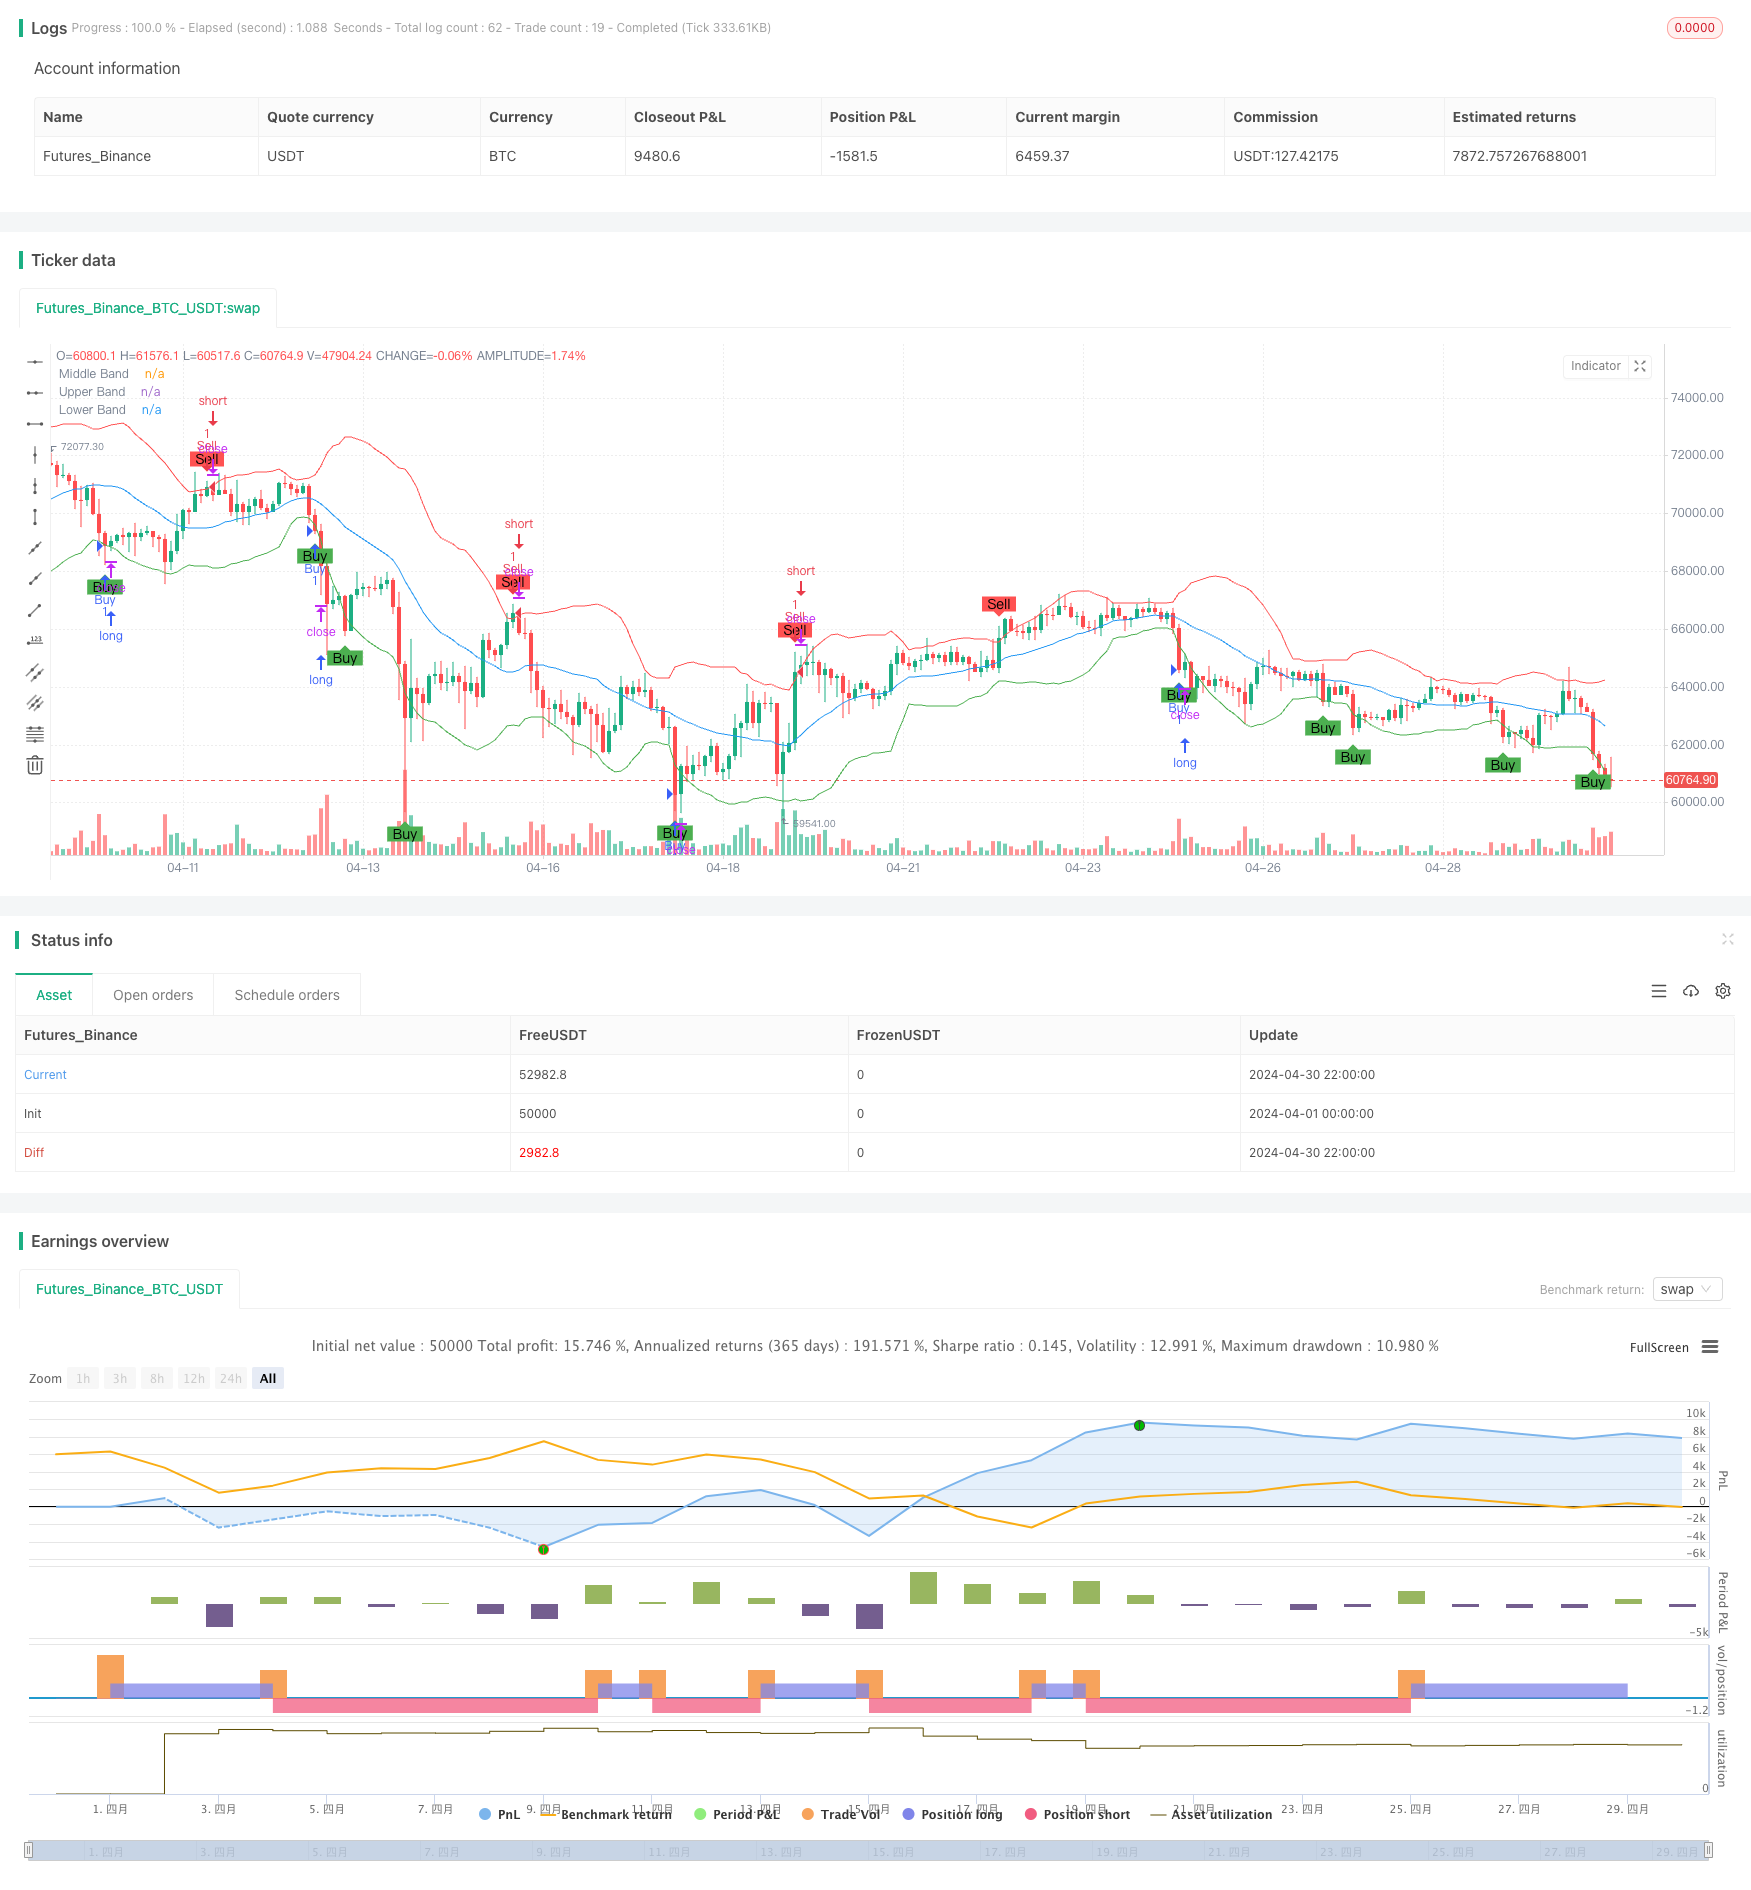
Overview
This strategy is a Bollinger Bands-based trading strategy. It uses Bollinger Bands to generate buy and sell signals and dynamically sets stop loss and take profit levels. A buy signal is generated when the price crosses below the lower band, and a sell signal is generated when the price crosses above the upper band. The stop loss level is set at the lowest or highest price over a past period, and the take profit level is dynamically adjusted based on new signals.
Strategy Principle
- Calculate the upper, middle, and lower Bollinger Bands.
- Generate a buy signal when the price crosses below the lower band and a sell signal when the price crosses above the upper band.
- When buying, set the stop loss level at the lowest price over a past period and do not set the take profit level yet.
- When selling, set the stop loss level at the highest price over a past period and do not set the take profit level yet.
- Reset the take profit level to empty when a new buy or sell signal appears.
Strategy Advantages
- Bollinger Bands are a mature and widely used technical indicator that can effectively capture market volatility.
- Dynamic stop loss and take profit settings can adapt to different market conditions, improving the strategy's adaptability.
- The setting of the stop loss level can effectively control risk and prevent excessive losses from a single trade.
- The strategy logic is clear and easy to understand and implement.
Strategy Risks
- In a sideways market, frequent buy and sell signals may lead to excessive trading and increase trading costs.
- The setting of the stop loss level is based on historical data and may not adapt to future market changes.
- The strategy lacks judgment of the trend direction and may miss opportunities in strong trending markets.
Strategy Optimization Directions
- Introduce trend judgment indicators, such as moving averages, to trade in the direction of the trend and improve the strategy's trend adaptability.
- Optimize the setting method of stop loss and take profit levels, such as using volatility indicators like ATR, to make them more dynamic and adaptable to market changes.
- Add additional filtering conditions to the buy and sell signals, such as trading volume and volatility, to improve the reliability of the signals.
- Optimize parameters, such as the length and standard deviation multiplier of the Bollinger Bands, to find the best parameter combination.
Summary
This strategy is a Bollinger Bands-based trading strategy that generates buy and sell signals through the crossing of Bollinger Bands and dynamically sets stop loss and take profit levels. The strategy logic is clear and easy to implement, and it can adapt to different market conditions. However, it may generate excessive trading in sideways markets and lacks judgment of the trend direction. In the future, the strategy's performance can be improved by introducing trend judgment indicators, optimizing the setting method of stop loss and take profit levels, adding filtering conditions, and optimizing parameters.
Source Pine Script
/*backtest
start: 2024-04-01 00:00:00
end: 2024-04-30 23:59:59
period: 2h
basePeriod: 15m
exchanges: [{"eid":"Futures_Binance","currency":"BTC_USDT"}]
*/

//@version=5
strategy("Bollinger Bands Strategy", overlay=true)

// Bollinger Bands settings
length = 20
src = close
mult = 2.0

// Calculate Bollinger Bands
basis = ta.sma(src, length)
dev = mult * ta.stdev(src, length)
upper = basis + dev
lower = basis - dev

// Plot Bollinger Bands
plot(basis, color=color.blue, title="Middle Band")
plot(upper, color=color.red, title="Upper Band")
plot(lower, color=color.green, title="Lower Band")

// Trade logic
// Buy when the price crosses below the lower Bollinger Band
buySignal = ta.crossover(lower, src)
// Sell when the price crosses above the upper Bollinger Band
sellSignal = ta.crossover(src, upper)

// Define stop loss and take profit levels
var float stopLoss = na
var float takeProfit = na

// Calculate stop loss and take profit levels
if (buySignal)
    stopLoss := ta.lowest(low, length)
    takeProfit := na
if (sellSignal)
    stopLoss := ta.highest(high, length)
    takeProfit := na

// Update take profit on new signals
if (buySignal)
    takeProfit := na
if (sellSignal)
    takeProfit := na

// Execute trades
if (buySignal)
    strategy.entry("Buy", strategy.long, stop=stopLoss, limit=takeProfit)

if (sellSignal)
    strategy.entry("Sell", strategy.short, stop=stopLoss, limit=takeProfit)

// Plot signals on chart
plotshape(series=buySignal, location=location.belowbar, color=color.green, style=shape.labelup, text="Buy", title="Buy Signal")
plotshape(series=sellSignal, location=location.abovebar, color=color.red, style=shape.labeldown, text="Sell", title="Sell Signal")

// Alert conditions
alertcondition(buySignal, title="Buy Alert", message="Buy Signal detected")
alertcondition(sellSignal, title="Sell Alert", message="Sell Signal detected")Published by ChaoZhang on the FMZ strategy square · last modified 2024-05-17. Collected in the Quant Trading Vault. Unvalidated research: re-test with your own data and costs before trusting it.
Build this with AgenKit
A spec is not a trading system. Paste this into your coding agent and AgenKit runs a specialist team — architecture, test-first build, risk gates, review — with paper trading on by default.
/agenkit build a production-grade trading bot with a backtest engine, risk controls and paper trading by default from strategies/Dynamic-Stop-Loss-and-Take-Profit-Bollinger-Bands-Strategy.md- npx agenkit install engineering-kit in your project
- Paste the command into your agent and approve each phase
- Get tests, backtest, risk controls and a paper-trading switch
Understand it first
Before you run this, read the lesson behind the idea and how to backtest it honestly. Specs like this one are the survivors of an unknown number of trials; deflate their results accordingly.
Related specs
- ATR and Moving Average Crossover Hybrid StrategyPine Script · Trend following · 1h
- BB Percentage Index Trend Fading StrategyPine Script · Trend following · 1h
- Bollinger Bands and RSI Trend Following StrategyPine Script · Trend following · 1h
- Dual Moving Average Crossover Dynamic Position Optimization Strategy with EMA Cross Signal SystemPine Script · Trend following · 1h
- Dynamic Moving Average and Bollinger Bands Cross Strategy with Fixed Stop Loss Optimization ModelPine Script · Trend following · 3h
- EMA Cross Trend Following Strategy with SMA Stop Loss and Re Entry MechanismPine Script · Trend following · 1h