Dynamic Support and Resistance Strategy Based on Historical Data
This strategy dynamically calculates support and resistance levels based on historical high, low and close prices, and generates trading signals accordingly. It is suitable for medium-to-long-term positions and can…
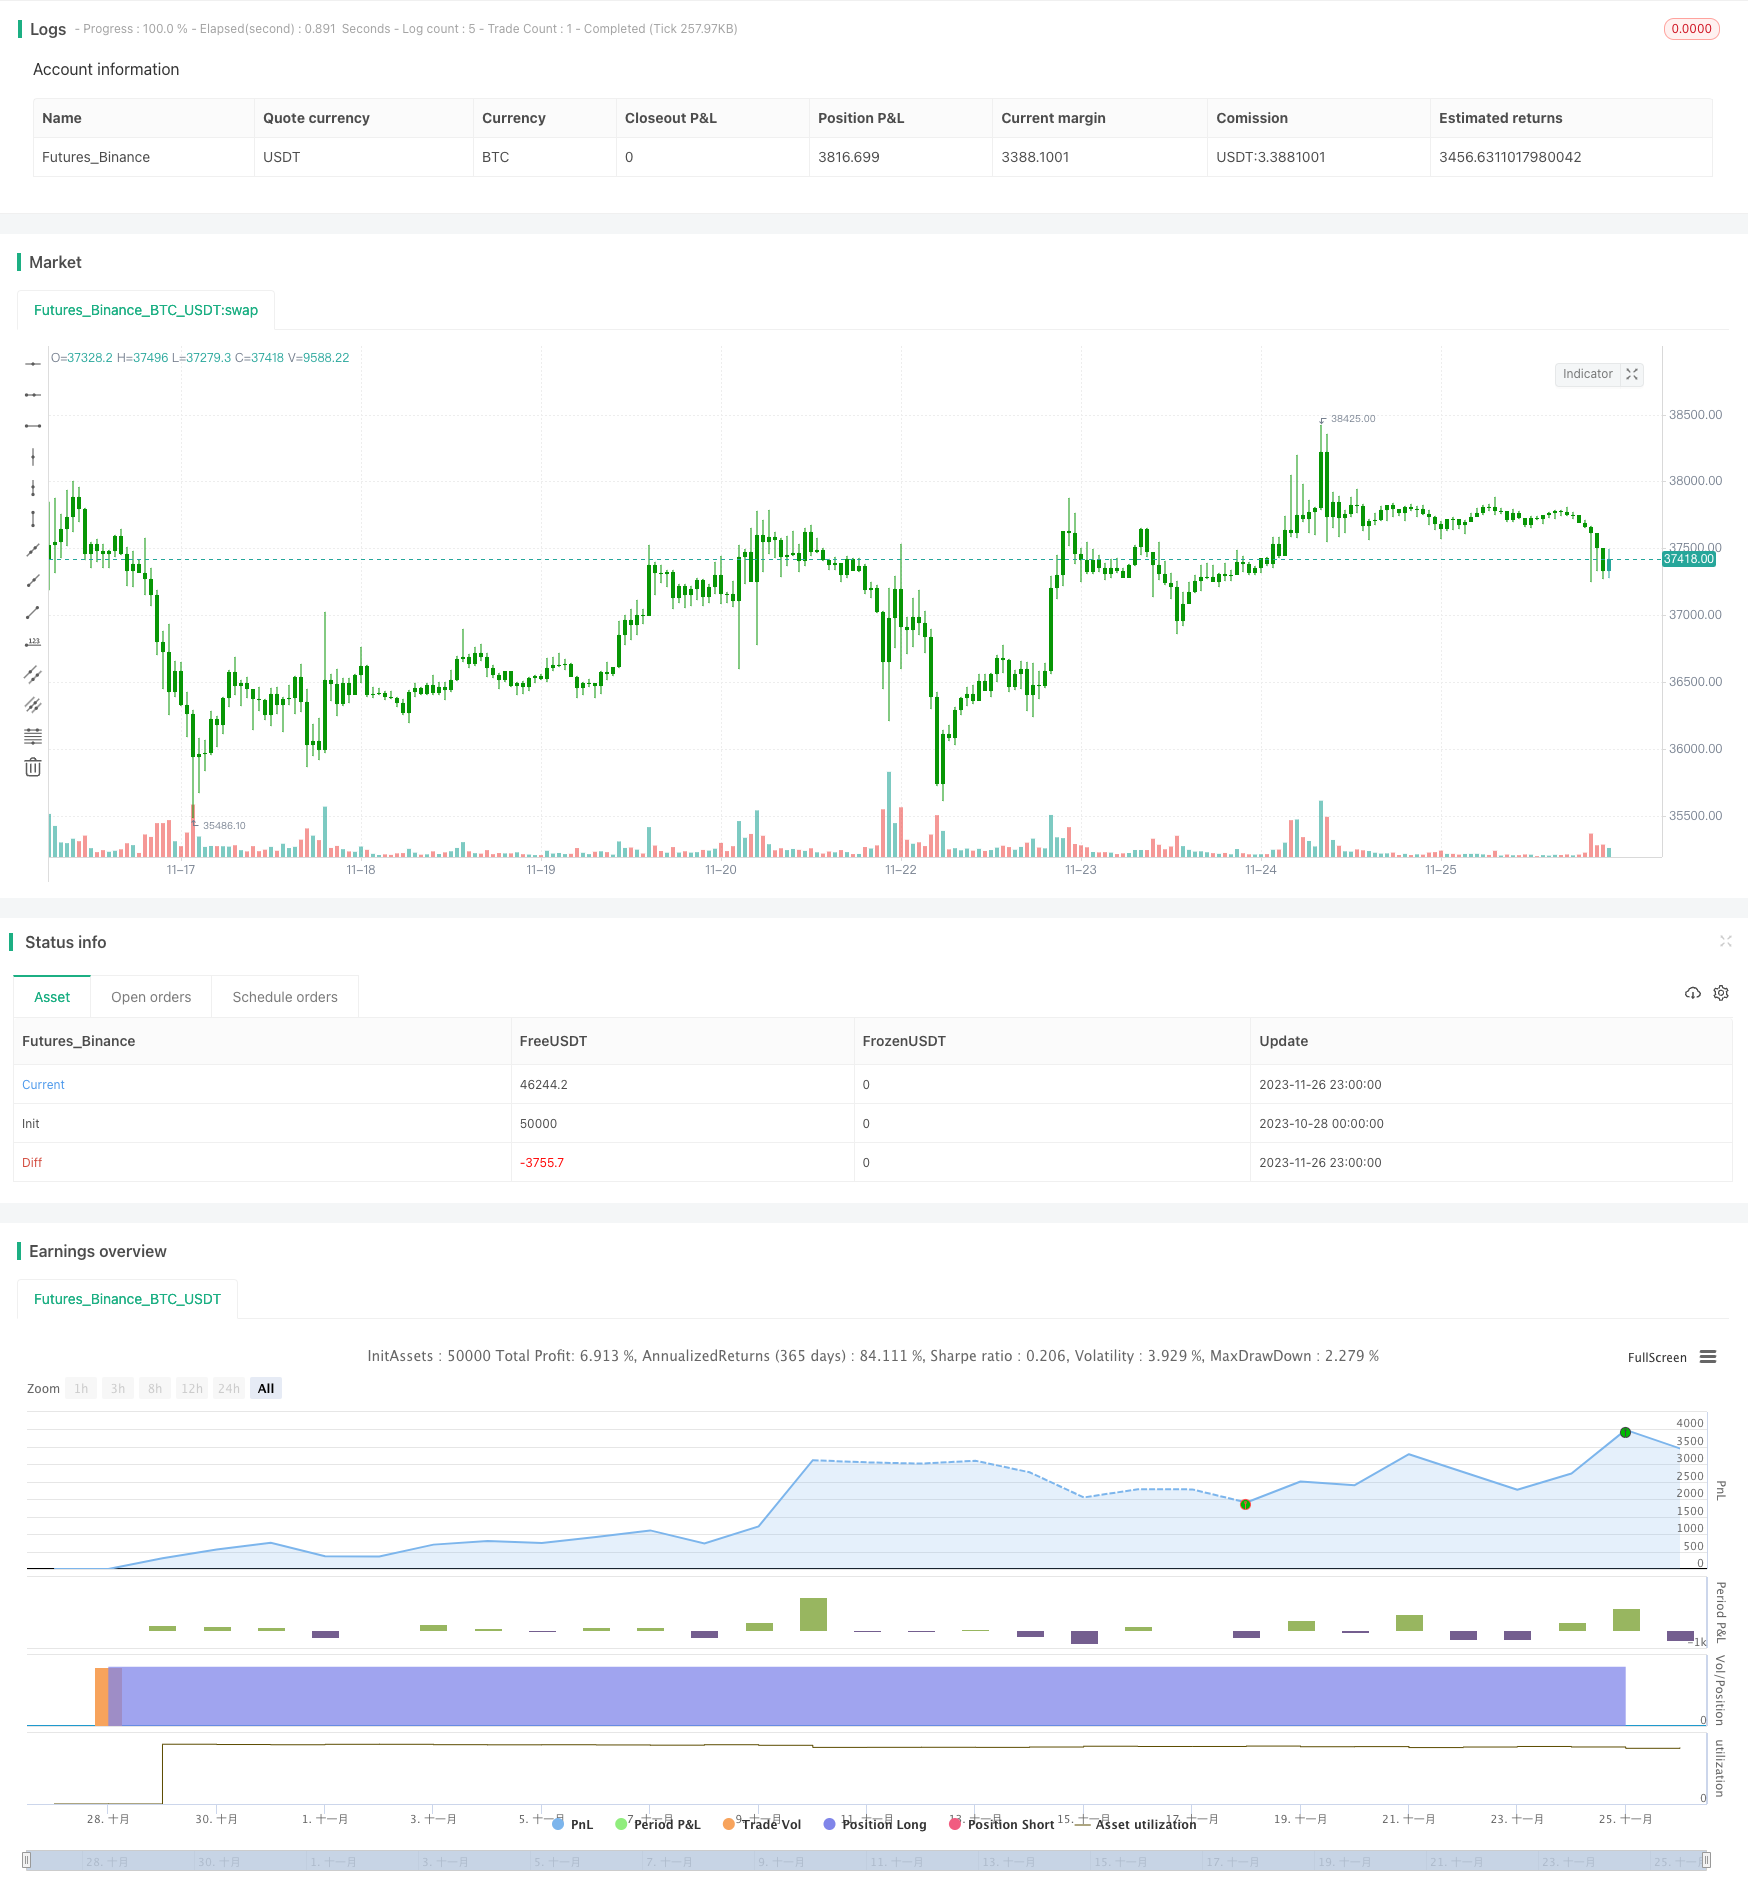
Overview
This strategy dynamically calculates support and resistance levels based on historical high, low and close prices, and generates trading signals accordingly. It is suitable for medium-to-long-term positions and can effectively utilize support and resistance levels in the market for profit.
Strategy Logic
Calculate the average of previous period's high, low and close prices as the pivot point (PP).
Calculate 3 support lines: S1 = 2PP - highest price; S2 = PP - (R1-S1); S3 = lowest price - 2(highest price - PP).
Calculate 3 resistance lines: R1 = 2PP - lowest price; R2 = PP + (R1-S1); R3 = highest price + 2(PP - lowest price).
Take long position when price breaks through resistance lines, take short position when price breaks through support lines.
Advantage Analysis
The dynamic support and resistance levels based on historical data can capture market structure changes timely.
The multi-layer support and resistance settings allow better risk management optimization.
Simple and intuitive trading signals and stop loss mechanism.
Risk Analysis
The reference price levels provided by historical data may become invalid in high volatility scenarios.
The switching between long and short positions should consider trading cost.
Data quality needs to ensured to avoid calculation errors.
Optimization Directions
Consider incorporating more historical data references like 100-day moving average etc.
Optimize position sizing, e.g. adjust position size based on volatility.
Add stop loss strategies like trailing stop loss or risk-based stop loss.
Summary
This strategy provides multi-layer support and resistance reference price levels based on history. It has simple and straightforward logic suitable for medium-to-long-term positions. Meanwhile, risks under high volatility market and trading costs should be monitored. Further optimizations can make the strategy robust under complex environments.
Parameters
| Name | Default | What it controls |
|---|---|---|
| v_input_1 | D | Resolution |
| v_input_2 | 0 | Sell from : R1 | R2 | R3 |
| v_input_3 | 0 | Buy from : S1 | S2 | S3 |
| v_input_4 | true | width |
| v_input_5 | false | Trade reverse |
Source Pine Script
/*backtest
start: 2023-10-28 00:00:00
end: 2023-11-27 00:00:00
period: 1h
basePeriod: 15m
exchanges: [{"eid":"Futures_Binance","currency":"BTC_USDT"}]
*/

//@version=4
////////////////////////////////////////////////////////////
//  Copyright by HPotter v1.0 09/06/2020
// Pivot points simply took the high, low, and closing price from the previous period and
// divided by 3 to find the pivot. From this pivot, traders would then base their
// calculations for three support, and three resistance levels. The calculation for the most
// basic flavor of pivot points, known as 'floor-trader pivots', along with their support and
// resistance levels.
//
// WARNING:
//  - For purpose educate only
//  - This script to change bars colors.
////////////////////////////////////////////////////////////
strategy(title="Pivot Point V2", shorttitle="Pivot Point V2", overlay = true)
res = input(title="Resolution", type=input.resolution, defval="D")
SellFrom = input(title="Sell from ", defval="R1", options=["R1", "R2", "R3"])
BuyFrom = input(title="Buy from ", defval="S1", options=["S1", "S2", "S3"])
width = input(1, minval=1)
reverse = input(false, title="Trade reverse")
xHigh  = security(syminfo.tickerid,res, high)
xLow   = security(syminfo.tickerid,res, low)
xClose = security(syminfo.tickerid,res, close)
vPP = (xHigh+xLow+xClose) / 3
vS1 = 2*vPP - xHigh
vR1 = 2*vPP-xLow
vS2 = vPP - (vR1 - vS1)
vR2 = vPP + (vR1 - vS1)
vS3 = xLow - 2 * (xHigh - vPP)
vR3 = xHigh + 2 * (vPP - xLow)
pos = 0
S = iff(BuyFrom == "S1", vS1,
      iff(BuyFrom == "S2", vS2,
         iff(BuyFrom == "S3", vS3,0)))
B = iff(SellFrom == "R1", vR1,
      iff(SellFrom == "R2", vR2,
         iff(SellFrom == "R3", vR3,0)))
pos := iff(close > B, 1,
       iff(close < S, -1, nz(pos[1], 0)))
possig = iff(reverse and pos == 1, -1,
          iff(reverse and pos == -1 , 1, pos))
if (possig == 1)
    strategy.entry("Long", strategy.long)
if (possig == -1)
    strategy.entry("Short", strategy.short)
if (possig == 0)
    strategy.close_all()
barcolor(possig == -1 ? #b50404: possig == 1 ? #079605 : #0536b3 )
Published by ChaoZhang on the FMZ strategy square · last modified 2023-11-28. Collected in the Quant Trading Vault. Unvalidated research: re-test with your own data and costs before trusting it.
Build this with AgenKit
A spec is not a trading system. Paste this into your coding agent and AgenKit runs a specialist team — architecture, test-first build, risk gates, review — with paper trading on by default.
/agenkit build a production-grade trading bot with a backtest engine, risk controls and paper trading by default from strategies/Dynamic-Support-and-Resistance-Strategy-Based-on-Historical-Data.md- npx agenkit install engineering-kit in your project
- Paste the command into your agent and approve each phase
- Get tests, backtest, risk controls and a paper-trading switch
Understand it first
Before you run this, read the lesson behind the idea and how to backtest it honestly. Specs like this one are the survivors of an unknown number of trials; deflate their results accordingly.
Related specs
- Dual Moving Average Volatility Tracking StrategyPine Script · Volatility · 1h
- Adaptive VWAP Bands with Garman Klass Volatility Dynamic Tracking StrategyPine Script · Volatility · 1d
- Relative Volatility Index Backtesting StrategyPine Script · Volatility · 4h
- Multi Indicator Dynamic Position Size Volatility Adaptive Quantitative Trading StrategyPine Script · Volatility · 1d
- Dynamic Volatility Trading Strategy Based on Bollinger Bands and Candlestick PatternsPine Script · Volatility · 1d
- Multi Timeframe Volatility Tracking Quantitative StrategyPine Script · Volatility · 1m