Dynamic Support Resistance Breakout Trading Strategy with Trend Filtering and Risk Management System
This is a trading strategy based on support and resistance zone breakouts, incorporating trend filtering and risk management systems. The strategy dynamically identifies key price levels to determine potential…
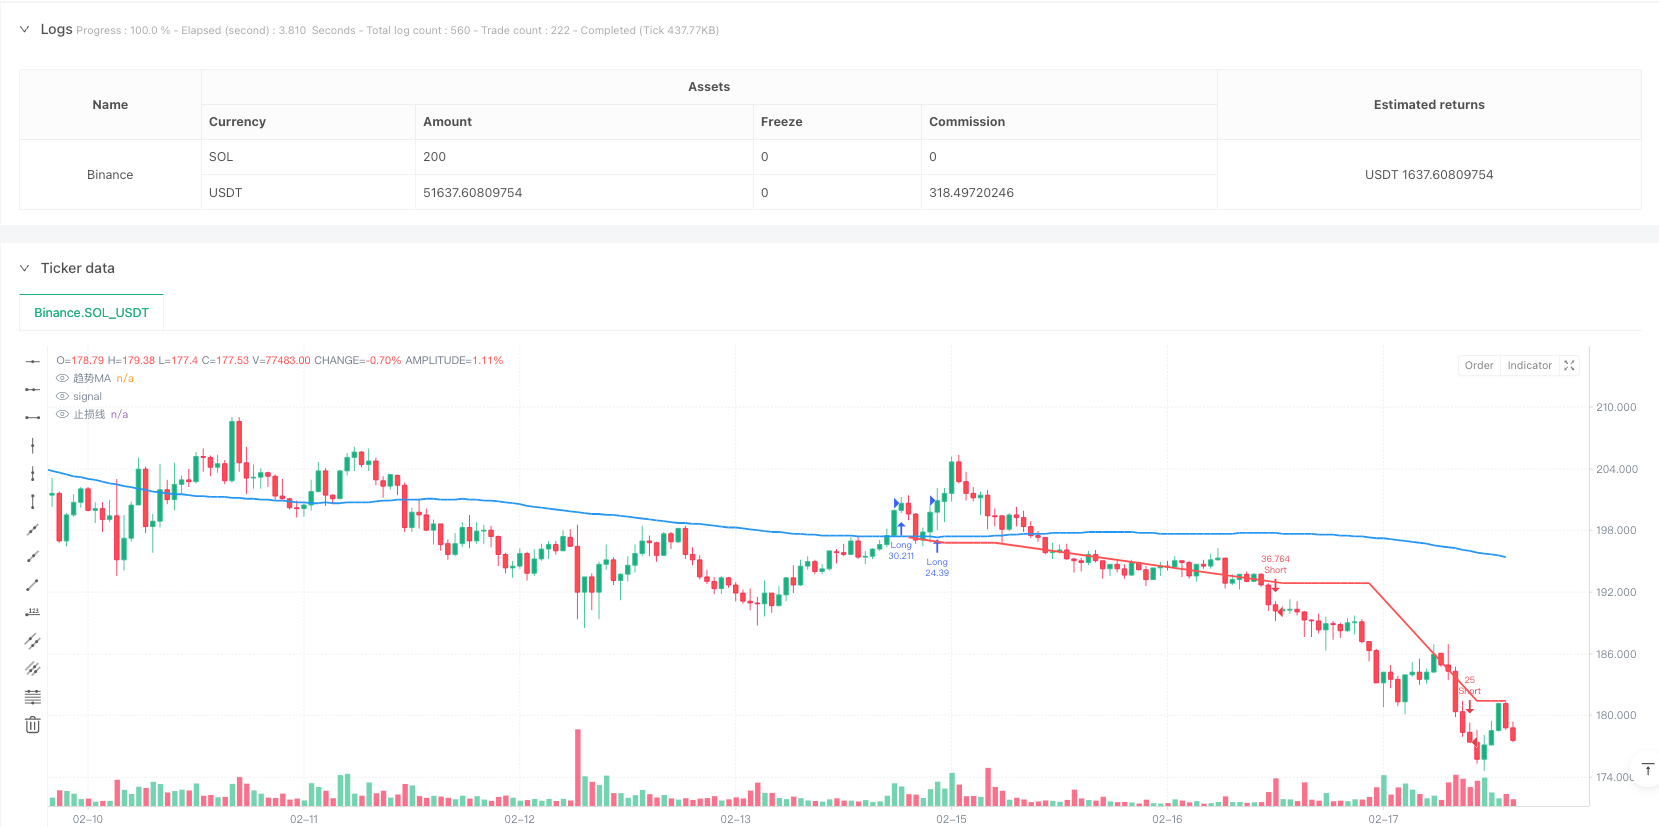
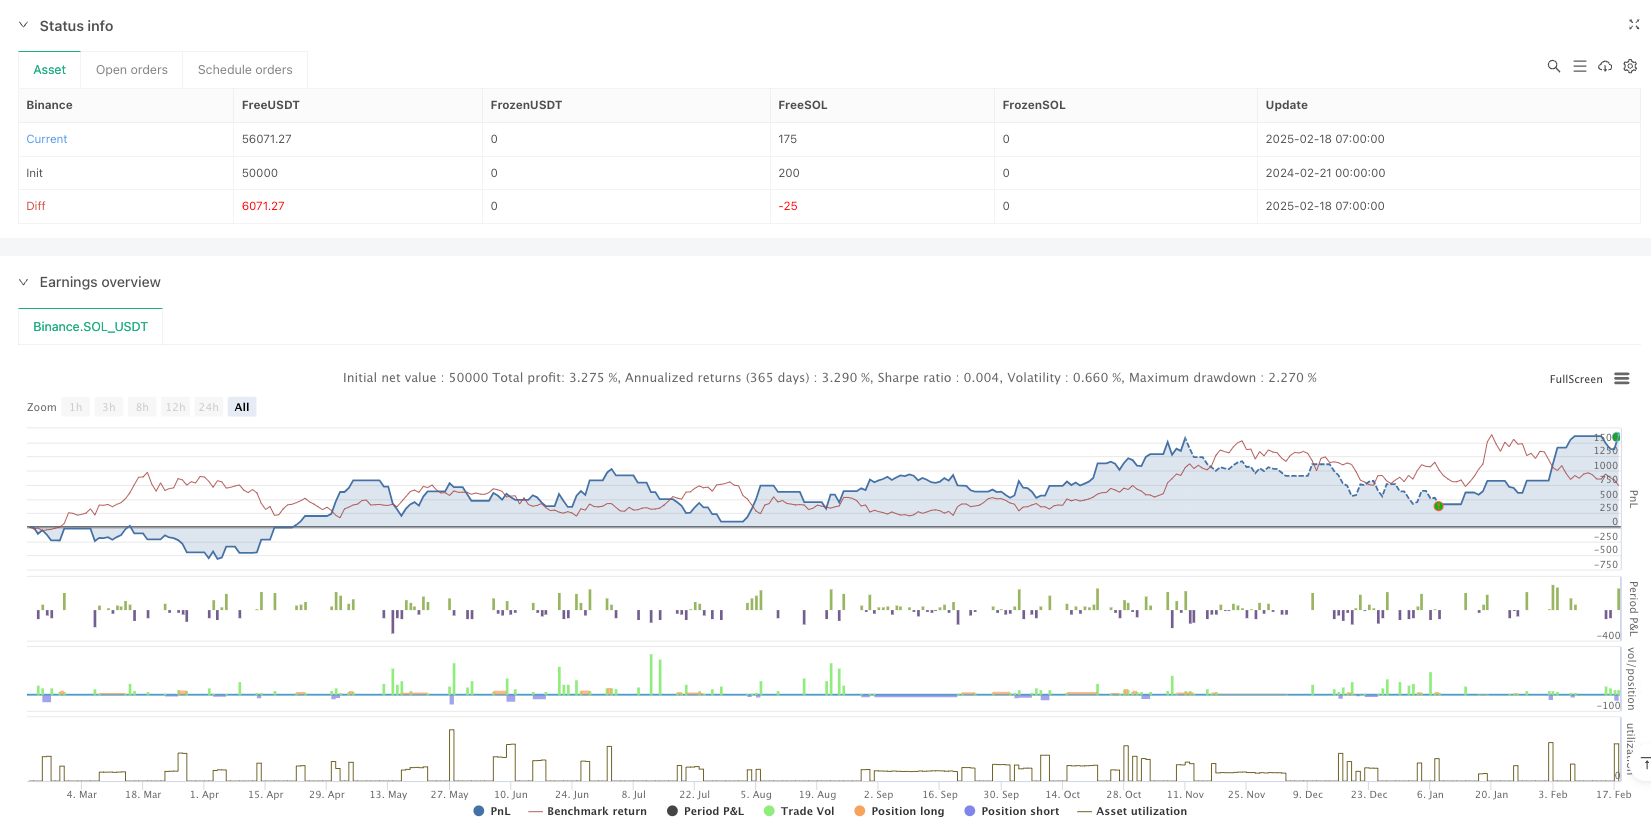
Overview
This is a trading strategy based on support and resistance zone breakouts, incorporating trend filtering and risk management systems. The strategy dynamically identifies key price levels to determine potential trading opportunities and uses moving averages to confirm market trend direction. It employs a conservative money management approach, limiting risk to 1% of account capital per trade, while using a 2:1 reward-to-risk ratio for profit targets.
Strategy Principles
The core logic includes several key components:
- Using pivot highs and lows to identify potential support and resistance zones
- Creating support/resistance zones through price offset percentages
- Utilizing a 200-day moving average as a trend filter
- Confirming breakout validity through candlestick patterns
- Implementing strict money management rules to control risk per trade The system enters long positions when price breaks above resistance in an uptrend and short positions when price breaks below support in a downtrend.
Strategy Advantages
- Dynamic Market Structure Recognition - Automatically identifies and updates important price levels, adapting to market changes
- Multiple Confirmation Mechanisms - Combines trend filtering and candlestick confirmation to reduce false breakout risks
- Comprehensive Risk Management - Uses fixed risk rules to protect account capital
- Clear Profit Objectives - Implements 2:1 reward-to-risk ratio for profit targets
- Visualized Trading Signals - Clearly displays support/resistance zones and stop-loss levels on charts
Strategy Risks
- Market Volatility Risk - Slippage during high volatility periods may affect actual trading results
- Trend Reversal Risk - Market might quickly reverse after breakout, triggering stop-loss
- Parameter Optimization Risk - Over-optimization may lead to overfitting
- Money Management Risk - Consecutive losses may impact account growth Suggested to manage these risks through backtesting different market conditions and adjusting parameters accordingly.
Strategy Optimization Directions
- Dynamic Zone Width Adjustment - Automatically adjust zone ranges based on market volatility
- Add Volume Confirmation - Incorporate volume filters in breakout signals
- Enhance Trend Filter - Consider multi-timeframe trend confirmation
- Improve Profit-Taking Strategy - Implement dynamic profit targets based on market conditions
- Add Time Filters - Avoid trading during highly volatile market periods
Summary
This is a well-structured trading strategy that combines technical analysis and risk management principles to provide a systematic trading approach. Its strengths lie in comprehensive trading rules and strict risk control, but traders need to understand its limitations and make appropriate optimizations based on actual trading conditions. Through continuous improvement and validation, the strategy has the potential to maintain stable performance across different market environments.
Source Pine Script
/*backtest
start: 2024-02-21 00:00:00
end: 2025-02-18 08:00:00
period: 1h
basePeriod: 1h
exchanges: [{"eid":"Binance","currency":"SOL_USDT"}]
*/

//@version=5
strategy("Support/resistance area breakout strategy (2x take profit + candle confirmation + trend filter)", overlay=true, initial_capital=10000, currency=currency.USD, pyramiding=0, calc_on_order_fills=true, calc_on_every_tick=true)

// User input settings
pivotLen = input.int(title="Pivot identification window length", defval=5, minval=1)
zoneOffsetPercent = input.float(title="Area offset percentage (%)", defval=0.1, step=0.1)
maLength = input.int(200, title="Moving Average Period")

// Trend Indicator: Simple Moving Average(SMA)
trendMA = ta.sma(close, maLength)

// Identify Highs and Lows(Pivot High/Low point)
ph = ta.pivothigh(high, pivotLen, pivotLen)
pl = ta.pivotlow(low, pivotLen, pivotLen)

// Store the most recent resistance and support levels
var float resistanceLevel = na
var int resistanceBar = na
if not na(ph)
    resistanceLevel := ph
    resistanceBar := bar_index - pivotLen

var float supportLevel = na
var int supportBar = na
if not na(pl)
    supportLevel := pl
    supportBar := bar_index - pivotLen

// Draw the resistance and support areas as region boxes
if not na(resistanceLevel)
    resOffset = resistanceLevel * (zoneOffsetPercent / 100)
    resTop = resistanceLevel + resOffset
    resBottom = resistanceLevel - resOffset


if not na(supportLevel)
    supOffset = supportLevel * (zoneOffsetPercent / 100)
    supTop = supportLevel + supOffset
    supBottom = supportLevel - supOffset


// Risk Management: Define capital, risk percentage and calculate risk amount
riskCapital = 10000.0
riskPercent = 0.01
riskAmount = riskCapital * riskPercent   // 1% of $10,000 = $100

// activeStopVariable is used to display the stop loss level
var float activeStop = na
if strategy.position_size == 0
    activeStop := na

// Determine trend direction
isUptrend = close > trendMA   // Uptrend (price above MA))
isDowntrend = close < trendMA  // Downtrend (price below MA))

// Define breakout candle and confirmation candle
var bool breakoutUp = false
var bool breakoutDown = false

if not na(resistanceLevel) and close[1] > resistanceLevel and open[1] < resistanceLevel
    breakoutUp := true
else
    breakoutUp := false

if not na(supportLevel) and close[1] < supportLevel and open[1] > supportLevel
    breakoutDown := true
else
    breakoutDown := false

// Breakout Confirmation: The next candle must close in the breakout direction
confirmLong = breakoutUp and close > close[1] and strategy.position_size == 0 and isUptrend
confirmShort = breakoutDown and close < close[1] and strategy.position_size == 0 and isDowntrend

// Long Entry: Confirm Candle + Set stop loss at the low of the breakout candle
if confirmLong
    entryPrice = close
    stopLevelLong = low[1]
    riskPerUnit = entryPrice - stopLevelLong
    if riskPerUnit > 0
        qty = riskAmount / riskPerUnit
        activeStop := stopLevelLong
        takeProfitLong = entryPrice + (riskPerUnit * 2)  // Take profit is set to 2 times of stop loss
        strategy.entry("Long", strategy.long, qty=qty)
        strategy.exit("Exit Long", from_entry="Long", stop=stopLevelLong, limit=takeProfitLong)

// Short Entry: Confirm Candle + Set stop loss at the high of the breakout candle
if confirmShort
    entryPrice = close
    stopLevelShort = high[1]
    riskPerUnit = stopLevelShort - entryPrice
    if riskPerUnit > 0
        qty = riskAmount / riskPerUnit
        activeStop := stopLevelShort
        takeProfitShort = entryPrice - (riskPerUnit * 2)  // Take profit is set to 2 times of stop loss
        strategy.entry("Short", strategy.short, qty=qty)
        strategy.exit("Exit Short", from_entry="Short", stop=stopLevelShort, limit=takeProfitShort)

// Display the stop-loss line on the chart when there is a position(Horizontal line)
plot(strategy.position_size != 0 ? activeStop : na, title="Stop loss line", color=color.red, linewidth=2, style=plot.style_line)

// Display moving average on chart
plot(trendMA, title="trendMA", color=color.blue, linewidth=2)Published by ianzeng123 on the FMZ strategy square · last modified 2025-02-27. Collected in the Quant Trading Vault. Unvalidated research: re-test with your own data and costs before trusting it.
Build this with AgenKit
A spec is not a trading system. Paste this into your coding agent and AgenKit runs a specialist team — architecture, test-first build, risk gates, review — with paper trading on by default.
/agenkit build a production-grade trading bot with a backtest engine, risk controls and paper trading by default from strategies/Dynamic-Support-Resistance-Breakout-Trading-Strategy-with-Trend-Filtering-and-Risk-Management-System.md- npx agenkit install engineering-kit in your project
- Paste the command into your agent and approve each phase
- Get tests, backtest, risk controls and a paper-trading switch
Understand it first
Before you run this, read the lesson behind the idea and how to backtest it honestly. Specs like this one are the survivors of an unknown number of trials; deflate their results accordingly.
Related specs
- Momentum Breakout Trading Strategy 435896Pine Script · Breakout · 1d
- Moving Average Based Supply Demand Zone Trading System with Dynamic Risk ManagementPine Script · Breakout · 1h
- Multi factor Intelligent Trading StrategyPine Script · Breakout · 1d
- Advanced Long Only Dynamic Trendline Breakout StrategyPine Script · Breakout · 1d
- Bollinger Bands Breakout Strategy 442259Pine Script · Breakout · 1h
- Market Structure Breakthrough with Volume Spike and RSI Confluence StrategyPine Script · Breakout · 1h