Dynamic Trading System with Stochastic RSI and Candlestick Confirmation
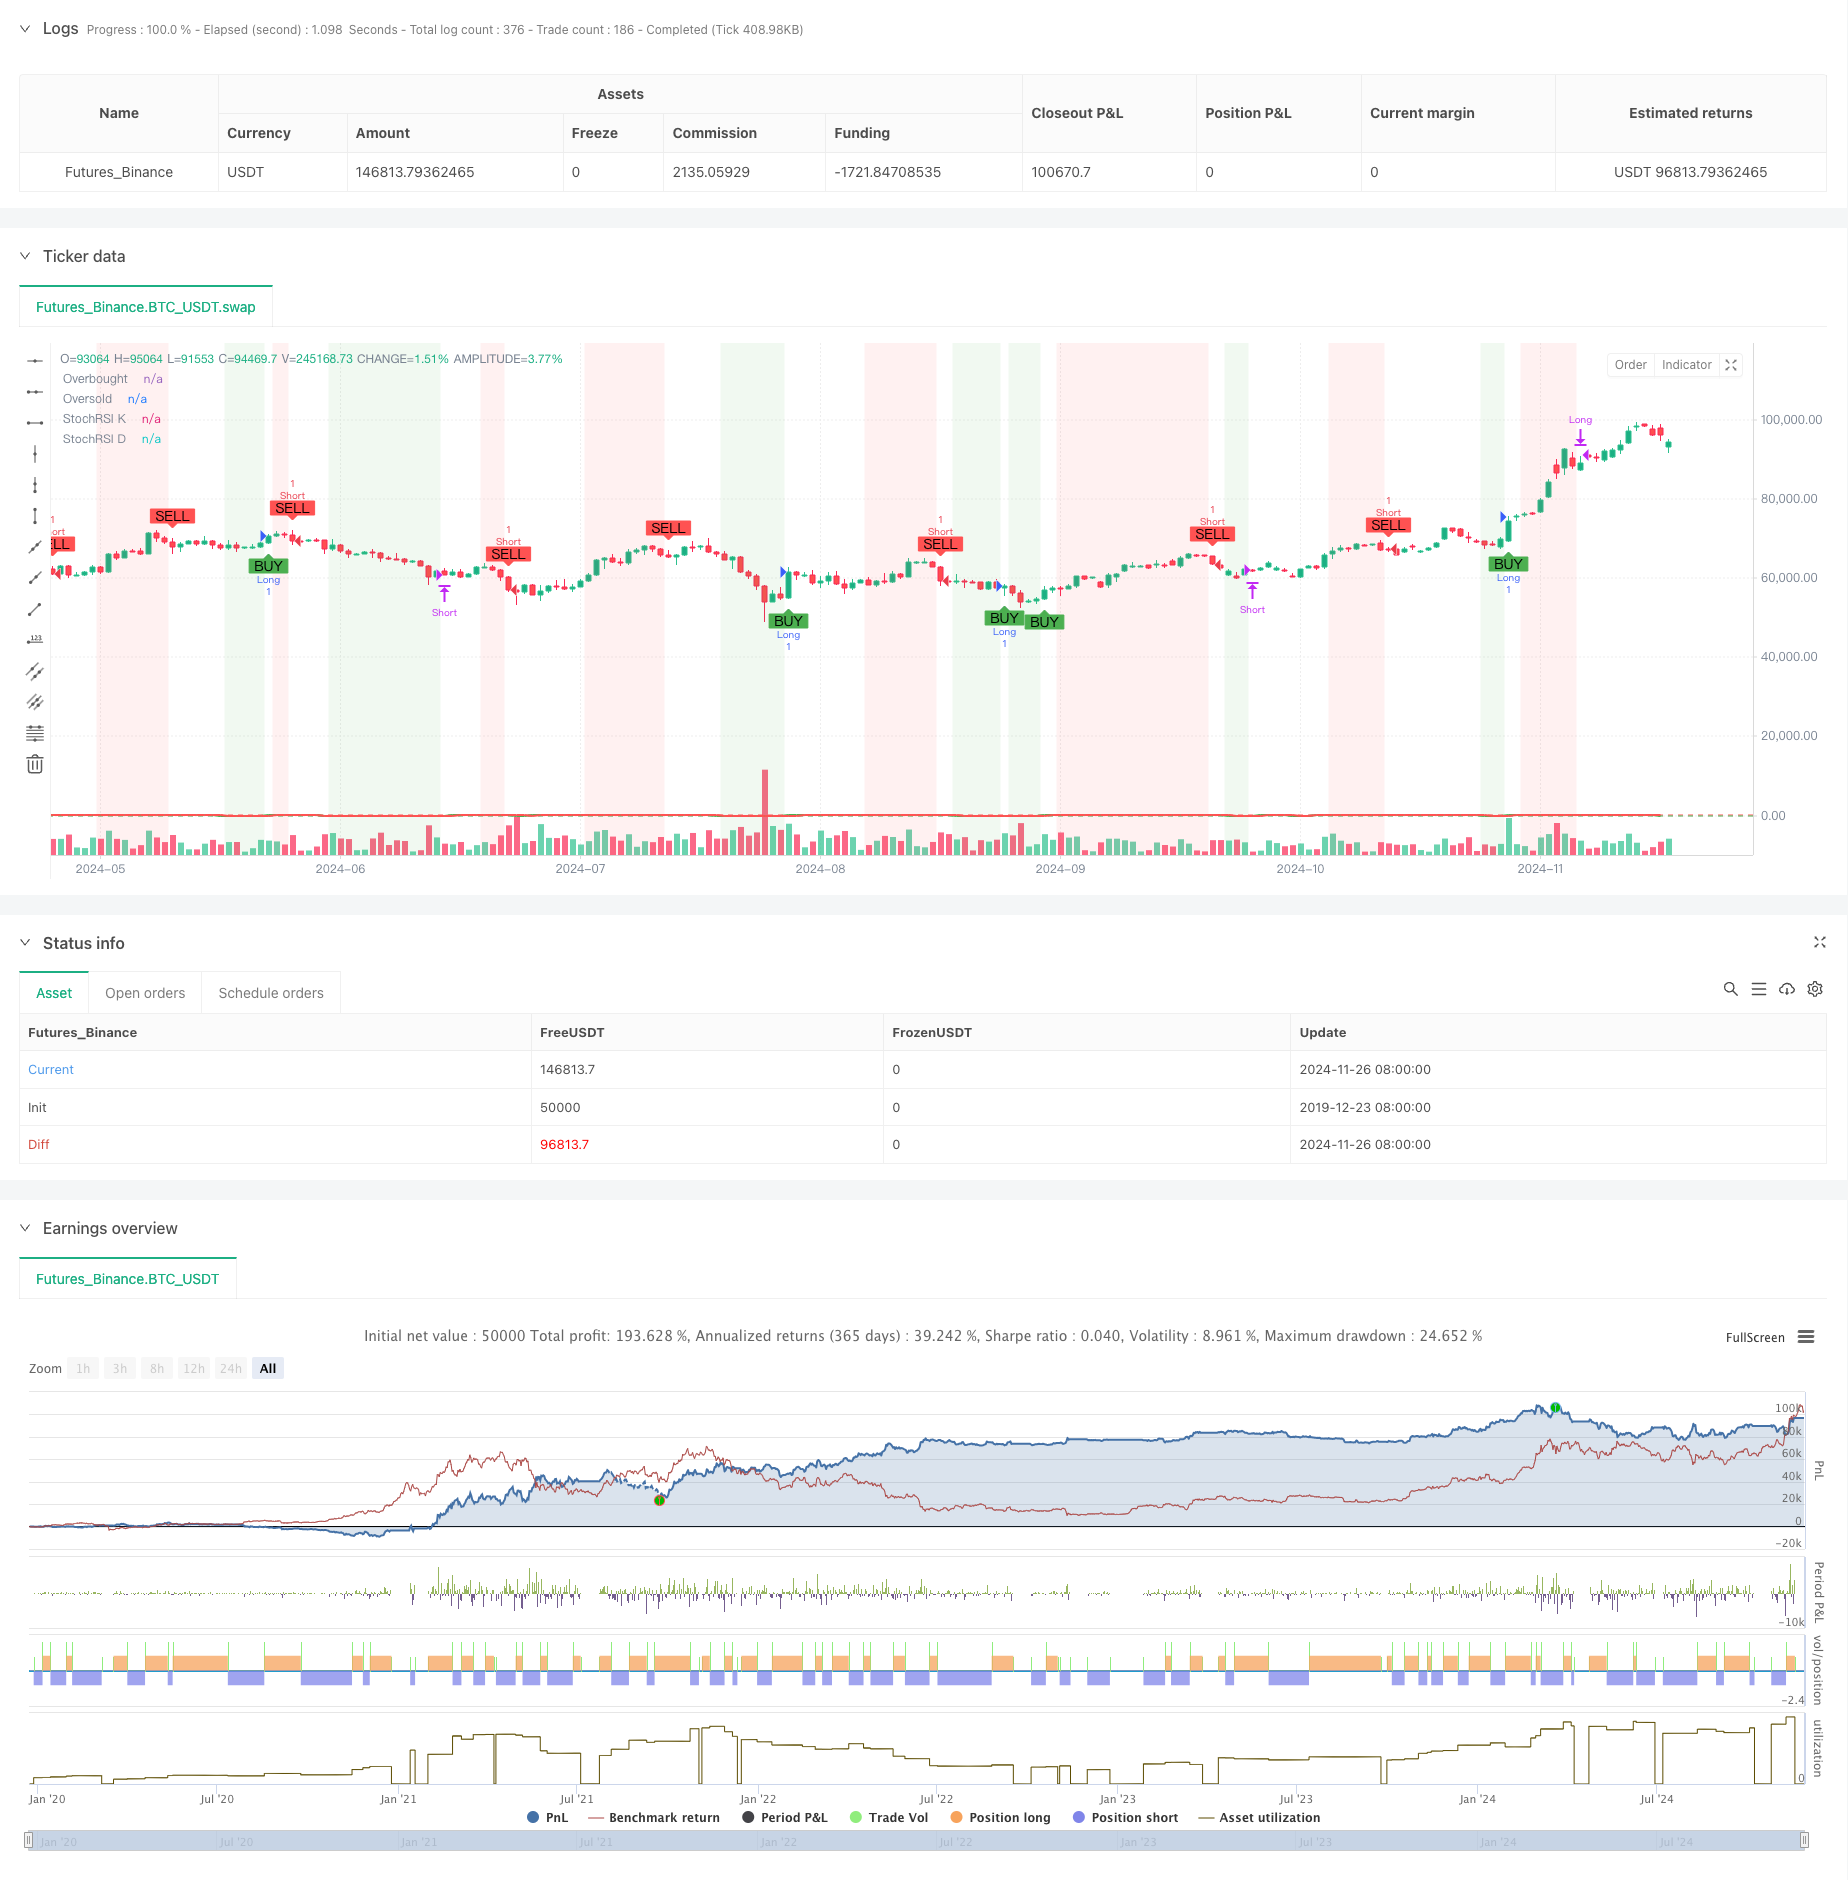
This strategy is a composite trading system that combines Stochastic Relative Strength Index (Stochastic RSI) with candlestick pattern confirmation. The system generates automated trading signals by analyzing SRSI…
Overview
This strategy is a composite trading system that combines Stochastic Relative Strength Index (Stochastic RSI) with candlestick pattern confirmation. The system generates automated trading signals by analyzing SRSI indicator's overbought and oversold levels along with price action confirmation through candlestick patterns. The strategy employs advanced technical indicator combinations, incorporating both trend-following and reversal trading characteristics, demonstrating strong market adaptability.
Strategy Principles
The core logic of the strategy is built on several key elements:
- Uses 14-period RSI as the foundation to calculate Stochastic RSI values as the primary signal source
- Applies 3-period simple moving averages to Stochastic RSI's K and D lines for signal smoothing
- Sets 80 and 20 as overbought and oversold thresholds for market condition assessment
- Incorporates current candlestick's open and close price relationship for trend confirmation
- Generates long signals when K line crosses above oversold level with bullish candlestick
- Triggers short signals when K line crosses below overbought level with bearish candlestick
- Implements corresponding stop-loss when K line crosses overbought/oversold levels
Strategy Advantages
- High Signal Reliability: Dual confirmation mechanism through Stochastic RSI and candlestick patterns significantly improves trading signal accuracy
- Comprehensive Risk Control: Clear stop-loss conditions effectively control risk for each trade
- Strong Parameter Adaptability: Key parameters can be optimized for different market characteristics
- Clear Visual Feedback: Uses background colors and shape markers for intuitive signal display
- High Automation Level: Full automation from signal generation to order execution minimizes human intervention
Strategy Risks
- Choppy Market Risk: May generate frequent false breakout signals in sideways markets
- Lag Risk: Moving average calculations have inherent lag, potentially missing optimal entry points
- Parameter Sensitivity: Different parameter settings significantly affect strategy performance
- Market Environment Dependency: Signals may become unstable in highly volatile market conditions
- Systemic Risk: Stop-loss settings may fail during major market events
Strategy Optimization Directions
- Incorporate Volume Indicators: Add trading volume as additional signal confirmation
- Optimize Stop-Loss Mechanism: Consider implementing trailing stops or ATR-based dynamic stops
- Add Trend Filters: Implement long-period moving averages as trend filters
- Improve Signal Filtering: Consider market volatility and adjust parameters in high volatility periods
- Dynamic Parameter Adjustment: Dynamically adjust overbought/oversold thresholds based on market conditions
Summary
This strategy constructs a robust trading system by combining Stochastic RSI indicators with candlestick patterns. While maintaining operational simplicity, the system achieves effective risk control. Through appropriate parameter optimization and signal filtering, the strategy can adapt to various market environments. Traders are advised to conduct thorough historical data backtesting and adjust parameters according to specific market characteristics before live implementation.
Source Pine Script
/*backtest
start: 2019-12-23 08:00:00
end: 2024-11-27 08:00:00
period: 1d
basePeriod: 1d
exchanges: [{"eid":"Futures_Binance","currency":"BTC_USDT"}]
*/

//@version=5
strategy("Stochastic RSI Strategy with Candlestick Confirmation", overlay=true)

// Input parameters for Stochastic RSI
rsiPeriod = input.int(14, title="RSI Period")
stochRsiPeriod = input.int(14, title="Stochastic RSI Period")
kPeriod = input.int(3, title="K Period")
dPeriod = input.int(3, title="D Period")

// Overbought and Oversold levels
overboughtLevel = input.int(80, title="Overbought Level", minval=50, maxval=100)
oversoldLevel = input.int(20, title="Oversold Level", minval=0, maxval=50)

// Calculate RSI
rsi = ta.rsi(close, rsiPeriod)

// Calculate Stochastic RSI
stochRSI = ta.stoch(rsi, rsi, rsi, stochRsiPeriod)  // Stochastic RSI calculation using the RSI values

// Apply smoothing to StochRSI K and D lines
k = ta.sma(stochRSI, kPeriod)
d = ta.sma(k, dPeriod)

// Plot Stochastic RSI on separate panel
plot(k, title="StochRSI K", color=color.green, linewidth=2)
plot(d, title="StochRSI D", color=color.red, linewidth=2)
hline(overboughtLevel, "Overbought", color=color.red, linestyle=hline.style_dashed)
hline(oversoldLevel, "Oversold", color=color.green, linestyle=hline.style_dashed)

// Buy and Sell Signals based on both Stochastic RSI and Candlestick patterns
buySignal = ta.crossover(k, oversoldLevel) and close > open  // Buy when K crosses above oversold level and close > open (bullish candle)
sellSignal = ta.crossunder(k, overboughtLevel) and close < open  // Sell when K crosses below overbought level and close < open (bearish candle)

// Plot Buy/Sell signals as shapes on the chart
plotshape(series=buySignal, title="Buy Signal", location=location.belowbar, color=color.green, style=shape.labelup, text="BUY", size=size.small)
plotshape(series=sellSignal, title="Sell Signal", location=location.abovebar, color=color.red, style=shape.labeldown, text="SELL", size=size.small)

// Background color shading for overbought/oversold conditions
bgcolor(k > overboughtLevel ? color.new(color.red, 90) : na)
bgcolor(k < oversoldLevel ? color.new(color.green, 90) : na)

// Place actual orders with Stochastic RSI + candlestick pattern confirmation
if (buySignal)
    strategy.entry("Long", strategy.long)

if (sellSignal)
    strategy.entry("Short", strategy.short)

// Optionally, you can add exit conditions for closing long/short positions
// Close long if K crosses above the overbought level
if (ta.crossunder(k, overboughtLevel))
    strategy.close("Long")

// Close short if K crosses below the oversold level
if (ta.crossover(k, oversoldLevel))
    strategy.close("Short")
Published by ChaoZhang on the FMZ strategy square · last modified 2024-11-29. Collected in the Quant Trading Vault. Unvalidated research: re-test with your own data and costs before trusting it.
Build this with AgenKit
A spec is not a trading system. Paste this into your coding agent and AgenKit runs a specialist team — architecture, test-first build, risk gates, review — with paper trading on by default.
/agenkit build a production-grade trading bot with a backtest engine, risk controls and paper trading by default from strategies/Dynamic-Trading-System-with-Stochastic-RSI-and-Candlestick-Confirmation.md- npx agenkit install engineering-kit in your project
- Paste the command into your agent and approve each phase
- Get tests, backtest, risk controls and a paper-trading switch
Understand it first
Before you run this, read the lesson behind the idea and how to backtest it honestly. Specs like this one are the survivors of an unknown number of trials; deflate their results accordingly.
Related specs
- Dynamic Stop Loss Strategy Adaptive to ATR FluctuationsPine Script · Breakout · 1h
- Momentum Breakout Intraday Trading StrategyPine Script · Breakout · 5m
- Multi Indicator Trend Following and Volatility Breakout StrategyPine Script · Breakout · 2h
- Bull Market Tracking SystemPine Script · Breakout · 1h
- Dual MA Momentum Breakout StrategyPine Script · Breakout · 1h
- EMA and Bollinger Bands Breakout StrategyPine Script · Breakout · 1h