Strategy vault / Trend following
Dynamic Trend Following Trading Strategy Based on Gann Angles
The Dynamic Trend-Following Trading Strategy Based on Gann Angles is a quantitative trading method that combines Gann theory with swing high and low points. This strategy utilizes Gann angles to identify market…
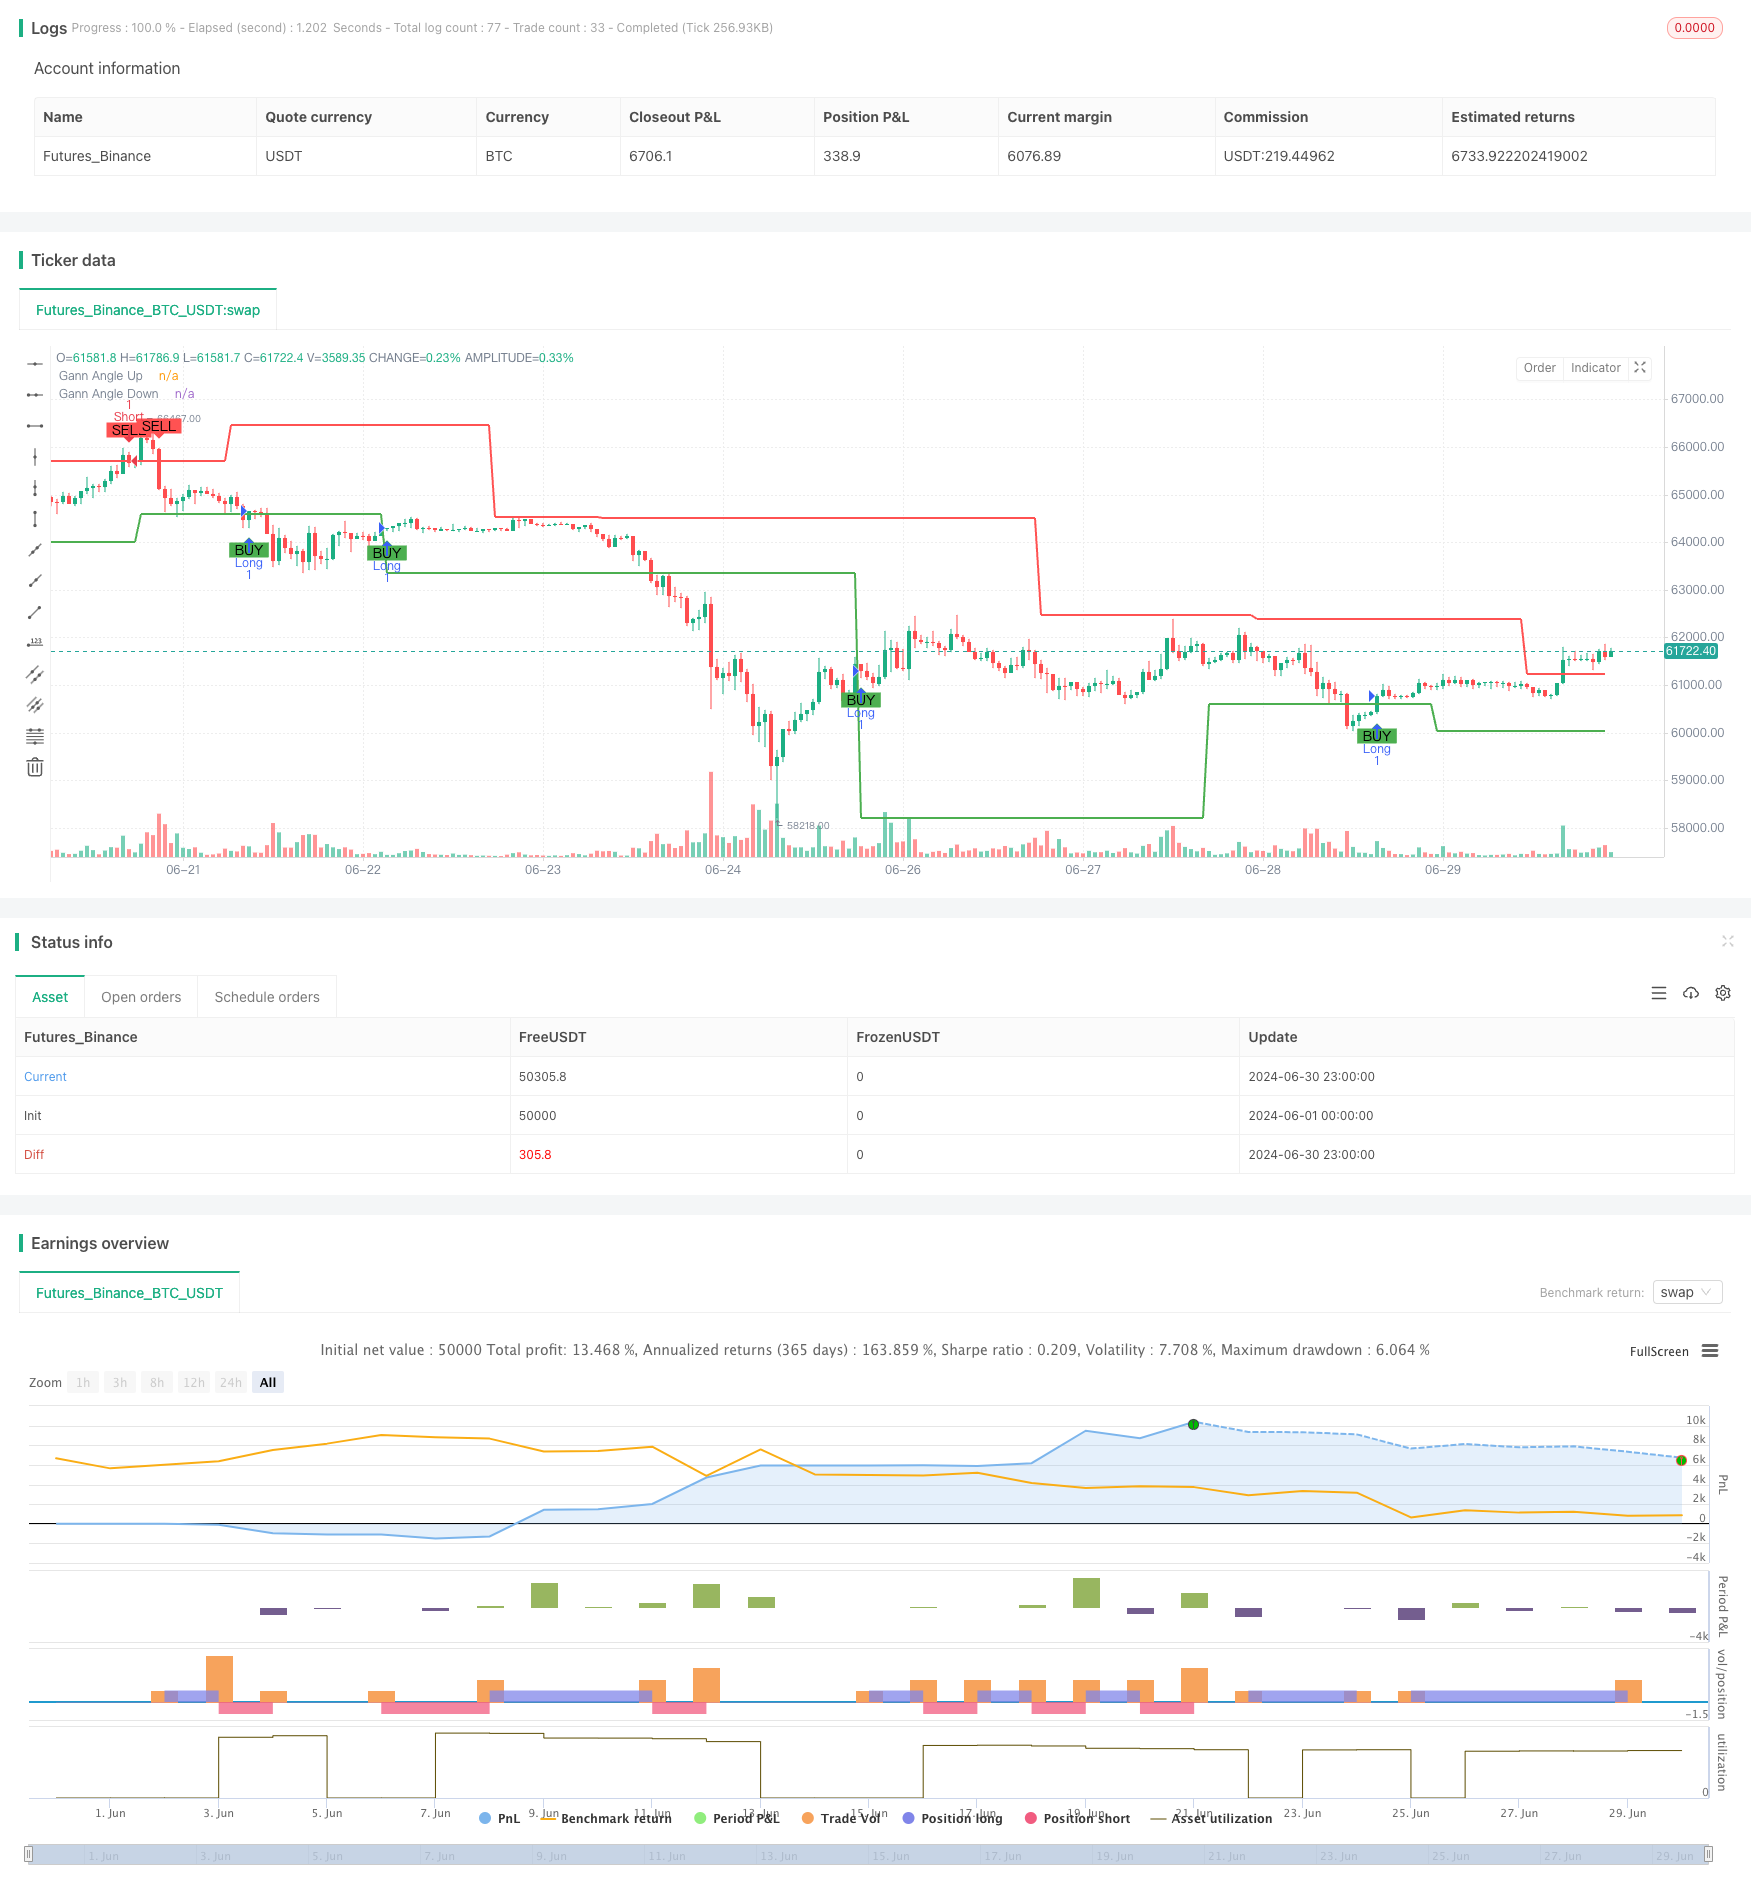
Overview
The Dynamic Trend-Following Trading Strategy Based on Gann Angles is a quantitative trading method that combines Gann theory with swing high and low points. This strategy utilizes Gann angles to identify market trends and generates trading signals when price breaks through these angle lines. The core of the strategy lies in dynamically adjusting Gann angle lines to adapt to price movements in different market environments. By setting stop-loss and take-profit levels, the strategy can also effectively manage risk and improve overall trading performance.
Strategy Principles
Swing High and Low Identification: The strategy uses a user-defined period (default 14) to identify swing high and low points. These points serve as the basis for drawing Gann angle lines.
Gann Angle Line Calculation: Based on the identified swing highs and lows, the strategy calculates both upward and downward Gann angle lines. The angles can be customized by the user, with a default of 45 degrees.
Trade Signal Generation:
- A long signal is triggered when the price breaks above the rising Gann angle line.
- A short signal is triggered when the price breaks below the falling Gann angle line.
Risk Management: The strategy incorporates customizable stop-loss and take-profit levels to control risk exposure for each trade.
Strategy Advantages
Dynamic Adaptability: By continuously adjusting the starting points of Gann angle lines, the strategy can adapt to different market environments and price fluctuations.
Trend Following: The strategy is essentially a trend-following system, helping to capture significant gains from major trends.
Risk Management: Built-in stop-loss and take-profit mechanisms help control risk and prevent excessive losses from individual trades.
Visualization: The strategy displays Gann angle lines and trading signals intuitively on the chart, making it easier for traders to understand market structure and strategy logic.
Flexibility: Multiple adjustable parameters (such as angles, period length, stop-loss and take-profit levels) allow the strategy to adapt to different trading instruments and timeframes.
Strategy Risks
Choppy Market Risk: In sideways or choppy markets, frequent false breakouts may lead to excessive erroneous signals and trading costs.
Slippage Risk: In fast-moving markets, actual execution prices may differ significantly from the prices at which signals are generated.
Over-optimization Risk: Excessive adjustment of parameters to fit historical data may lead to poor future performance.
Trend Reversal Risk: The strategy may incur losses during early trend reversals.
To mitigate these risks, consider:
- Introducing additional filters (such as volatility indicators) to reduce false signals in choppy markets.
- Using limit orders instead of market orders to control slippage.
- Validating strategy performance across multiple timeframes to ensure robustness.
- Considering moving stop-loss methods, such as trailing stops, to better protect profits.
Strategy Optimization Directions
Multi-timeframe Analysis: Integrating trend information from higher timeframes can improve the quality of trading signals.
Dynamic Angle Adjustment: Dynamically adjusting Gann angles based on market volatility can help the strategy better adapt to different market environments.
Volume Consideration: Using trading volume as a supplementary indicator can enhance signal reliability.
Machine Learning Optimization: Utilizing machine learning algorithms to dynamically optimize strategy parameters can improve adaptability.
Correlation Filtering: In multi-instrument trading, considering correlations between instruments can reduce systemic risk.
Drawdown Control: Introducing a drawdown control mechanism based on the equity curve can better protect capital during major trend reversals.
These optimization directions aim to enhance the strategy's robustness and profitability while reducing inherent risks.
Conclusion
The Dynamic Trend-Following Trading Strategy Based on Gann Angles is a trading system that combines classical technical analysis theory with modern quantitative methods. It identifies and follows market trends through dynamically adjusted Gann angle lines and generates trading signals at key breakout points. The strategy's strengths lie in its dynamic adaptability and built-in risk management mechanisms, but it also faces challenges such as choppy markets and over-optimization risks. Through further optimization and refinement, such as introducing multi-timeframe analysis and dynamic parameter adjustment, this strategy has the potential to become a powerful and flexible trading tool. However, traders should always exercise caution when using this strategy, fully understand its principles and risks, and conduct thorough backtesting and simulated trading before live implementation.
Source Pine Script
/*backtest
start: 2024-06-01 00:00:00
end: 2024-06-30 23:59:59
period: 1h
basePeriod: 15m
exchanges: [{"eid":"Futures_Binance","currency":"BTC_USDT"}]
*/

//@version=5
strategy("Gann Strategy", overlay=true)

// User inputs
gann_angle_up = input.float(45, "Gann Angle Up (degrees)")
gann_angle_down = input.float(45, "Gann Angle Down (degrees)")
length = input.int(14, "Length for Swing High/Low")

// Functions to find Swing High and Swing Low
var float swingHigh = na
var float swingLow = na

if (high[length] == ta.highest(high, length * 2 + 1))
    swingHigh := high[length]

if (low[length] == ta.lowest(low, length * 2 + 1))
    swingLow := low[length]

// Gann angles calculation
gann_up = swingLow + math.tan(gann_angle_up * math.pi / 180) * (bar_index - ta.valuewhen(not na(swingLow), bar_index, 0))
gann_down = swingHigh - math.tan(gann_angle_down * math.pi / 180) * (bar_index - ta.valuewhen(not na(swingHigh), bar_index, 0))

// Gann angles visualization
plot(na(gann_up) ? na : gann_up, color=color.green, linewidth=2, title="Gann Angle Up")
plot(na(gann_down) ? na : gann_down, color=color.red, linewidth=2, title="Gann Angle Down")

// Entry and exit conditions
longCondition = ta.crossover(close, gann_up)
shortCondition = ta.crossunder(close, gann_down)

if (longCondition)
    strategy.entry("Long", strategy.long)

if (shortCondition)
    strategy.entry("Short", strategy.short)

// Visualization of entry and exit points
plotshape(series=longCondition, location=location.belowbar, color=color.green, style=shape.labelup, text="BUY")
plotshape(series=shortCondition, location=location.abovebar, color=color.red, style=shape.labeldown, text="SELL")

// Setting stop loss and take profit levels
stopLossLevel = input.float(1.0, "Stop Loss Level (percent)") / 100
takeProfitLevel = input.float(2.0, "Take Profit Level (percent)") / 100

if (strategy.position_size > 0)
    strategy.exit("Take Profit/Stop Loss", from_entry="Long", limit=close * (1 + takeProfitLevel), stop=close * (1 - stopLossLevel))

if (strategy.position_size < 0)
    strategy.exit("Take Profit/Stop Loss", from_entry="Short", limit=close * (1 - takeProfitLevel), stop=close * (1 + stopLossLevel))
Published by ChaoZhang on the FMZ strategy square · last modified 2024-07-30. Collected in the Quant Trading Vault. Unvalidated research: re-test with your own data and costs before trusting it.
Build this with AgenKit
A spec is not a trading system. Paste this into your coding agent and AgenKit runs a specialist team — architecture, test-first build, risk gates, review — with paper trading on by default.
/agenkit build a production-grade trading bot with a backtest engine, risk controls and paper trading by default from strategies/Dynamic-Trend-Following-Trading-Strategy-Based-on-Gann-Angles.md- npx agenkit install engineering-kit in your project
- Paste the command into your agent and approve each phase
- Get tests, backtest, risk controls and a paper-trading switch
Understand it first
Before you run this, read the lesson behind the idea and how to backtest it honestly. Specs like this one are the survivors of an unknown number of trials; deflate their results accordingly.
Related specs
- 200 EMA VWAP MFI Trend Following StrategyPine Script · Trend following · 1d
- 4 EMA Trend StrategyPine Script · Trend following · 1d
- ADX MA and EMA Long Only Trend Tracking StrategyPine Script · Trend following · 1d
- ATR Dynamic Profit Target and Stop Loss StrategyPine Script · Trend following · 1d
- ATR Dynamic Trend Following and EMA Crossover Trading StrategyPine Script · Trend following · 1d
- ATR and Moving Average Crossover Hybrid StrategyPine Script · Trend following · 1h