Strategy vault / Trend following
Dynamic Trend Identification Strategy with Exponential Moving Average and Adaptive Volatility Threshold
The OneTrend Lite EMA strategy is an innovative trend-tracking trading approach that combines Exponential Moving Averages (EMA), Average Directional Index (ADX), and Average True Range (ATR) to identify and capture…

Overview
The OneTrend Lite EMA strategy is an innovative trend-tracking trading approach that combines Exponential Moving Averages (EMA), Average Directional Index (ADX), and Average True Range (ATR) to identify and capture market trends. The strategy aims to provide clear, rule-based trading signals while dynamically adjusting sensitivity to market volatility.
Strategy Principles
The strategy's core revolves around three key technical indicators:
- Fast and Slow EMAs: Capturing price trend changes by calculating exponential moving averages of different period lengths
- Custom ADX Calculation: Evaluating trend strength and market momentum
- Dynamic ATR Threshold: Adaptively adjusting trend determination sensitivity based on ADX values
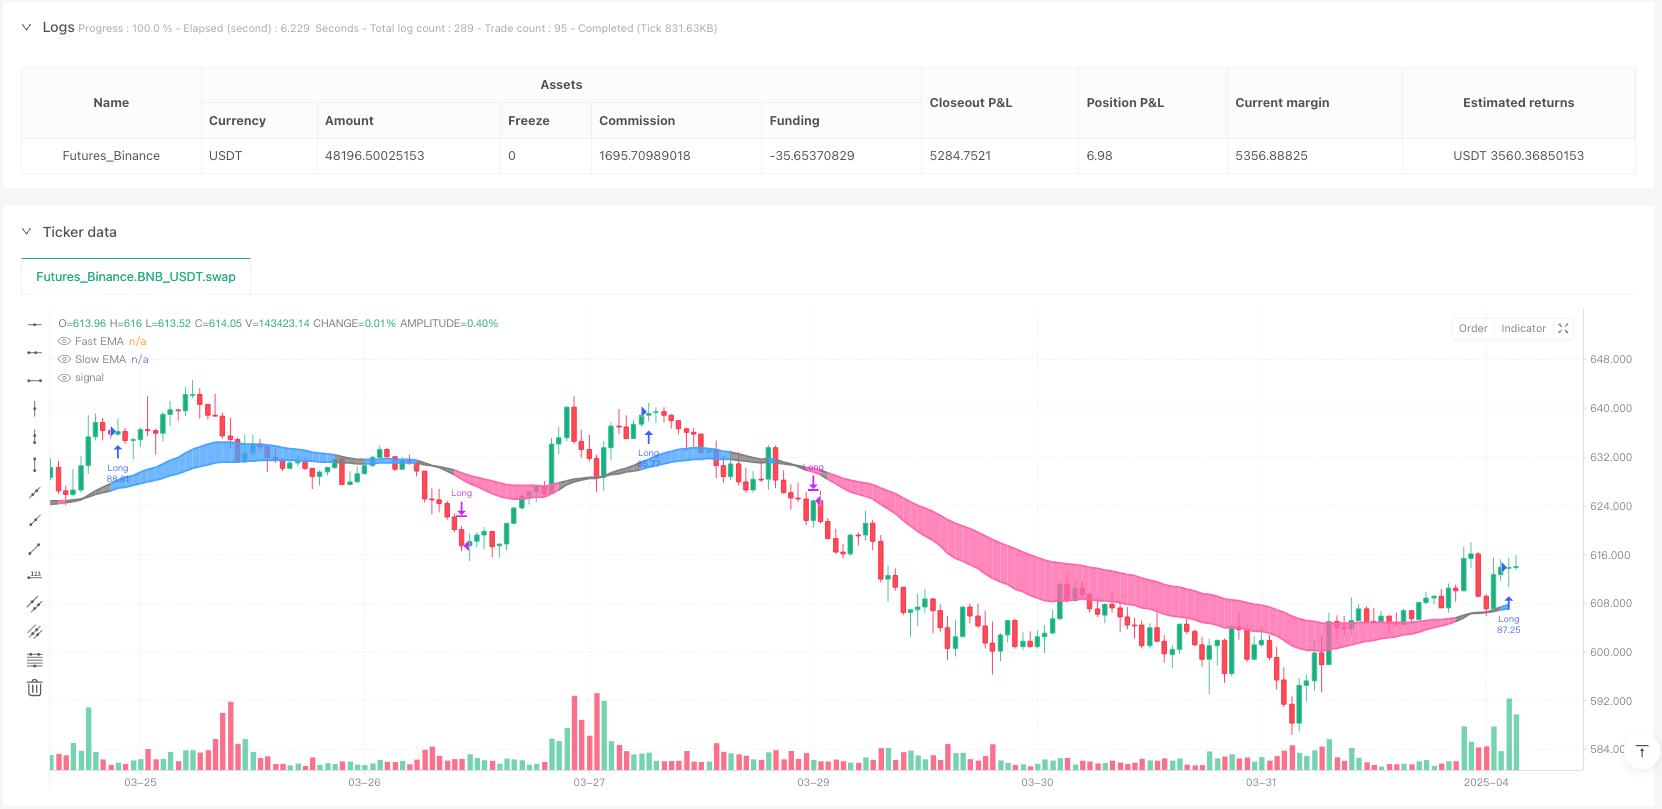
The strategy uses a 30-period fast EMA and a 60-period slow EMA, generating trading signals by combining their difference with an adaptive ATR multiplier. It enters the blue trend zone (bullish) when the fast EMA exceeds the dynamic threshold and enters the pink zone (bearish) when it falls below the threshold.
Strategy Advantages
- High adaptability: Dynamic ADX threshold allows sensitivity adjustment based on different market conditions
- Multi-dimensional indicator combination: Integrating EMA, ADX, and ATR improves signal accuracy
- Clear visual trading intervals: Blue and pink areas intuitively display trend changes
- Flexible risk management: Adjustable EMA periods, ATR multipliers, and ADX thresholds
Strategy Risks
- Lagging nature: EMAs inherently have a lag, potentially delaying response in rapidly changing markets
- Performance in oscillating markets: May generate frequent and ineffective trading signals in markets lacking clear trends
- Parameter sensitivity: Strategy performance highly depends on chosen parameters, requiring continuous backtesting and optimization
Strategy Optimization Directions
- Incorporate machine learning algorithms: Using AI to dynamically optimize parameter selection
- Multi-timeframe validation: Verifying strategy stability across different time scales
- Combine additional indicators: Integrating momentum indicators like RSI, MACD to improve signal accuracy
- Adaptive stop-loss mechanism: Dynamically adjusting stop-loss strategies based on ATR
Summary
The OneTrend Lite EMA strategy provides traders with a flexible and intuitive trend-tracking method through innovative indicator combinations and adaptive thresholds. Despite inherent risks, its multi-dimensional analysis and dynamic adjustment capabilities make it a strategy worthy of in-depth research.
Source Pine Script
/*backtest
start: 2024-04-03 00:00:00
end: 2025-04-02 00:00:00
period: 1h
basePeriod: 1h
exchanges: [{"eid":"Futures_Binance","currency":"BNB_USDT"}]
*/

//============================== OneTrend Lite Historical Performance ==============================/
//+--------+-----------+-----------+-----------+--------------------+---------------+---------------+
//| Ticker | Total P&L | Drawdown  | # Trades  | Profitable Trades  | Profit Factor | Best Method   |
//+--------+-----------+-----------+-----------+--------------------+---------------+---------------+
//| BTC    | 557x      | 55.29%    | 11        | 72.73%             | 13.579        | OneTrend Pro  |
//| ETH    | 207x      | 55.11%    | 13        | 46.15%             | 1.696         | OneTrend Pro  |
//| XRP    | 29x       | 99.85%    | 23        | 30.43%             | 1.261         | OneTrend Gaus |
//| SOL    | 152x      | 40.20%    | 8         | 62.50%             | 4.341         | OneTrend Gaus |
//| BNB    | 519x      | 64.29%    | 12        | 50.00%             | 3.351         | OneTrend Lite |
//| DOGE   | 21x       | 89.63%    | 22        | 27.27%             | 1.521         | OneTrend Gaus |
//| ADA    | 9x        | 76.18%    | 9         | 55.56%             | 9.039         | OneTrend Pro  |
//| SUI    | 6.6x      | 11.44%    | 2         | 100.00%            | ∞             | OneTrend Pro  |
//+--------+-----------+-----------+-----------+--------------------+---------------+---------------+

//============================== OneTrend Pro Historical Performance ===============================/
//+--------+-----------+-----------+-----------+--------------------+---------------+---------------+
//| Ticker | Total P&L | Drawdown  | # Trades  | Profitable Trades  | Profit Factor | Best Method   |
//+--------+-----------+-----------+-----------+--------------------+---------------+---------------+
//| BTC    | 723x      | 50.99%    | 41        | 53.66%             | 2.625         | OneTrend Pro  |
//| ETH    | 1925x     | 40.07%    | 31        | 58.06%             | 3.472         | OneTrend Pro  |
//| XRP    | 298x      | 99.97%    | 53        | 37.74%             | 1.87          | OneTrend Gaus |
//| SOL    | 917x      | 73.31%    | 18        | 44.44%             | 2.71          | OneTrend Gaus |
//| BNB    | 353x      | 49.44%    | 31        | 45.16%             | 2.849         | OneTrend Lite |
//| DOGE   | 238x      | 92.38%    | 40        | 40.00%             | 2.389         | OneTrend Gaus |
//| ADA    | 39x       | 71.96%    | 31        | 35.48%             | 1.684         | OneTrend Pro  |
//| SUI    | 8.7x      | 31.53%    | 4         | 50.00%             | 13.457        | OneTrend Pro  |
//+--------+-----------+-----------+-----------+--------------------+---------------+---------------+

//=========================== OneTrend Gaussian Historical Performance =============================/
//+--------+-----------+-----------+-----------+--------------------+---------------+---------------+
//| Ticker | Total P&L | Drawdown  | # Trades  | Profitable Trades  | Profit Factor | Best Method   |
//+--------+-----------+-----------+-----------+--------------------+---------------+---------------+
//| BTC    | 107x      | 72.45%    | 26        | 57.69%             | 5.5           | OneTrend Pro  |
//| ETH    | 10x       | 40.07%    | 31        | 58.06%             | 3.472         | OneTrend Pro  |
//| XRP    | 1125x     | 99.94%    | 29        | 48.28%             | 1.509         | OneTrend Gaus |
//| SOL    | 925x      | 52.10%    | 11        | 63.64%             | 11.338        | OneTrend Gaus |
//| BNB    | 434x      | 58.10%    | 22        | 59.09%             | 4.845         | OneTrend Lite |
//| DOGE   | 487x      | 90.48%    | 40        | 32.50%             | 2.263         | OneTrend Gaus |
//| ADA    | 20x       | 71.96%    | 31        | 35.48%             | 1.684         | OneTrend Pro  |
//| SUI    | 3.3x      | 31.53%    | 4         | 50.00%             | 13.457        | OneTrend Pro  |
//+--------+-----------+-----------+-----------+--------------------+---------------+---------------+

//@version=6
strategy("OneTrend Lite EMA", overlay=true, default_qty_type=strategy.percent_of_equity, default_qty_value=100, initial_capital = 10000)

// --- USER INPUTS ---
// EMA settings
emaFastLen = 30
emaSlowLen = 60
atrLen     = 60

// ADX settings
adxLen       = 14
adxThreshold = 20

// ATR multipliers for trend conditions
atrMultStrong = 0.3
atrMultWeak   = 0.1

// --- CALCULATIONS ---
// Calculate EMAs and their difference
emaFast = ta.ema(close, emaFastLen)
emaSlow = ta.ema(close, emaSlowLen)
emaDiff = emaFast - emaSlow

// --- Custom ADX Calculation ---
up      = ta.change(high)
down    = -ta.change(low)
plusDM  = (up > down and up > 0) ? up : 0.0
minusDM = (down > up and down > 0) ? down : 0.0
trur    = ta.rma(ta.tr, adxLen)
plusDI  = 100 * ta.rma(plusDM, adxLen) / trur
minusDI = 100 * ta.rma(minusDM, adxLen) / trur
dx      = 100 * math.abs(plusDI - minusDI) / (plusDI + minusDI)
adxVal  = ta.rma(dx, adxLen)

// Determine the dynamic ATR multiplier based solely on ADX
dynamicAtrMult = adxVal > adxThreshold ? atrMultStrong : atrMultWeak

// Define bull (blue) and bear (pink) zones using the dynamic multiplier
emaBull = emaDiff > dynamicAtrMult * ta.atr(atrLen)
emaBear = emaDiff < -dynamicAtrMult * ta.atr(atrLen)

// --- PLOTTING ---
clrBull    = color.rgb(70, 163, 255)   // Blue for bull
clrBear    = color.rgb(255, 102, 170)   // Pink for bear
clrNeutral = color.rgb(128, 128, 128)   // Gray for neutral

fastPlot = plot(emaFast, linewidth=2, color=emaBull ? clrBull : emaBear ? clrBear : clrNeutral, title="Fast EMA")
slowPlot = plot(emaSlow, linewidth=2, color=emaBull ? clrBull : emaBear ? clrBear : clrNeutral, title="Slow EMA")
fill(fastPlot, slowPlot, color=emaBull ? color.new(clrBull, 70) : emaBear ? color.new(clrBear, 70) : color.new(clrNeutral, 70))

// --- STRATEGY LOGIC ---
// Enter long immediately when the zone turns blue, and exit when it turns pink.
if emaBull
    strategy.entry("Long", strategy.long, comment="Long Entry")
if emaBear
strategy.close("Long", comment="Close Long")Published by ianzeng123 on the FMZ strategy square · last modified 2025-04-03. Collected in the Quant Trading Vault. Unvalidated research: re-test with your own data and costs before trusting it.
Build this with AgenKit
A spec is not a trading system. Paste this into your coding agent and AgenKit runs a specialist team — architecture, test-first build, risk gates, review — with paper trading on by default.
/agenkit build a production-grade trading bot with a backtest engine, risk controls and paper trading by default from strategies/Dynamic-Trend-Identification-Strategy-with-Exponential-Moving-Average-and-Adaptive-Volatility-Threshold.md- npx agenkit install engineering-kit in your project
- Paste the command into your agent and approve each phase
- Get tests, backtest, risk controls and a paper-trading switch
Understand it first
Before you run this, read the lesson behind the idea and how to backtest it honestly. Specs like this one are the survivors of an unknown number of trials; deflate their results accordingly.
Related specs
- Multi Indicator Crossover Dynamic Stop Loss Trend Following StrategyPine Script · Trend following · 1d
- Dual Trend Strategy with EMA Crossover and RSI FilterPine Script · Trend following · 1d
- Multi Timeframe Volume and Trend Confluence Trading StrategyPine Script · Trend following · 1d
- Multi timeframe Trend Tracking Strategy Based on Impulse MACD and Dual Moving Average CrossoverPine Script · Trend following · 1d
- Gaussian Cross EMA Trend Retracement StrategyPine Script · Trend following · 1d
- Indicator Verification Automated Trading StrategyPine Script · Trend following · 10m