Dynamic Trend Momentum Trading Strategy
This strategy combines multiple indicators such as EMA, MACD, VWAP, and RSI to capture high-probability trading opportunities. It uses EMA to determine the trend direction, MACD for momentum, VWAP for volume, and RSI…
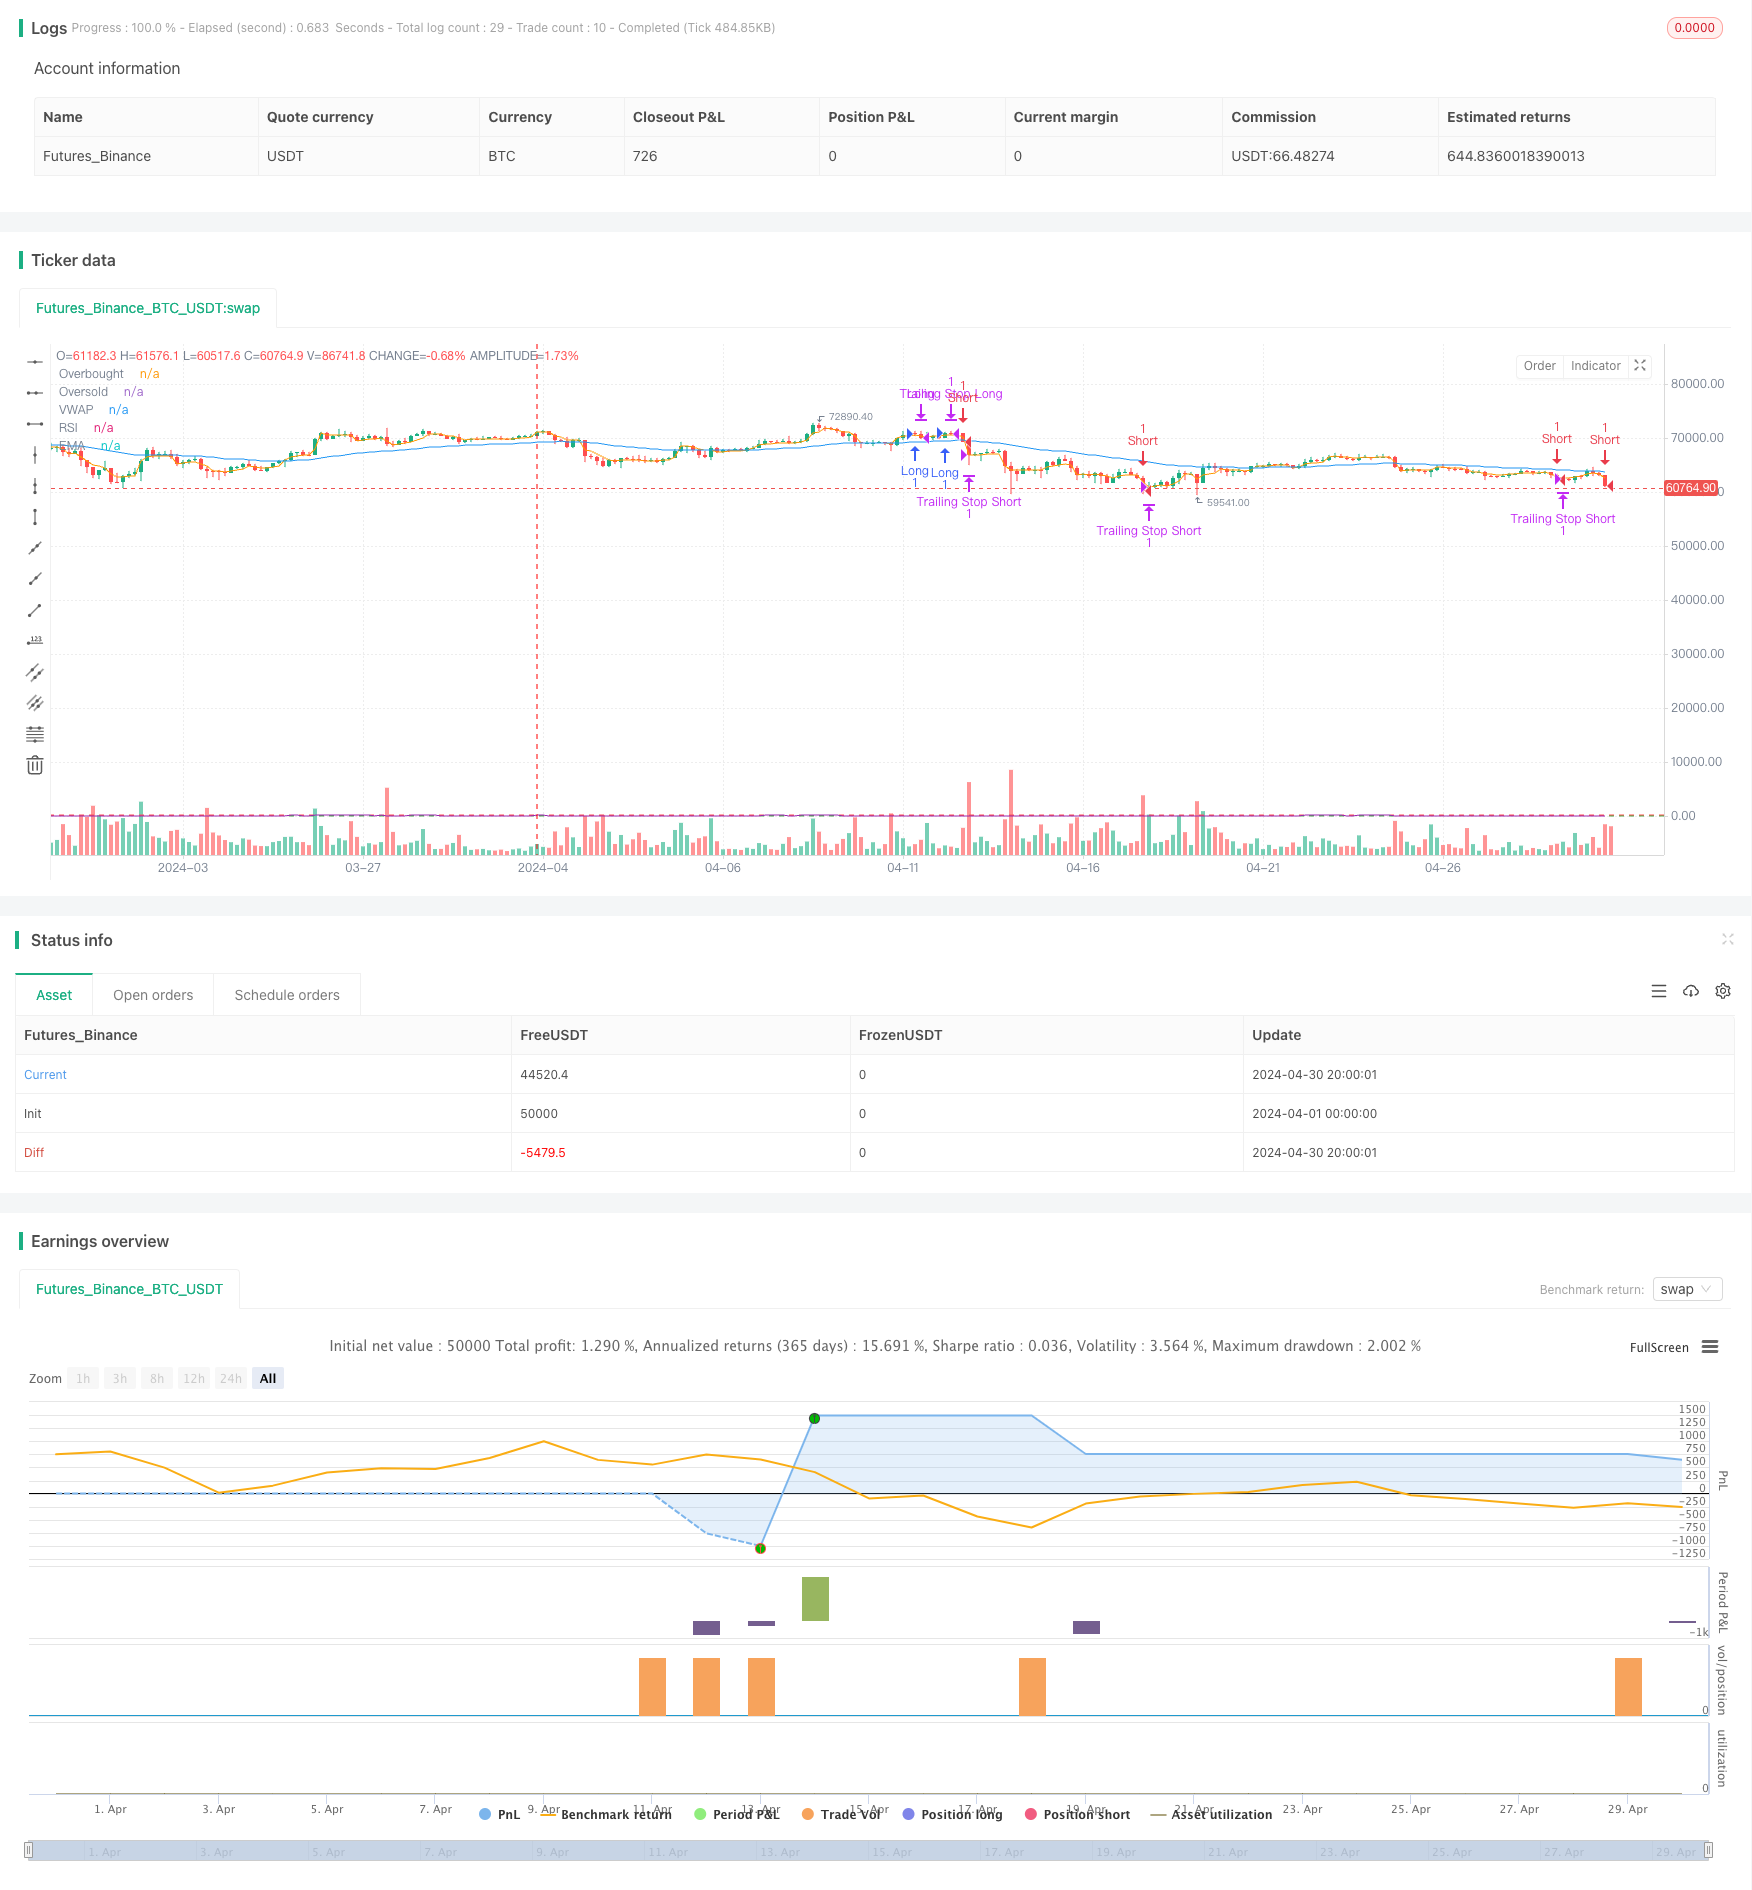
Overview
This strategy combines multiple indicators such as EMA, MACD, VWAP, and RSI to capture high-probability trading opportunities. It uses EMA to determine the trend direction, MACD for momentum, VWAP for volume, and RSI for overbought and oversold conditions. The strategy generates buy and sell signals based on a combination of these indicators while using a trailing stop loss to protect profits.
Strategy Principles
- EMA is used to determine the trend direction. When the price is above the EMA, it is considered an uptrend, and when below, it is considered a downtrend.
- MACD is used to gauge momentum. When the MACD fast line crosses above the slow line, momentum is considered to be turning bullish, and when it crosses below, momentum is considered to be turning bearish.
- VWAP is used to assess volume. When the price is above VWAP, buying pressure is considered to be stronger than selling pressure, and when below, selling pressure is considered to be stronger.
- RSI is used to determine overbought and oversold conditions. When RSI is above 70, it is considered overbought, and when below 30, it is considered oversold.
- A buy signal is generated when the price is above the EMA, the MACD fast line crosses above the slow line, the price is above VWAP, and RSI is below the overbought level.
- A sell signal is generated when the price is below the EMA, the MACD fast line crosses below the slow line, the price is below VWAP, and RSI is above the oversold level.
- Position size is calculated based on account equity and risk percentage.
- A trailing stop loss is used to protect profits, with the stop loss price moving along with the price.
Strategy Advantages
- The combination of multiple indicators provides a more comprehensive assessment of market conditions, improving the accuracy of trading signals.
- The use of a trailing stop loss helps protect profits during trend continuation and reduces drawdowns.
- Calculating position size based on account equity and risk percentage allows for control over the risk of each trade.
- Parameters can be adjusted according to user preferences, enhancing the flexibility of the strategy.
Strategy Risks
- In choppy markets, frequent trading signals may lead to overtrading and commission losses.
- During trend reversals, the trailing stop loss may not exit positions quickly enough, leading to larger drawdowns.
- Parameter selection needs to be optimized for different markets and instruments, and inappropriate parameters may lead to poor strategy performance.
Strategy Optimization Directions
- Consider adding more filtering conditions, such as volume and volatility, to further improve signal accuracy.
- Consider using more dynamic stop loss methods, such as ATR stop loss, to better adapt to different market conditions.
- Consider optimizing parameters using methods like genetic algorithms to find the optimal parameter combination.
- Consider incorporating position sizing and money management strategies to better control risk and enhance returns.
Summary
This strategy combines multiple indicators to assess market conditions and generate trading signals while using a trailing stop loss to protect profits. Strategy parameters can be adjusted according to user preferences, enhancing the flexibility of the strategy. However, the strategy may perform poorly in choppy markets and face larger drawdowns during trend reversals, so it needs to be optimized and improved for different markets and instruments. Future optimizations can consider adding more filtering conditions, dynamic stop loss methods, parameter optimization, and position sizing to improve the stability and profitability of the strategy.
Source Pine Script
/*backtest
start: 2024-04-01 00:00:00
end: 2024-04-30 23:59:59
period: 4h
basePeriod: 15m
exchanges: [{"eid":"Futures_Binance","currency":"BTC_USDT"}]
*/

//@version=5
strategy("Intraday Strategy", overlay=true)

// Input parameters
emaLength = input.int(50, title="EMA Length")
macdShort = input.int(12, title="MACD Short Period")
macdLong = input.int(26, title="MACD Long Period")
macdSignal = input.int(9, title="MACD Signal Period")
rsiLength = input.int(14, title="RSI Length")
rsiOverbought = input.int(70, title="RSI Overbought Level")
rsiOversold = input.int(30, title="RSI Oversold Level")
risk = input.float(1, title="Risk Percentage", minval=0.1, step=0.1)
trailOffset = input.float(0.5, title="Trailing Stop Offset", minval=0.1, step=0.1)

// Calculating indicators
ema = ta.ema(close, emaLength)
[macdLine, signalLine, _] = ta.macd(close, macdShort, macdLong, macdSignal)
rsi = ta.rsi(close, rsiLength)
vwap = ta.vwap(close)

// Entry conditions
longCondition = ta.crossover(macdLine, signalLine) and close > ema and rsi < rsiOverbought and close > vwap
shortCondition = ta.crossunder(macdLine, signalLine) and close < ema and rsi > rsiOversold and close < vwap

// Exit conditions
longExitCondition = ta.crossunder(macdLine, signalLine) or close < ema
shortExitCondition = ta.crossover(macdLine, signalLine) or close > ema

// Position sizing based on risk percentage
capital = strategy.equity
positionSize = (capital * (risk / 100)) / close

// Executing trades
if (longCondition)
    strategy.entry("Long", strategy.long, qty=1)
if (shortCondition)
    strategy.entry("Short", strategy.short, qty=1)

if (longExitCondition)
    strategy.close("Long")
if (shortExitCondition)
    strategy.close("Short")

// Trailing stop loss
if (strategy.position_size > 0)
    strategy.exit("Trailing Stop Long", from_entry="Long", trail_price=close, trail_offset=trailOffset)
if (strategy.position_size < 0)
    strategy.exit("Trailing Stop Short", from_entry="Short", trail_price=close, trail_offset=trailOffset)

// Plotting indicators
plot(ema, title="EMA", color=color.blue)
hline(rsiOverbought, "Overbought", color=color.red)
hline(rsiOversold, "Oversold", color=color.green)
plot(rsi, title="RSI", color=color.purple)
plot(vwap, title="VWAP", color=color.orange)
Published by ChaoZhang on the FMZ strategy square · last modified 2024-05-23. Collected in the Quant Trading Vault. Unvalidated research: re-test with your own data and costs before trusting it.
Build this with AgenKit
A spec is not a trading system. Paste this into your coding agent and AgenKit runs a specialist team — architecture, test-first build, risk gates, review — with paper trading on by default.
/agenkit build a production-grade trading bot with a backtest engine, risk controls and paper trading by default from strategies/Dynamic-Trend-Momentum-Trading-Strategy.md- npx agenkit install engineering-kit in your project
- Paste the command into your agent and approve each phase
- Get tests, backtest, risk controls and a paper-trading switch
Understand it first
Before you run this, read the lesson behind the idea and how to backtest it honestly. Specs like this one are the survivors of an unknown number of trials; deflate their results accordingly.
Related specs
- Advanced Multi Indicator Trend Following and Momentum Quantitative Trading StrategyPine Script · Momentum · 1h
- Intelligent Momentum Mixed Indicator Zero Day Options Strategy ModelPine Script · Momentum · 1d
- Momentum Trend Tracking Strategy 431417Pine Script · Momentum · 5m
- Multi Indicator Comprehensive Analysis Quantitative Trading Strategy Trend Momentum and Volatility Collaborative Prediction ModelPine Script · Momentum · 3m
- Multi factor Fusion Strategy Multi factor Fusion StrategyPine Script · Momentum · 3h
- KST EMA Momentum Trend Following StrategyPine Script · Momentum · 1d