Ehlers Smoothed Stochastic RSI Strategy
The main idea of this strategy is to use the Ehlers SuperSmoother filter to process the Stochastic RSI indicator, filtering out many false signals and obtaining more reliable trading signals. The basic principle is…
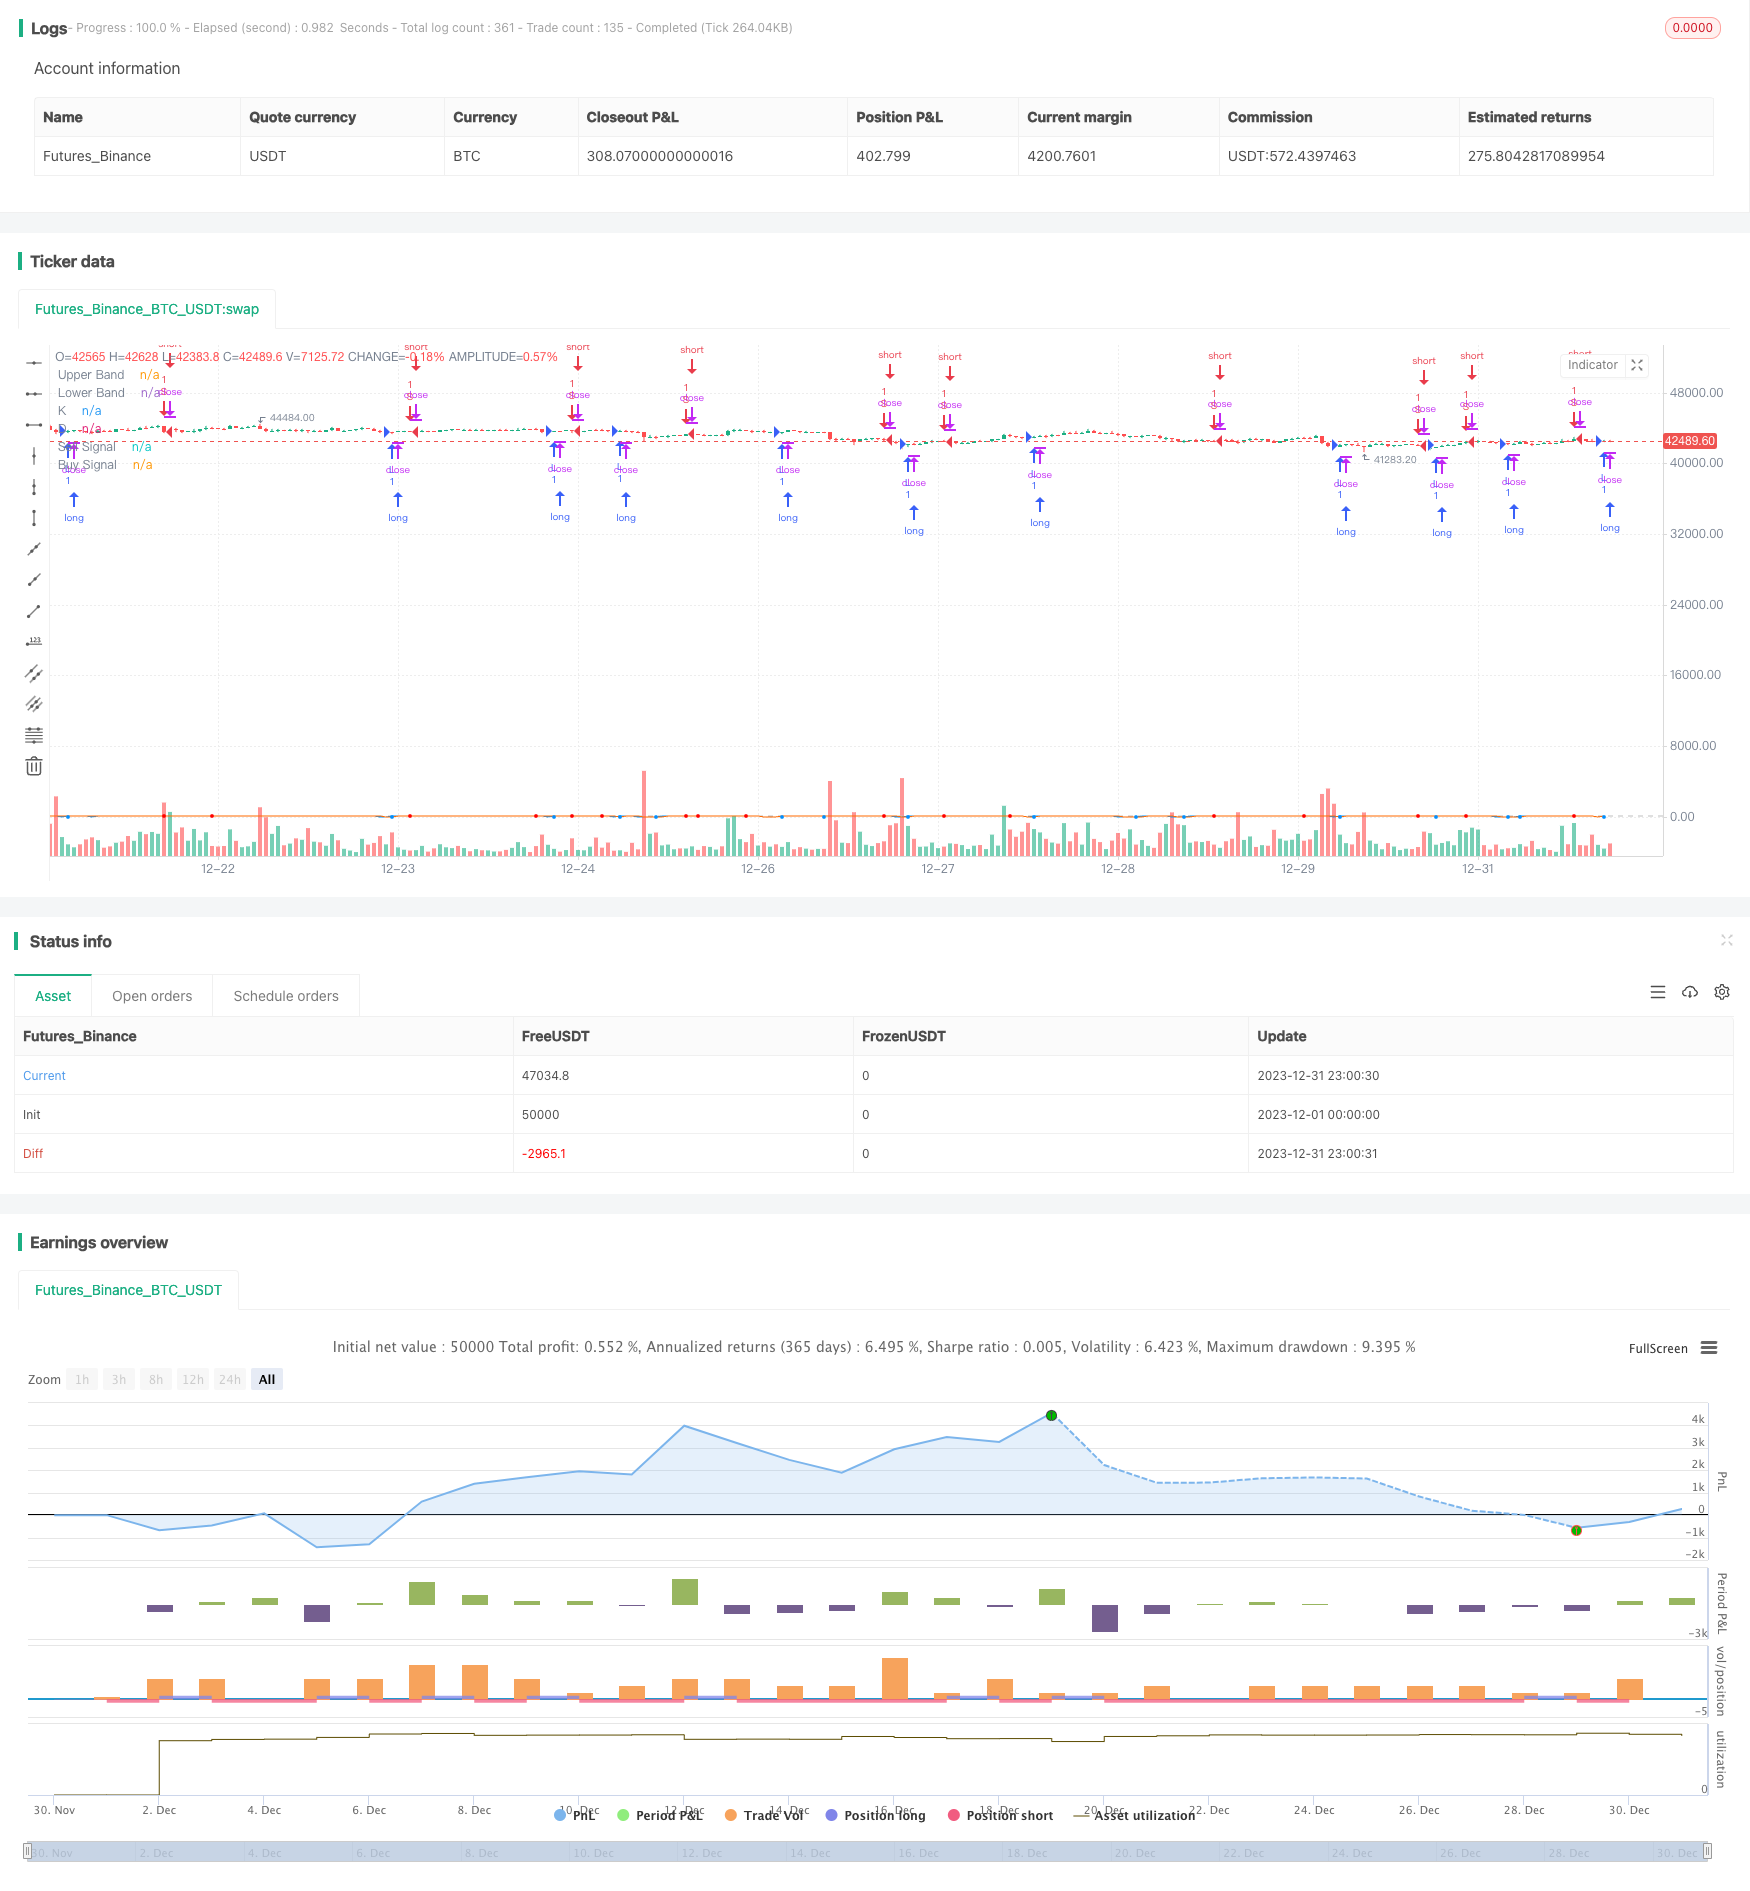
Overview
The main idea of this strategy is to use the Ehlers SuperSmoother filter to process the Stochastic RSI indicator, filtering out many false signals and obtaining more reliable trading signals. The basic principle is to first calculate the Stochastic RSI indicator, then use the Ehlers SuperSmoother filter to smooth it, and finally go long or short based on the crossover between it and its own moving average line.
Strategy Logic
This strategy first calculates the RSI indicator of the logarithmic closing price, then calculates the Stochastic indicator based on the RSI indicator, which is a typical relative strength index indicator. To filter out false signals, the Ehlers SuperSmoother filter is used to process the Stochastic RSI. Finally, go long when the Stochastic RSI line has a golden cross with its own moving average line, and go short when there is a death cross. So the key points of this strategy are: 1) Calculate the Stochastic RSI indicator; 2) Use the Ehlers SuperSmoother filter; 3) Form trading signals with moving average crossover.
Advantage Analysis
The biggest advantage of this strategy is the use of the Ehlers SuperSmoother filter, which can effectively filter out many false signals and make trading signals more reliable. In addition, the Stochastic RSI indicator itself has very good breakthrough and trend tracking capabilities. Therefore, this strategy can correctly identify trends, establish positions at the right time, and close positions at the right time.
Risk Analysis
The main risk of this strategy is that it is prone to wrong signals when the market fluctuates sharply. When the price fluctuates sharply within a narrow range, the Stochastic RSI indicator will generate many false up and down signals. At this time, the effect of the Ehlers SuperSmoother filter will also be compromised. In addition, the lag of indicators may also bring some risks in some violent market conditions.
To reduce these risks, parameters can be adjusted appropriately, such as increasing the cycle of the Stochastic indicator, reducing the degree of smoothness, etc., to further filter out false signals. In addition, consider combining other indicators or patterns to form multiple filter conditions and avoid the risks of wrong signals.
Optimization Directions
The main optimization directions for this strategy are:
Optimize parameter settings. Optimize parameters like length and smoothing constants of Stochastic RSI through extensive backtesting.
Add stop loss mechanisms. Set trailing stop or pending orders to lock in profits and reduce drawdowns.
Combine with other indicators or patterns. Consider combining with volatility indicators, moving averages etc. to add multiple filter conditions and further reduce risks.
Adjust position sizing based on analysis of higher timeframes. Dynamically adjust the position size of each trade based on trend analysis results from higher timeframes.
Summary
This strategy first calculates the Stochastic RSI indicator, then processes it with the Ehlers SuperSmoother filter, and finally generates trading signals with the moving average crossover to determine the trend correctly. The advantage lies in the combination of indicator and filter, which can effectively filter out false signals and obtain high probability trading opportunities. The main risks come from inappropriate parameter settings and lack of stop loss mechanisms. Methods like parameter optimization, adding stop loss, and strategy optimization can further improve the stability and profitability.
Parameters
| Name | Default | What it controls |
|---|---|---|
| v_input_1 | 6 | From Month |
| v_input_2 | true | From Day |
| v_input_3 | 2018 | From Year |
| v_input_4 | 7 | To Month |
| v_input_5 | 30 | To Day |
| v_input_6 | 2018 | To Year |
| v_input_7 | 7 | K |
| v_input_8 | 2 | D |
| v_input_9 | 10 | RSI Length |
| v_input_10 | 3 | Stochastic Length |
| v_input_11 | true | Buy/Sell Signals |
| v_input_12_close | 0 | Source: close | high | low | open | hl2 | hlc3 | hlcc4 | ohlc4 |
Source Pine Script
/*backtest
start: 2023-12-01 00:00:00
end: 2023-12-31 23:59:59
period: 1h
basePeriod: 15m
exchanges: [{"eid":"Futures_Binance","currency":"BTC_USDT"}]
*/

//@version=3
strategy("ES Stoch RSI Strategy [krypt]", overlay=true, calc_on_order_fills=true, calc_on_every_tick=true, initial_capital=10000, currency='USD')

//Backtest Range
FromMonth = input(defval = 06, title = "From Month", minval = 1)
FromDay   = input(defval = 1, title = "From Day", minval = 1)
FromYear  = input(defval = 2018, title = "From Year", minval = 2014)
ToMonth   = input(defval = 7, title = "To Month", minval = 1)
ToDay     = input(defval = 30, title = "To Day", minval = 1)
ToYear    = input(defval = 2018, title = "To Year", minval = 2014)

PI = 3.14159265359

drop1st(src) =>
    x = na
    x := na(src[1]) ? na : src

xlowest(src, len) =>
    x = src
    for i = 1 to len - 1
        v = src[i]
        if (na(v))
            break
        x := min(x, v)
    x

xhighest(src, len) =>
    x = src
    for i = 1 to len - 1
        v = src[i]
        if (na(v))
            break
        x := max(x, v)
    x

xstoch(c, h, l, len) =>
    xlow = xlowest(l, len)
    xhigh = xhighest(h, len)
    100 * (c - xlow) / (xhigh - xlow)

Stochastic(c, h, l, length) =>
    rawsig = xstoch(c, h, l, length)
    min(max(rawsig, 0.0), 100.0)

xrma(src, len) =>
    sum = na
    sum := (src + (len - 1) * nz(sum[1], src)) / len

xrsi(src, len) =>
    msig = nz(change(src, 1), 0.0)
    up = xrma(max(msig, 0.0), len)
    dn = xrma(max(-msig, 0.0), len)
    rs = up / dn
    100.0 - 100.0 / (1.0 + rs)

EhlersSuperSmoother(src, lower) =>
	a1 = exp(-PI * sqrt(2) / lower)
	coeff2 = 2 * a1 * cos(sqrt(2) * PI / lower)
	coeff3 = -pow(a1, 2)
	coeff1 = (1 - coeff2 - coeff3) / 2
	filt = na
	filt := nz(coeff1 * (src + nz(src[1], src)) + coeff2 * filt[1] + coeff3 * filt[2], src)

smoothK = input(7, minval=1, title="K")
smoothD = input(2, minval=1, title="D")
lengthRSI = input(10, minval=1, title="RSI Length")
lengthStoch = input(3, minval=1, title="Stochastic Length")
showsignals = input(true, title="Buy/Sell Signals")
src = input(close,  title="Source")

ob = 80
os = 20
midpoint = 50

price = log(drop1st(src))
rsi1 = xrsi(price, lengthRSI)
rawsig = Stochastic(rsi1, rsi1, rsi1, lengthStoch)
sig = EhlersSuperSmoother(rawsig, smoothK)
ma = sma(sig, smoothD)

plot(sig, color=#0094ff, title="K", transp=0)
plot(ma, color=#ff6a00, title="D", transp=0)
lineOB = hline(ob, title="Upper Band", color=#c0c0c0)
lineOS = hline(os, title="Lower Band", color=#c0c0c0)
fill(lineOB, lineOS, color=purple, title="Background")

// Buy/Sell Signals

// use curvature information to filter out some false positives
mm1 = change(change(ma, 1), 1)
mm2 = change(change(ma, 2), 2)
ms1 = change(change(sig, 1), 1)
ms2 = change(change(sig, 2), 2)

sellsignals = showsignals and (mm1 + ms1 < 0 and mm2 + ms2 < 0) and crossunder(sig, ma) and sig[1] > ob
buysignals = showsignals and (mm1 + ms1 > 0 and mm2 + ms2 > 0) and crossover(sig, ma) and sig[1] < os

ploff = 4
plot(buysignals ? sig[1] - ploff : na, style=circles, color=#008fff, linewidth=3, title="Buy Signal", transp=0)
plot(sellsignals ? sig[1] + ploff : na, style=circles, color=#ff0000, linewidth=3, title="Sell Signal", transp=0)

longCondition = buysignals
if (longCondition)
    strategy.entry("L", strategy.long, comment="Long", when=(buysignals))

shortCondition = sellsignals
if (shortCondition)
strategy.entry("S", strategy.short, comment="Short", when=(sellsignals))Published by ChaoZhang on the FMZ strategy square · last modified 2024-01-26. Collected in the Quant Trading Vault. Unvalidated research: re-test with your own data and costs before trusting it.
Build this with AgenKit
A spec is not a trading system. Paste this into your coding agent and AgenKit runs a specialist team — architecture, test-first build, risk gates, review — with paper trading on by default.
/agenkit build a production-grade trading bot with a backtest engine, risk controls and paper trading by default from strategies/Ehlers-Smoothed-Stochastic-RSI-Strategy.md- npx agenkit install engineering-kit in your project
- Paste the command into your agent and approve each phase
- Get tests, backtest, risk controls and a paper-trading switch
Understand it first
Before you run this, read the lesson behind the idea and how to backtest it honestly. Specs like this one are the survivors of an unknown number of trials; deflate their results accordingly.
Related specs
- Bull Market Tracking SystemPine Script · Breakout · 1h
- Dynamic Stop Loss Strategy Adaptive to ATR FluctuationsPine Script · Breakout · 1h
- Stochastic RSI and Volume Based Trading StrategyPine Script · Breakout · 2h
- Bollinger Bands Stochastic RSI Extreme Signal StrategyPine Script · Breakout · 1d
- CMO and WMA Based Dual Moving Average Trading StrategyPine Script · Breakout · 1h
- Dual Moving Average and MACD Combination Short term Trading StrategyPine Script · Breakout · 1h