EMA Breakthrough Trap Strategy
The EMA Breakthrough Trap Strategy is a versatile trading tool suitable for multiple timeframes including 1-minute and 1-hour charts. It utilizes the 21-day EMA to identify significant market trends, complemented by…
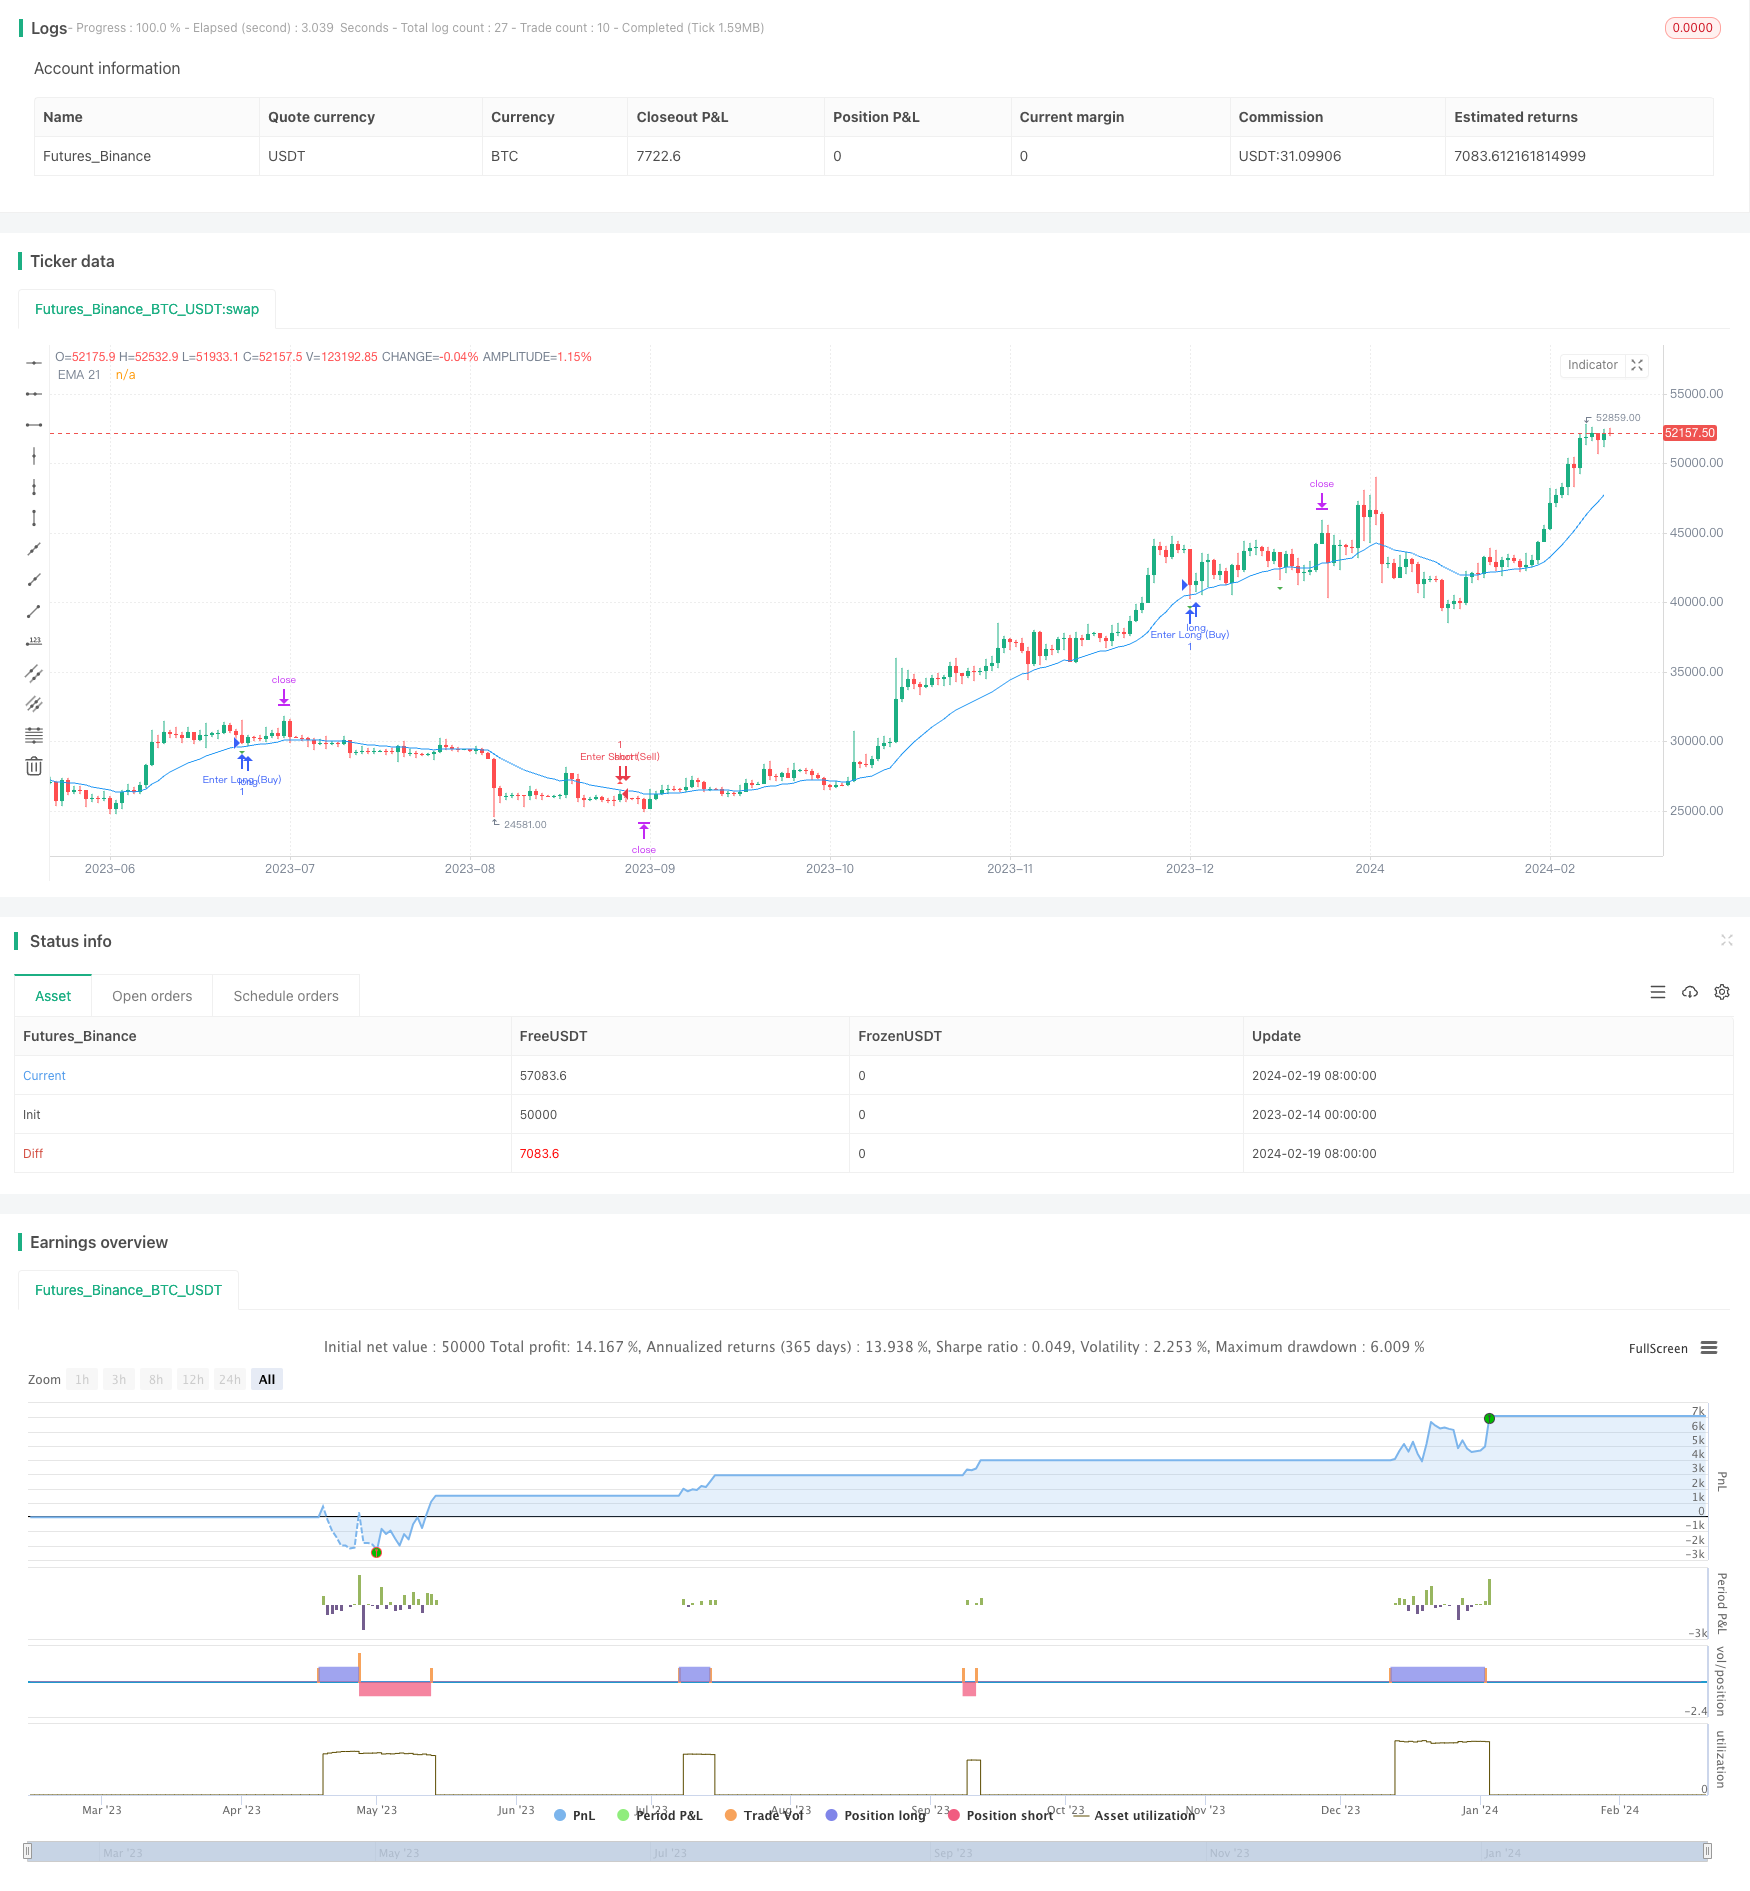
Overview
The EMA Breakthrough Trap Strategy is a versatile trading tool suitable for multiple timeframes including 1-minute and 1-hour charts. It utilizes the 21-day EMA to identify significant market trends, complemented by ATR-based identification of potential bull and bear traps. Notably, it achieves an impressive profitability rate averaging around 85% across different frames and peaking at 88% in optimal conditions.
Strategy Logic
The strategy first calculates the 21-day Exponential Moving Average (EMA) to judge the overall trend and direction. Then it calculates the recent N days' highest and lowest prices (N is an adjustable parameter). If the closing price is higher than the previous day's highest price, and the subsequent low point has fallen below the highest price multiplied by the ATR indicator, while the closing price has fallen below the 21-day line, a bull trap signal is determined. The judgment logic for bear trap signals is similar.
Once a trap signal is identified, set the stop loss and take profit based on 80% of the distance between the recent highest and lowest prices, and take the reverse position. For example, after identifying a bull trap signal, take a short position and set the take profit and stop loss; after identifying a bear trap signal, take a long position and set the take profit and stop loss.
Advantage Analysis
- Uses EMA to judge trends, high reliability
- Leverages ATR indicator to identify traps accurately
- High profitability up to 85%
- Applicable to multiple timeframes
- Adjustable parameters provide optimization space
Risk Analysis
- EMA judgement may fail during major trend changes
- Inappropriate ATR parameter setting may miss traps
- Unreasonable stop loss/take profit placement may reduce profits or increase losses
- High trading costs and slippage impacts for high frequency trading
Risks can be reduced by optimizing EMA parameters, adjusting ATR coefficients, dynamic trailing stop loss etc.
Optimization Directions
- Optimize ATR parameters and EMA periods to improve identification accuracy
- Add dynamic stop loss mechanism
- Incorporate other indicators to confirm signals
- Test applicability across more timeframes
Conclusion
The EMA Breakthrough Trap Strategy integrates the advantages of trend judgment and trap identification. With low drawdowns and high profitability, it is suitable for various trading styles and is a highly efficient recommended strategy. Further enhancements in stability and profitability space can be achieved through parameter and mechanism optimization.
Parameters
| Name | Default | What it controls |
|---|---|---|
| v_input_1 | 5 | Length |
| v_input_2 | true | ATR Multiplier |
| v_input_3 | 21 | EMA Length |
Source Pine Script
/*backtest
start: 2023-02-14 00:00:00
end: 2024-02-20 00:00:00
period: 1d
basePeriod: 1h
exchanges: [{"eid":"Futures_Binance","currency":"BTC_USDT"}]
*/

//@version=5
strategy("Bull and Bear Trap Strategy with EMA 21 - 1min Chart", overlay=true)

// Inputs
length = input(5, "Length")
atrMultiplier = input(1.0, "ATR Multiplier")
emaLength = input(21, "EMA Length")
price = close
atr = ta.atr(length)

// EMA Calculation
ema21 = ta.ema(price, emaLength)

// Define recent high and low
recentHigh = ta.highest(high, length)
recentLow = ta.lowest(low, length)

// Bull and Bear Trap Detection
bullTrap = price > recentHigh[1] and low <= recentHigh - atr * atrMultiplier and price < ema21
bearTrap = price < recentLow[1] and high >= recentLow + atr * atrMultiplier and price > ema21

// Plotting
plotshape(series=bullTrap, title="Bull Trap", location=location.abovebar, color=color.red, style=shape.triangleup, size=size.small)
plotshape(series=bearTrap, title="Bear Trap", location=location.belowbar, color=color.green, style=shape.triangledown, size=size.small)
plot(ema21, title="EMA 21", color=color.blue)

// Measured Move Implementation
moveSize = recentHigh - recentLow
targetDistance = moveSize * 0.8 // Target at 80% of the move size

// Strategy Execution with Measured Move Targets
if (bullTrap)
    strategy.entry("Enter Short (Sell)", strategy.short)
    strategy.exit("Exit Short (Buy to Cover)", "Enter Short (Sell)", limit=price - targetDistance)

if (bearTrap)
    strategy.entry("Enter Long (Buy)", strategy.long)
    strategy.exit("Exit Long (Sell)", "Enter Long (Buy)", limit=price + targetDistance)
Published by ChaoZhang on the FMZ strategy square · last modified 2024-02-21. Collected in the Quant Trading Vault. Unvalidated research: re-test with your own data and costs before trusting it.
Build this with AgenKit
A spec is not a trading system. Paste this into your coding agent and AgenKit runs a specialist team — architecture, test-first build, risk gates, review — with paper trading on by default.
/agenkit build a production-grade trading bot with a backtest engine, risk controls and paper trading by default from strategies/EMA-Breakthrough-Trap-Strategy.md- npx agenkit install engineering-kit in your project
- Paste the command into your agent and approve each phase
- Get tests, backtest, risk controls and a paper-trading switch
Understand it first
Before you run this, read the lesson behind the idea and how to backtest it honestly. Specs like this one are the survivors of an unknown number of trials; deflate their results accordingly.
Related specs
- BB Breakout StrategyPine Script · Breakout · 1d
- Donchian Channel and Larry Williams Large Trade Index StrategyPine Script · Breakout · 1m
- Dual Breakout Volatility Channel StrategyPine Script · Breakout · 1h
- Dual MA Momentum Breakout StrategyPine Script · Breakout · 1h
- Dynamic ATR Trend Following Strategy Based on Support BreakoutPine Script · Breakout · 1d
- Dynamic ATR based Trailing Stop Trading StrategyPine Script · Breakout · 1d