Strategy vault / Mean reversion
EMA Crossover Fibonacci Reversal Strategy
The EMA Crossover Fibonacci Reversal Strategy is a complex trading system that combines multiple technical indicators. This strategy primarily utilizes the Exponential Moving Average (EMA), Relative Strength Index…
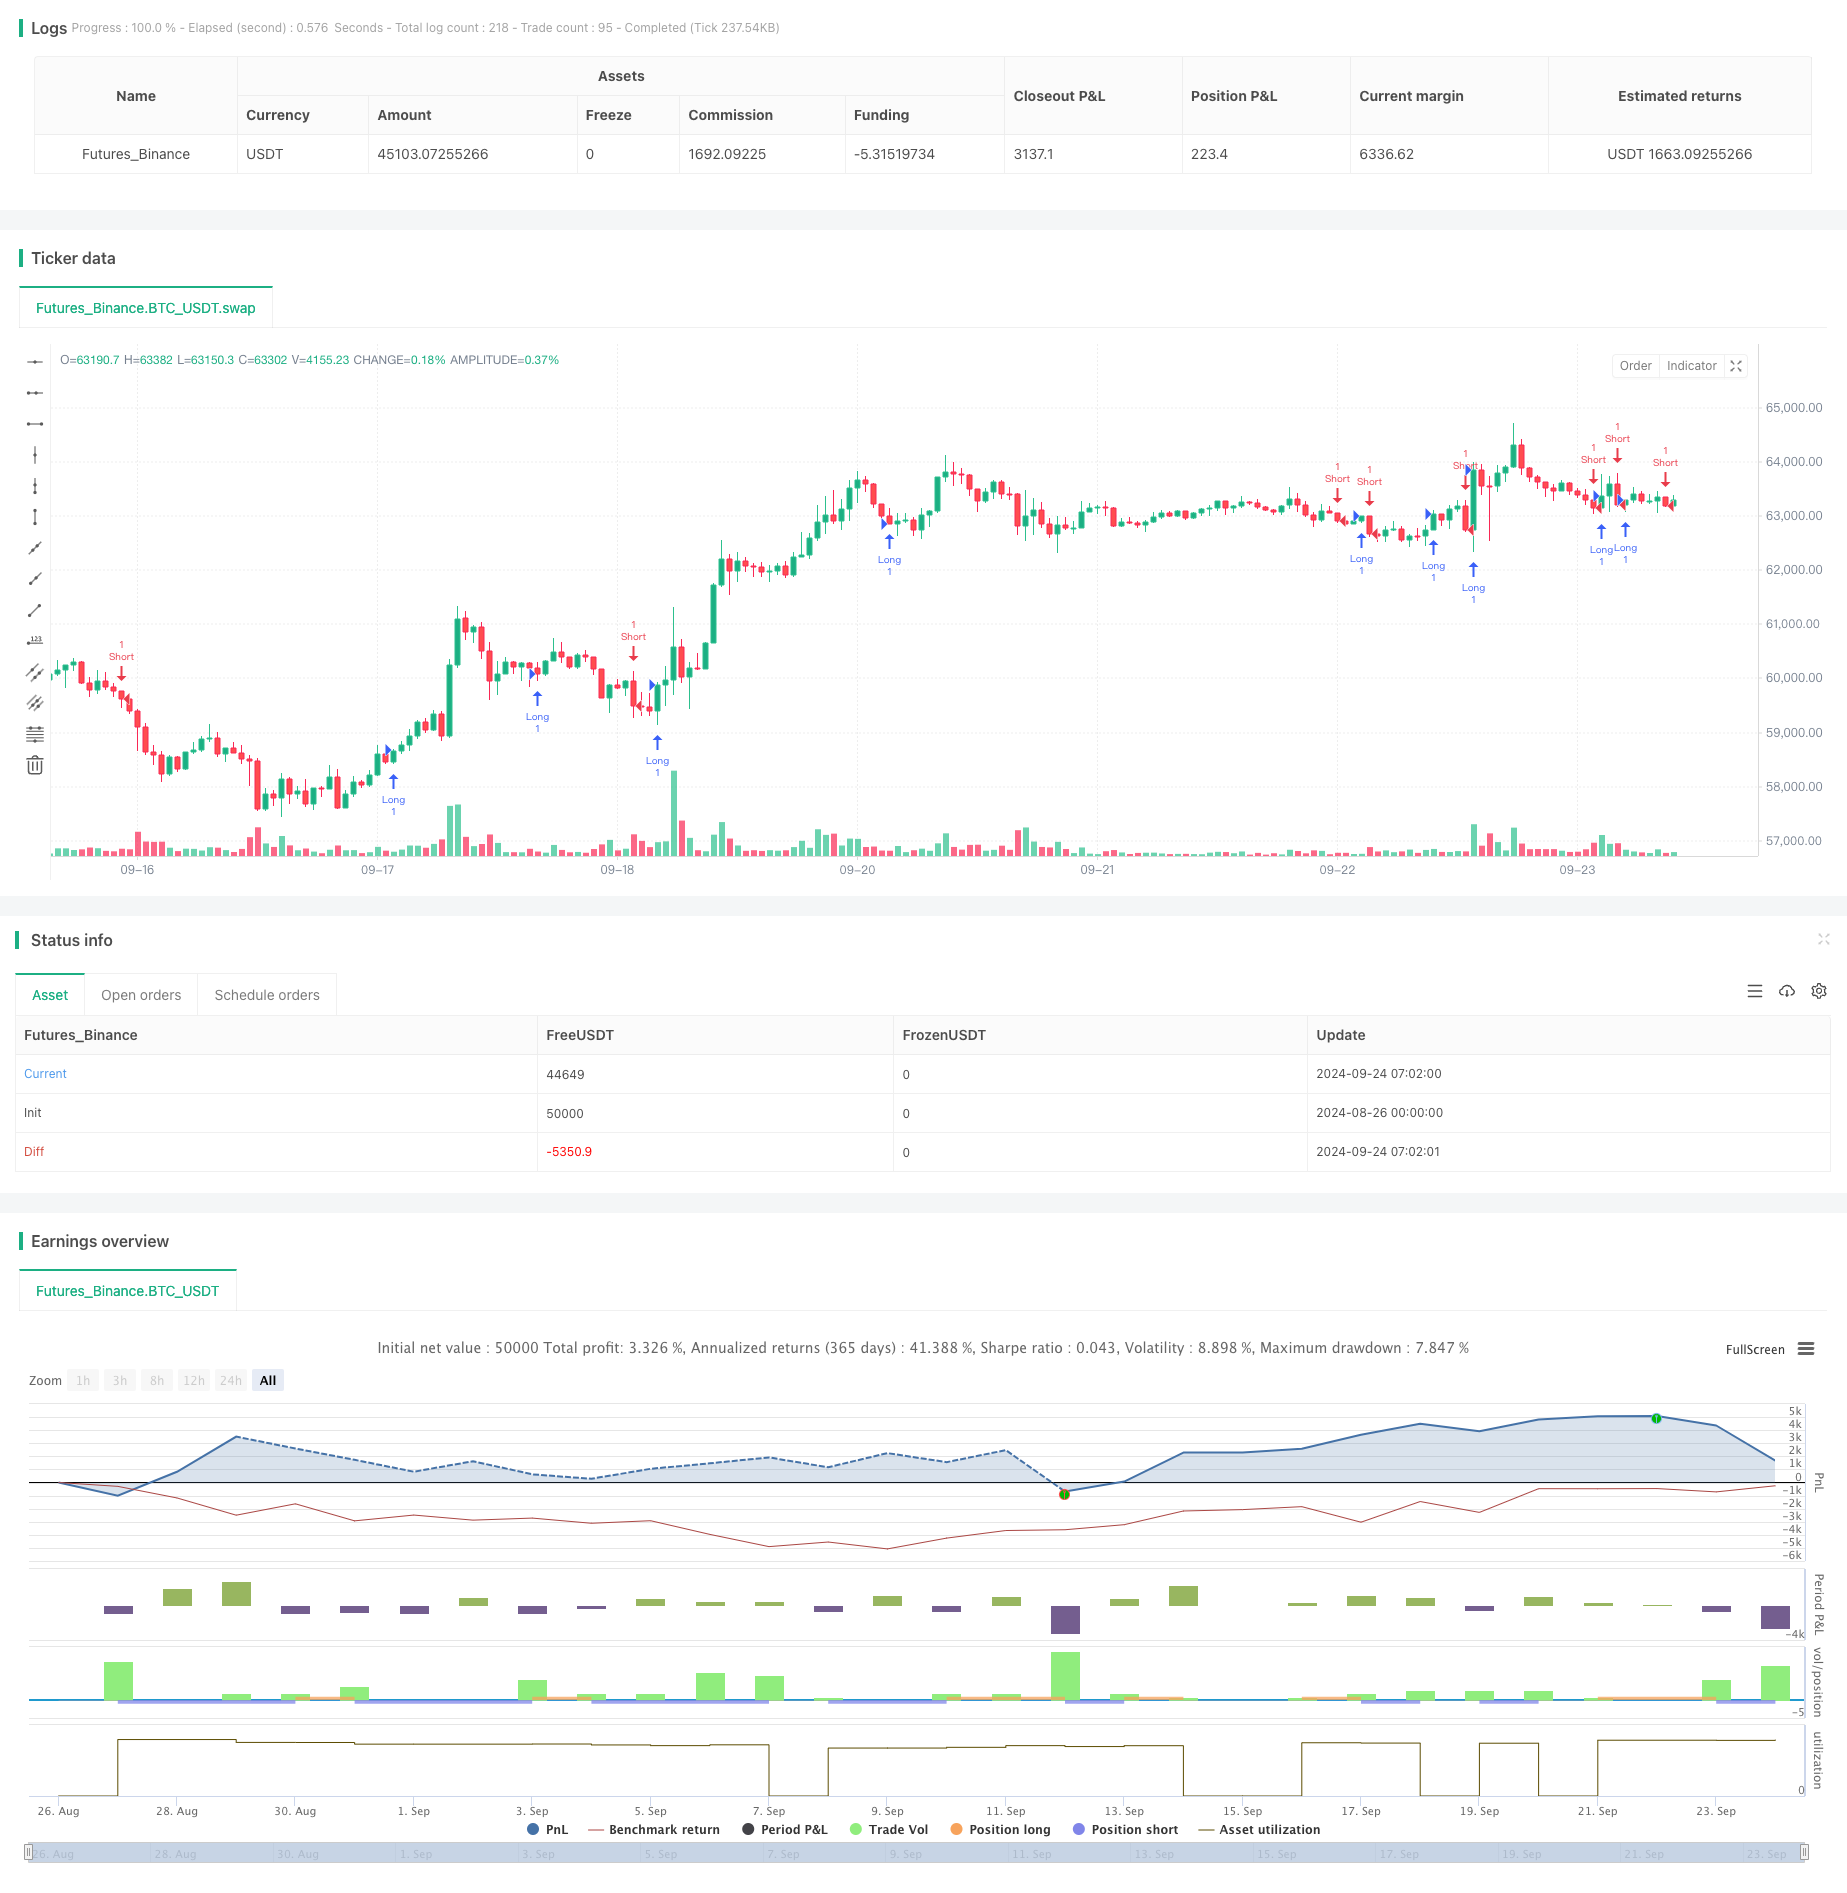
Overview
The EMA Crossover Fibonacci Reversal Strategy is a complex trading system that combines multiple technical indicators. This strategy primarily utilizes the Exponential Moving Average (EMA), Relative Strength Index (RSI), and Fibonacci retracement levels to identify potential trend reversals and continuation opportunities. By synthesizing these indicators, the strategy aims to capture key turning points in the market, enabling profitable trades across various market conditions.
Strategy Principles
The core principles of this strategy include:
EMA Crossover and Rejection: Using the 50-period EMA as a key reference line, potential trend signals are identified when price breaks through or rebounds from the EMA50.
Fibonacci Level Support and Resistance: Fibonacci levels are calculated using the highest and lowest points over 20 periods, with particular focus on the 50%-61.8% zone as potential reversal points.
RSI Overbought/Oversold: The RSI indicator is used to identify overbought and oversold market conditions, especially looking for potential long opportunities when RSI is below 30 in the oversold zone.
Breakout Trading: Monitoring price breakouts above previous highs or below previous lows as confirmation signals for trend continuation or reversal.
Risk Management: Employing fixed percentage take-profit and stop-loss settings to control risk for each trade.
Strategy Advantages
Multi-dimensional Analysis: Combining multiple technical indicators enhances the reliability and accuracy of signals.
High Adaptability: By considering trends, support/resistance, and momentum comprehensively, the strategy can find trading opportunities in various market environments.
Risk Control: Using fixed-ratio take-profit and stop-loss levels effectively manages risk for each trade.
Automated Execution: The strategy can be automated through the TradingView platform, reducing human intervention and emotional influence.
Capital Management: Trading with a fixed percentage of account equity automatically adjusts position sizes as the account balance changes.
Strategy Risks
False Breakout Risk: In ranging markets, frequent false breakouts may lead to consecutive losses.
Slippage Risk: In highly volatile markets, actual execution prices may significantly deviate from expected levels.
Overtrading: Multiple entry conditions may result in frequent trading, increasing transaction costs.
Parameter Sensitivity: Strategy performance may be sensitive to changes in parameters such as EMA periods and RSI settings.
Market Environment Dependency: The strategy may underperform in markets without clear trends.
Strategy Optimization Directions
Dynamic Parameter Adjustment: Consider dynamically adjusting EMA periods and RSI thresholds based on market volatility.
Incorporate Volume Indicators: Integrating volume analysis can improve the reliability of breakout signals.
Time Filters: Add trading time filters to avoid highly volatile periods such as market open and close.
Trend Strength Assessment: Introduce trend strength indicators like ADX to adopt more aggressive strategies in strong trends.
Multi-timeframe Analysis: Incorporate analysis from longer timeframes to improve the accuracy of trade direction.
Conclusion
The EMA Crossover Fibonacci Reversal Strategy is a comprehensive and complex trading system that identifies potential trading opportunities by integrating multiple technical indicators. Its strength lies in analyzing the market from multiple angles, enhancing signal reliability. However, the strategy also faces risks such as false breakouts and overtrading. Through continuous optimization and adjustment, such as dynamic parameter tuning and multi-timeframe analysis, the strategy's performance and stability can be further improved. Overall, this is a promising strategy framework suitable for experienced traders to conduct in-depth research and personalized customization.
Source Pine Script
/*backtest
start: 2024-08-26 00:00:00
end: 2024-09-24 08:00:00
period: 1h
basePeriod: 1h
exchanges: [{"eid":"Futures_Binance","currency":"BTC_USDT"}]
*/

//@version=5
strategy("Counter Trend Trading Strategy", overlay=true)

// Indicateurs
ema50 = ta.ema(close, 50)
rsi = ta.rsi(close, 14)

// Fonction pour calculer les niveaux de Fibonacci
fibonacci_levels(high_price, low_price) =>
    fib_0 = low_price
    fib_0_382 = low_price + (high_price - low_price) * 0.382
    fib_0_5 = low_price + (high_price - low_price) * 0.5
    fib_0_618 = low_price + (high_price - low_price) * 0.618
    fib_1 = high_price
    [fib_0, fib_0_382, fib_0_5, fib_0_618, fib_1]

// Calculer les niveaux de Fibonacci pour la période
var float highest_high = na
var float lowest_low = na
lookback_period = 20

if ta.change(time(timeframe.period))
    highest_high := ta.highest(high, lookback_period)
    lowest_low := ta.lowest(low, lookback_period)

[fib_0, fib_0_382, fib_0_5, fib_0_618, fib_1] = fibonacci_levels(highest_high, lowest_low)

// Détection de figure de continuation avec cassure et retest
continuation_pattern_breakout = (close > ema50) and ta.crossover(close, ema50)

// Détection de rejet de la MM50
rejection_ema50 = (high > ema50 and close < ema50)

// Détection de rejet de niveau Fibonacci
fibonacci_rejection = (close <= fib_0_618 and close >= fib_0_5)

// Détection de divergence RSI
rsi_divergence = (rsi < 30 and close == ta.lowest(close, 14))

// Détection de cassure d'ancien plus bas (LL) ou plus haut (HH)
lower_low_breakout = (close < ta.lowest(low, lookback_period))
higher_high_breakout = (close > ta.highest(high, lookback_period))

// Conditions d'entrée
long_condition = (continuation_pattern_breakout or rejection_ema50 or fibonacci_rejection or rsi_divergence or higher_high_breakout) and close > ema50
short_condition = (continuation_pattern_breakout or rejection_ema50 or fibonacci_rejection or rsi_divergence or lower_low_breakout) and close < ema50

// Exécution des ordres
if (long_condition)
    strategy.entry("Long", strategy.long)
if (short_condition)
    strategy.entry("Short", strategy.short)

// Conditions de sortie
take_profit_long = close * 1.02  // Exemple de prise de profit à 2%
stop_loss_long = close * 0.98    // Exemple de stop loss à 2%

take_profit_short = close * 0.98  // Exemple de prise de profit à 2%
stop_loss_short = close * 1.02    // Exemple de stop loss à 2%

// Sortie pour les positions longues
strategy.exit("Take Profit/Stop Loss Long", from_entry="Long", limit=take_profit_long, stop=stop_loss_long)

// Sortie pour les positions courtes
strategy.exit("Take Profit/Stop Loss Short", from_entry="Short", limit=take_profit_short, stop=stop_loss_short)
Published by ChaoZhang on the FMZ strategy square · last modified 2024-09-26. Collected in the Quant Trading Vault. Unvalidated research: re-test with your own data and costs before trusting it.
Build this with AgenKit
A spec is not a trading system. Paste this into your coding agent and AgenKit runs a specialist team — architecture, test-first build, risk gates, review — with paper trading on by default.
/agenkit build a production-grade trading bot with a backtest engine, risk controls and paper trading by default from strategies/EMA-Crossover-Fibonacci-Reversal-Strategy.md- npx agenkit install engineering-kit in your project
- Paste the command into your agent and approve each phase
- Get tests, backtest, risk controls and a paper-trading switch
Understand it first
Before you run this, read the lesson behind the idea and how to backtest it honestly. Specs like this one are the survivors of an unknown number of trials; deflate their results accordingly.
Related specs
- Fibonacci Channel Based Candlestick Reversal Trading StrategyPine Script · Mean reversion · 1h
- Multi Dimensional Pivot Point Trading System with Dynamic Fibonacci IndicatorsPine Script · Mean reversion · 1d
- Quant Bitcoin Trading Strategy Combining MACD RSI and FIBPine Script · Mean reversion · 10m
- Advanced Fibonacci Retracement Trend Following and Reversal Trading StrategyPine Script · Mean reversion · 3h
- Advanced Momentum EMA Trend Following with RSI Overbought Oversold Trading StrategyPine Script · Mean reversion · 1d
- Advanced Quantitative Trading Strategy Combining RSI Divergence and Moving AveragesPine Script · Mean reversion · 1h