Strategy vault / Trend following
EMA Crossover Trend Following Trading Strategy
This strategy uses the golden cross and death cross of fast and slow EMA lines to determine the trend and sets a profit percentage as the take profit rule to implement trend following trading. It is applicable to any…
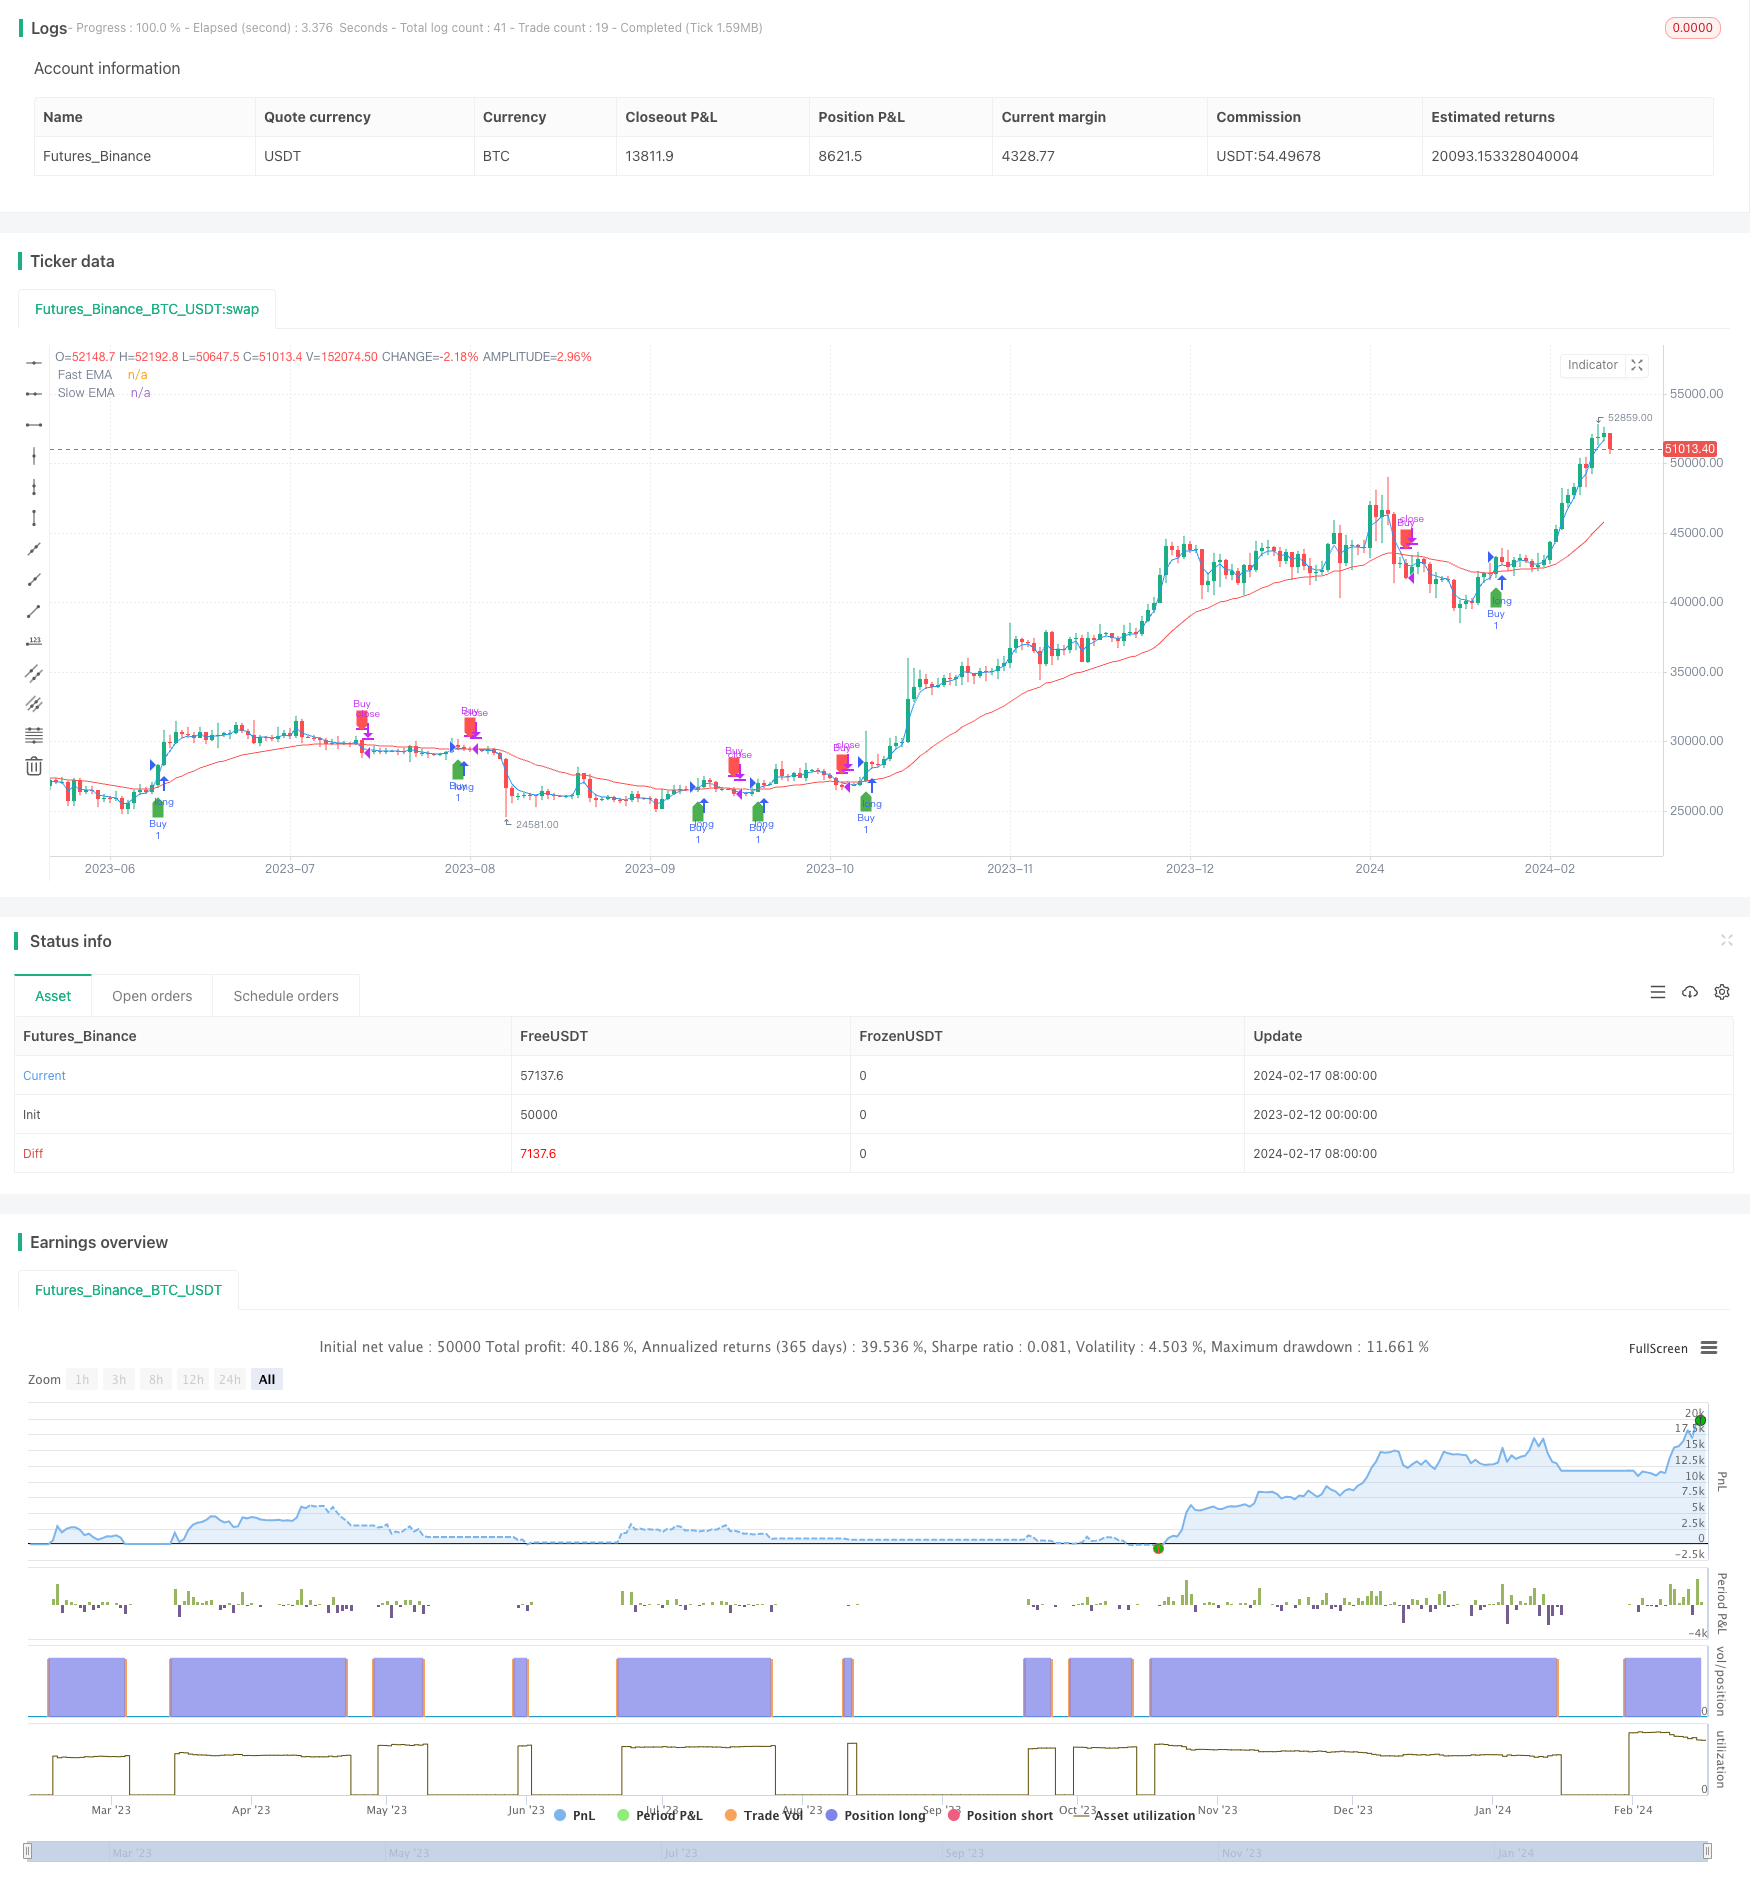
Overview
This strategy uses the golden cross and death cross of fast and slow EMA lines to determine the trend and sets a profit percentage as the take profit rule to implement trend following trading. It is applicable to any timeframe and can capture trends in both indexes and stocks.
Strategy Logic
The strategy employs 3 and 30 period EMAs as trading signals. When the 3EMA crosses above the 30EMA, it signals that price starts to rise which conforms to the buy condition. When the 3EMA crosses below the 30EMA, it signals that price starts to fall which conforms to the sell condition.
In addition, a profit target is configured in the strategy. When price rises to the entry price multiplied by the profit percentage, the position will be closed to lock in more profits and achieve trend following trading.
Advantage Analysis
- Using EMAs to determine trends is simple and easy to grasp.
- Combining trend indicators and take profit rules can effectively control risks and lock in profits.
- Applicable to any timeframe and tradable, great flexibility.
Risk Analysis
- EMA itself has lagging effect on price changes, may cause misjudgments.
- Overly large profit target may lead to failure in timely profit-taking, missing reversal opportunities.
- Stopping tracking too early may result in missing part of the trending move.
Optimization Directions
- Different EMA combinations can be tested to find the optimal parameters.
- Other indicators can be combined to verify the EMA signals and improve accuracy.
- The profit percentage can be dynamically tuned, relaxed during bull market and tightened during bear market.
Conclusion
In conclusion, this is a very practical trend following strategy. It adopts simple EMA indicators to determine the trend direction and sets reasonable profit taking rules to effectively control risks, suitable for long term tracking of stock and index mid-to-long term trends. Further improvements on stability and profit factor can be achieved through parameter optimization and supplementary signal verification indicators.
Parameters
| Name | Default | What it controls |
|---|---|---|
| v_input_1 | 3 | Fast EMA Length |
| v_input_2 | 30 | Slow EMA Length |
| v_input_3 | 100 | Profit Percentage |
Source Pine Script
/*backtest
start: 2023-02-12 00:00:00
end: 2024-02-18 00:00:00
period: 1d
basePeriod: 1h
exchanges: [{"eid":"Futures_Binance","currency":"BTC_USDT"}]
*/

//@version=5
strategy("EMA Crossover Strategy with Target", shorttitle="EMACross", overlay=true)

// Define input parameters
fastLength = input(3, title="Fast EMA Length")
slowLength = input(30, title="Slow EMA Length")
profitPercentage = input(100.0, title="Profit Percentage")

// Calculate EMAs
fastEMA = ta.ema(close, fastLength)
slowEMA = ta.ema(close, slowLength)

// Plot EMAs on the chart
plot(fastEMA, color=color.blue, title="Fast EMA")
plot(slowEMA, color=color.red, title="Slow EMA")

// Buy condition: 3EMA crosses above 30EMA
buyCondition = ta.crossover(fastEMA, slowEMA)

// Sell condition: 3EMA crosses below 30EMA or profit target is reached
sellCondition = ta.crossunder(fastEMA, slowEMA) or close >= (strategy.position_avg_price * (1 + profitPercentage / 100))

// Target condition: 50 points profit
//targetCondition = close >= (strategy.position_avg_price + 50)

// Execute orders
// strategy.entry("Buy", strategy.long, when=buyCondition)
// strategy.close("Buy", when=sellCondition )
if (buyCondition)
    strategy.entry("Buy", strategy.long)

if (sellCondition)
    strategy.close("Buy")

// // Execute sell orders
// strategy.entry("Sell", strategy.short, when=sellCondition)
// strategy.close("Sell", when=buyCondition)

// Plot buy and sell signals on the chart
plotshape(series=buyCondition, title="Buy Signal", color=color.green, style=shape.labelup, location=location.belowbar)
plotshape(series=sellCondition, title="Sell Signal", color=color.red, style=shape.labeldown, location=location.abovebar)
Published by ChaoZhang on the FMZ strategy square · last modified 2024-02-19. Collected in the Quant Trading Vault. Unvalidated research: re-test with your own data and costs before trusting it.
Build this with AgenKit
A spec is not a trading system. Paste this into your coding agent and AgenKit runs a specialist team — architecture, test-first build, risk gates, review — with paper trading on by default.
/agenkit build a production-grade trading bot with a backtest engine, risk controls and paper trading by default from strategies/EMA-Crossover-Trend-Following-Trading-Strategy.md- npx agenkit install engineering-kit in your project
- Paste the command into your agent and approve each phase
- Get tests, backtest, risk controls and a paper-trading switch
Understand it first
Before you run this, read the lesson behind the idea and how to backtest it honestly. Specs like this one are the survivors of an unknown number of trials; deflate their results accordingly.
Related specs
- 200 EMA VWAP MFI Trend Following StrategyPine Script · Trend following · 1d
- 4 EMA Trend StrategyPine Script · Trend following · 1d
- ADX MA and EMA Long Only Trend Tracking StrategyPine Script · Trend following · 1d
- ATR Dynamic Trend Following and EMA Crossover Trading StrategyPine Script · Trend following · 1d
- ATR and Moving Average Crossover Hybrid StrategyPine Script · Trend following · 1h
- ATR and T3 Moving Average StrategyPine Script · Trend following · 5m