Strategy vault / Trend following
EMA Dual Crossover Dynamic Stop Loss Quantitative Strategy
This strategy is designed based on the dual crossover principle of Exponential Moving Averages (EMA) combined with a dynamic stop-loss mechanism. It uses the golden/death cross of 10-day and 20-day EMAs as primary…
Overview
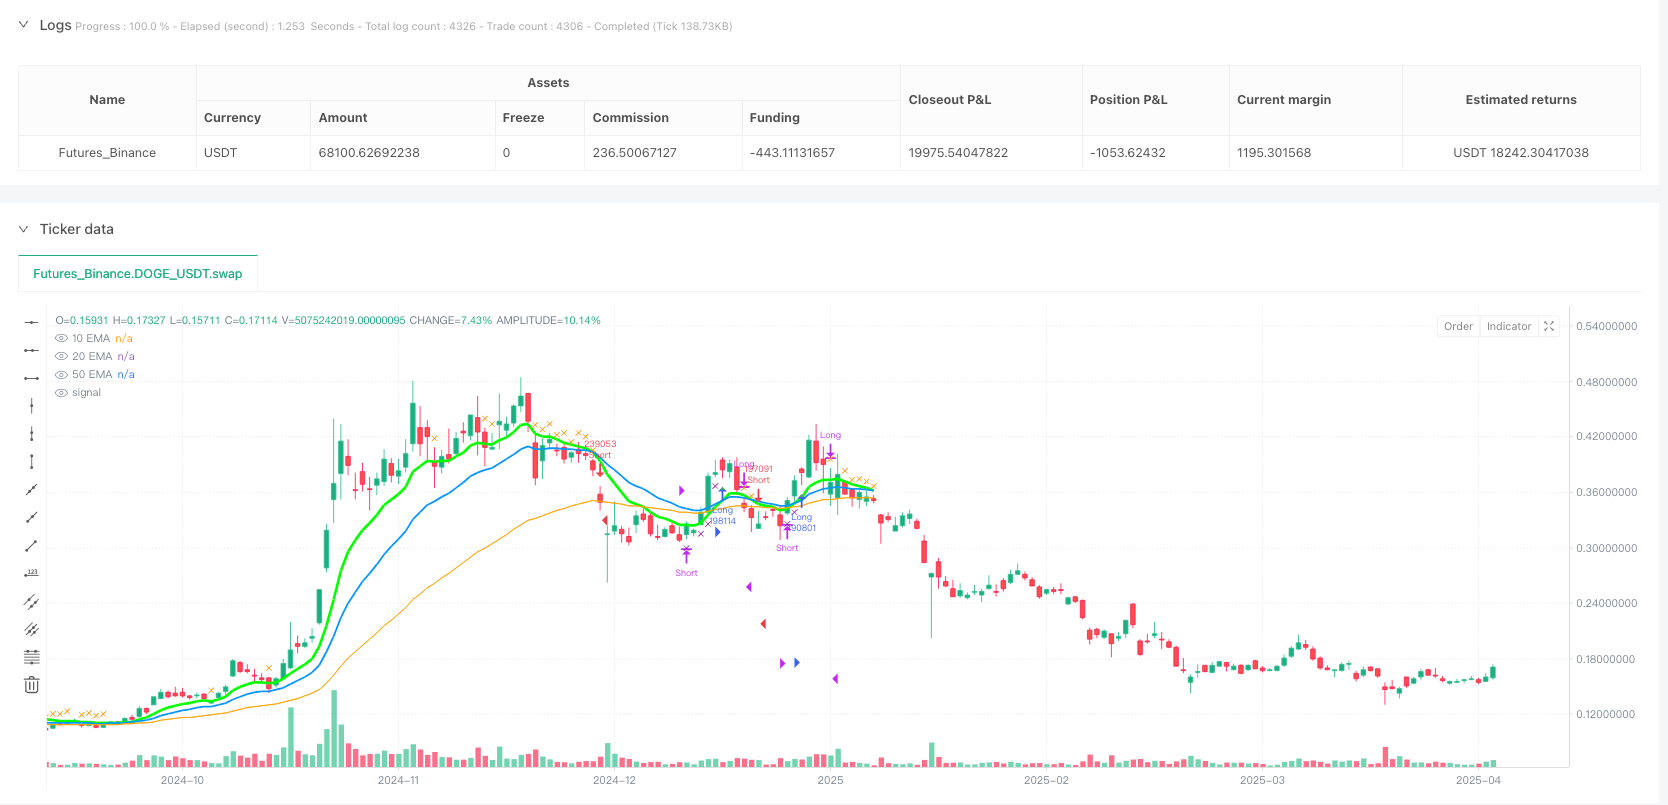
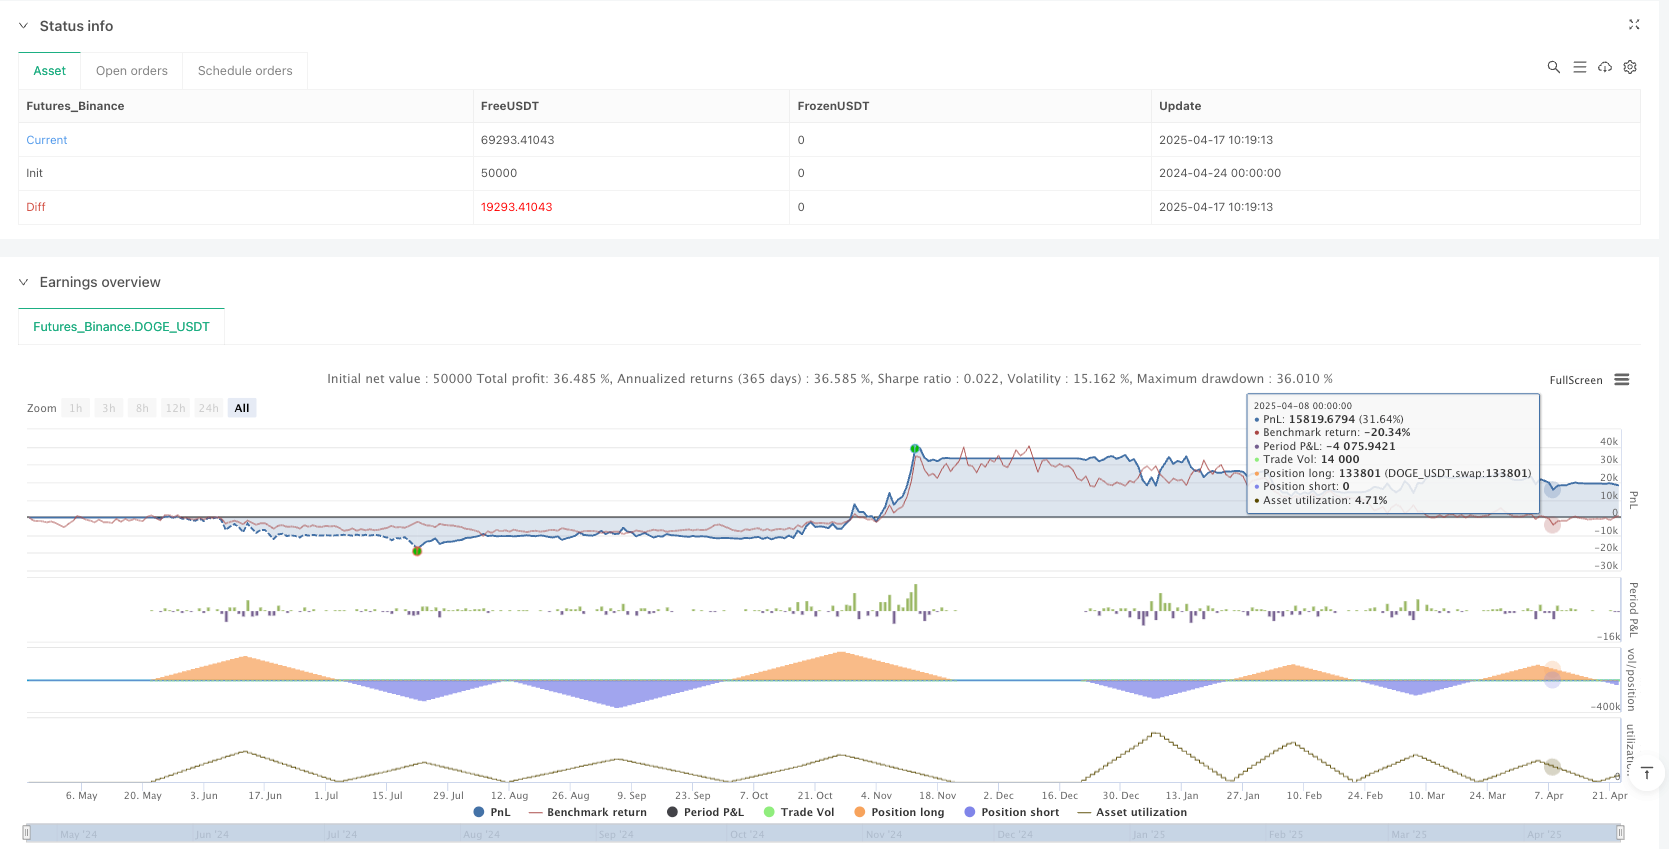
This strategy is designed based on the dual crossover principle of Exponential Moving Averages (EMA) combined with a dynamic stop-loss mechanism. It uses the golden/death cross of 10-day and 20-day EMAs as primary trading signals, with the 50-day EMA as a trend filter and the 10-day EMA as a dynamic stop-loss line. A buy signal is generated when the price is above the 50-day EMA and the 10-day EMA crosses above the 20-day EMA; a sell signal occurs when the price is below the 50-day EMA and the 10-day EMA crosses below the 20-day EMA. Positions are exited if the price reversely breaks the 10-day EMA.
Strategy Logic
- Bullish/Bearish Conditions:
- Bullish: When 10-day EMA crosses above 20-day EMA (golden cross) and closing price is above 50-day EMA.
- Bearish: When 10-day EMA crosses below 20-day EMA (death cross) and closing price is below 50-day EMA.
- Dynamic Stop-Loss:
- Long positions are closed if price falls below 10-day EMA.
- Short positions are closed if price rises above 10-day EMA.
- Trend Filtering: The 50-day EMA acts as a long-term trend filter to avoid overtrading in ranging markets.
Advantages
- Trend-Following Capability: Dual EMA crossover effectively captures medium-term trends, while the 50-day EMA reduces false signals.
- Dynamic Risk Management: The 10-day EMA serves as an adaptive stop-loss, protecting profits during trend movements.
- Visual Clarity: Distinct colors and line widths differentiate the three EMAs, with annotated signals for real-time monitoring.
- Parameter Flexibility: Adjustable EMA periods adapt to varying market volatilities.
Risks
- Lagging Risk: EMAs rely on historical data, potentially causing significant drawdowns during rapid reversals.
- Solution: Incorporate momentum indicators (e.g., RSI) to filter extreme volatility.
- Range Market Losses: Frequent whipsaws may occur in trendless conditions.
- Solution: Add volatility filters (e.g., ATR) to pause trading.
- Overfitting Risk: Fixed EMA periods may not suit all market regimes.
- Solution: Implement adaptive period algorithms or multi-timeframe confirmation.
Optimization Directions
- Composite Signals:
- Add volume confirmation (e.g., breakout with high volume) to enhance signal reliability.
- Dynamic Position Sizing:
- Adjust position size based on volatility (ATR values) to reduce exposure in high-risk periods.
- Machine Learning:
- Train models on historical data to dynamically optimize EMA period combinations.
- Multi-Timeframe Validation:
- Require weekly EMA alignment with daily signals to improve win rates.
Conclusion
This strategy balances trend-following and risk control through EMA dual crossover and dynamic stop-loss. Its core strengths lie in clear logic and intuitive visualization, making it suitable for medium-low frequency trading. Future enhancements could integrate multidimensional data (e.g., volatility, volume) for greater robustness.
Source Pine Script
/*backtest
start: 2024-04-24 00:00:00
end: 2025-04-23 00:00:00
period: 1d
basePeriod: 1d
exchanges: [{"eid":"Futures_Binance","currency":"DOGE_USDT"}]
*/

//@version=5
//@description Ovtlyer EMA Crossover  price over 50 Indicator
//@author YourName

strategy("EMA Crossover Strategy", overlay=true, default_qty_type=strategy.percent_of_equity, default_qty_value=100)

// Input EMA lengths
length10 = input.int(10, minval=1, title="10 EMA Length")
length20 = input.int(20, minval=1, title="20 EMA Length")
length50 = input.int(50, minval=1, title="50 EMA Length")

// Calculate EMAs
ema10 = ta.ema(close, length10)
ema20 = ta.ema(close, length20)
ema50 = ta.ema(close, length50)

// Bullish Condition: 10 EMA crosses above 20 EMA AND price is above 50 EMA
bullishCondition = ta.crossover(ema10, ema20) and close > ema50

// Bearish Condition: 10 EMA crosses below 20 EMA AND price is below 50 EMA
bearishCondition = ta.crossunder(ema10, ema20) and close < ema50

// Track the current market state
var isBullish = false
var isBearish = false

if (bullishCondition)
    isBullish := true
    isBearish := false

if (bearishCondition)
    isBearish := true
    isBullish := false

// Exit conditions
bullishExit = isBullish and close < ema10
bearishExit = isBearish and close > ema10

// Plot EMAs
plot(ema10, title="10 EMA", color=color.rgb(0, 255, 0), linewidth=3) // Thick green line for 10 EMA
plot(ema20, title="20 EMA", color=color.rgb(0, 150, 255), linewidth=2) // Medium blue line for 20 EMA
plot(ema50, title="50 EMA", color=color.rgb(255, 165, 0), linewidth=1) // Thin orange line for 50 EMA

// Strategy Entry and Exit
if (bullishCondition)
    strategy.entry("Long", strategy.long)

if (bearishCondition)
    strategy.entry("Short", strategy.short)

if (bullishExit)
    strategy.close("Long")

if (bearishExit)
    strategy.close("Short")

// Plot Entry Signals (for visualization)
plotshape(bullishCondition, title="Bullish Signal",
          location=location.belowbar, style=shape.triangleup,
          size=size.small, color=color.green)
plotshape(bearishCondition, title="Bearish Signal",
          location=location.abovebar, style=shape.triangledown,
          size=size.small, color=color.red)

// Plot Exit Signals (for visualization)
plotshape(bullishExit, title="Bullish Exit",
          location=location.abovebar, style=shape.xcross,
          size=size.small, color=color.orange)
plotshape(bearishExit, title="Bearish Exit",
          location=location.belowbar, style=shape.xcross,
size=size.small, color=color.purple)Published by ianzeng123 on the FMZ strategy square · last modified 2025-04-24. Collected in the Quant Trading Vault. Unvalidated research: re-test with your own data and costs before trusting it.
Build this with AgenKit
A spec is not a trading system. Paste this into your coding agent and AgenKit runs a specialist team — architecture, test-first build, risk gates, review — with paper trading on by default.
/agenkit build a production-grade trading bot with a backtest engine, risk controls and paper trading by default from strategies/EMA-Dual-Crossover-Dynamic-Stop-Loss-Quantitative-Strategy.md- npx agenkit install engineering-kit in your project
- Paste the command into your agent and approve each phase
- Get tests, backtest, risk controls and a paper-trading switch
Understand it first
Before you run this, read the lesson behind the idea and how to backtest it honestly. Specs like this one are the survivors of an unknown number of trials; deflate their results accordingly.
Related specs
- Fixed Range Volume Profile And Anchored VWAP Trend Identification Strategy With Dynamic Stop LossPine Script · Trend following · 1h
- Dynamic ATR Trailing Stop with EMA Cross Combination StrategyPine Script · Trend following · 2h
- Five Minute Triple Confirmation Trend Trading Strategy with Risk Management SystemPine Script · Trend following · 1m
- Moving Average Crossover Strategy 430371Pine Script · Trend following · 1h
- Multi Moving Average Trend Following with On Balance Volume StrategyPine Script · Trend following · 5d
- Adaptive Trend Following Strategy Combining Dual Moving Average Crossover and RSIPine Script · Trend following · 2d