Strategy vault / Mean reversion
EMA MACD Trend Reversal Quantitative Trading Strategy
This strategy is a trend reversal trading system based on moving averages and MACD indicators. It combines Fast Exponential Moving Average (EMA), Simple Moving Average (SMA), and MACD indicator to capture profit…
Overview
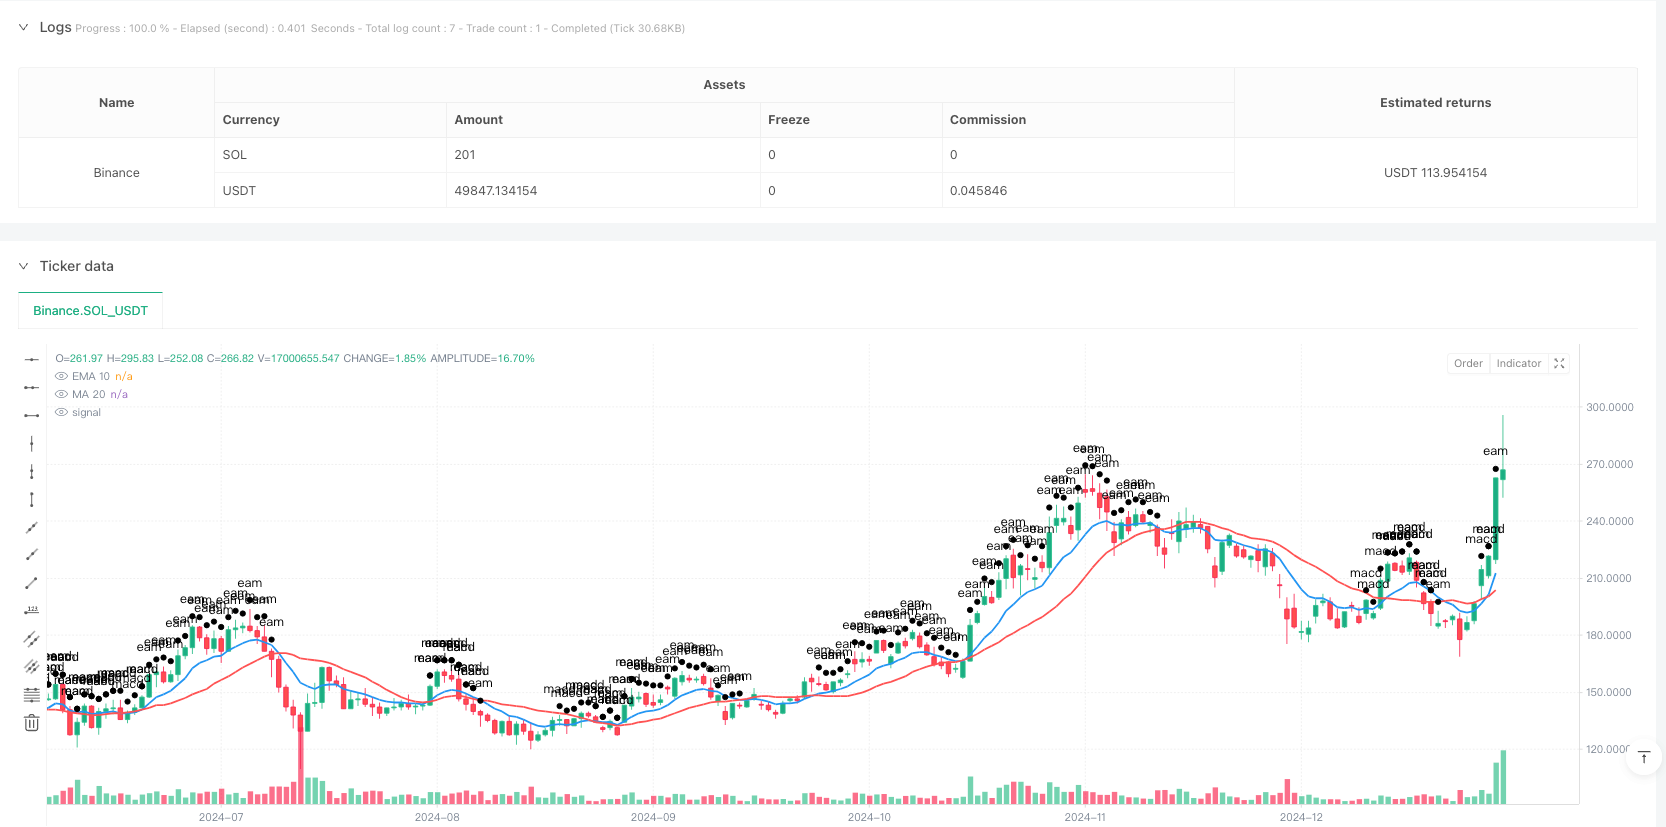
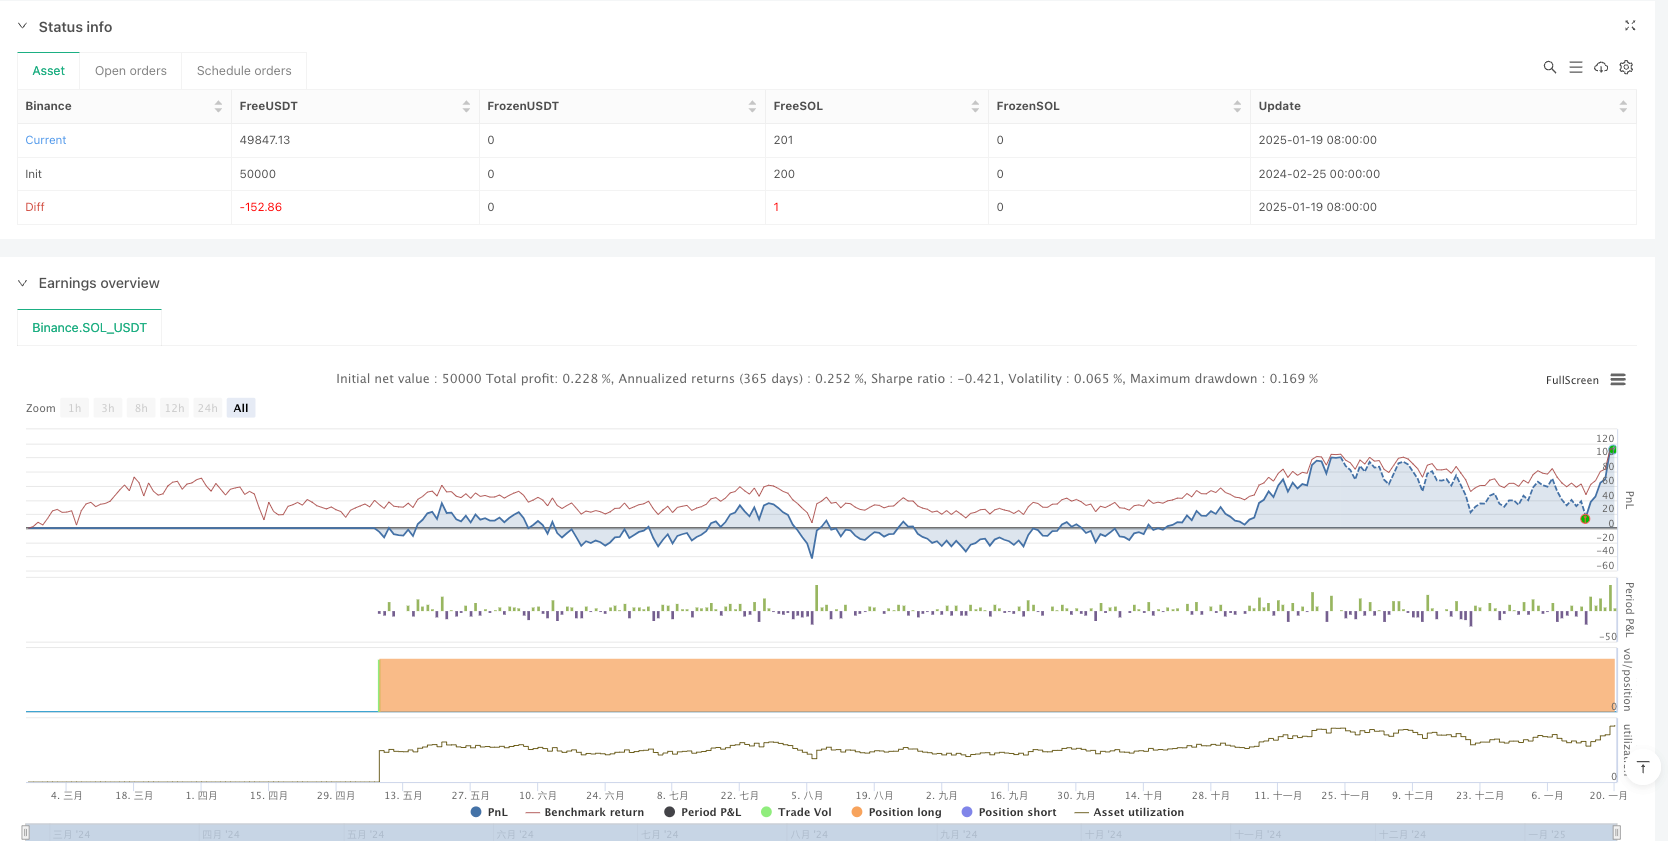
This strategy is a trend reversal trading system based on moving averages and MACD indicators. It combines Fast Exponential Moving Average (EMA), Simple Moving Average (SMA), and MACD indicator to capture profit opportunities during market trend changes. The strategy focuses on price breakouts above moving averages and MACD bottom reversal signals below the zero line to position trades before potential market reversals.
Strategy Principle
The strategy uses EMA(10) and MA(20) as trend judgment benchmarks, combined with MACD indicator (12,26,9) for signal confirmation. Specifically, entry signals require the following conditions to be met simultaneously:
- EMA(10) crosses above MA(20), indicating short-term momentum is becoming stronger than medium-term trend
- Both MACD and signal lines are below the zero line, but MACD line is above the signal line, showing potential bottom reversal signals The exit condition is triggered when the MACD delta crosses below 0 while both MACD and signal lines are above the zero line, suggesting the uptrend may have ended.
Strategy Advantages
- Multiple technical indicators cross-validation improves signal reliability
- Combines trend and momentum indicators for both trend capture and precise entry timing
- Uses both EMA and SMA to balance market sensitivity and false signal filtering
- Clear exit conditions help secure profits and avoid being trapped
Strategy Risks
- May generate frequent false breakout signals in ranging markets
- Moving average system has inherent lag, potentially missing optimal entry points
- MACD indicator may generate lagging signals in volatile markets
- Lacks explicit stop-loss mechanism, potentially leading to significant losses in volatile markets
Strategy Optimization Directions
- Introduce volatility indicators (like ATR) for dynamic position sizing and stop-loss placement
- Add trend strength filters to avoid trading in weak trends
- Optimize moving average parameters based on different market characteristics
- Add volume indicator verification to improve signal reliability
- Build a more comprehensive money management system, including staged position building and dynamic position adjustment
Summary
This strategy constructs a relatively complete trend reversal trading system through the combination of moving average system and MACD indicator. Although it has certain inherent lag and false signal risks, it still holds practical value through reasonable parameter optimization and risk control measures. When implementing in live trading, it's recommended to adjust strategy parameters based on market conditions and personal risk preference.
Source Pine Script
/*backtest
start: 2024-02-25 00:00:00
end: 2025-01-20 00:00:00
period: 1d
basePeriod: 1d
exchanges: [{"eid":"Binance","currency":"SOL_USDT"}]
*/

//@version=5
strategy("MACD Strategy", overlay=true)

//Macd Parameters
fastLength = input(12, title="Fast Line Length")
slowLength = input(26, title="Slow Line Length")
MACDLength = input(9, title="MACD signal line length")

// Calculation MACD
MACD = ta.ema(close, fastLength) - ta.ema(close, slowLength)
aMACD = ta.ema(MACD, MACDLength)
delta = MACD - aMACD


// Calculation EMA(10) and MA(20)
ema10 = ta.ema(close, 10)
ma20 = ta.sma(close, 20)
// Plot on chart EMA(10) and MA(20),Used for debugging
plot(ema10, title="EMA 10", color=color.blue, linewidth=2)
plot(ma20, title="MA 20", color=color.red, linewidth=2)

// Check conditions in real time
// Check EMA(10) Is it higher than MA(20)
bool emaAboveMa = ema10 > ma20

// Check MACD Whether it is above the signal line, and MACD Both and signal line are at 0 Below the Axis
bool macdCondition = (MACD > aMACD) and (MACD < 0) and (aMACD < 0)

// Add debug information - Draw the chart when the condition is met
plotshape(emaAboveMa, title="EMA Above MA Condition",  size=size.small, text="eam")
plotshape(macdCondition, title="MACD Condition", size=size.small, text="macd")

// When both conditions are met, trigger buy operation
if (emaAboveMa and macdCondition)
    strategy.entry("long", strategy.long, comment="Buy Signal")
    // Display label for buy signal
    label.new(bar_index, high, "buy", textcolor=color.white, style=label.style_label_up, size=size.normal)

// Close position condition
if (ta.crossunder(delta, 0) and MACD > 0 and aMACD > 0)
    strategy.close("MacdLE", comment="Close Long")
//if (ta.crossunder(delta, 0))
//	strategy.entry("MacdSE", strategy.short, comment="MacdSE")
//plot(strategy.equity, title="equity", color=color.red, linewidth=2, style=plot.style_areabr)
Published by ianzeng123 on the FMZ strategy square · last modified 2025-02-27. Collected in the Quant Trading Vault. Unvalidated research: re-test with your own data and costs before trusting it.
Build this with AgenKit
A spec is not a trading system. Paste this into your coding agent and AgenKit runs a specialist team — architecture, test-first build, risk gates, review — with paper trading on by default.
/agenkit build a production-grade trading bot with a backtest engine, risk controls and paper trading by default from strategies/EMA-MACD-Trend-Reversal-Quantitative-Trading-Strategy.md- npx agenkit install engineering-kit in your project
- Paste the command into your agent and approve each phase
- Get tests, backtest, risk controls and a paper-trading switch
Understand it first
Before you run this, read the lesson behind the idea and how to backtest it honestly. Specs like this one are the survivors of an unknown number of trials; deflate their results accordingly.
Related specs
- Customizable Non Repainting HTF MACD MFI Scalable Bot StrategyPine Script · Mean reversion · 1d
- Dynamic Adaptive Multi Timeframe Trend Following and Range Reversal Hybrid StrategyPine Script · Mean reversion · 2d
- MACD Cross Period Trading StrategyPine Script · Mean reversion · 1d
- Multi Indicator Fusion Mean Reversion Trend Following StrategyPine Script · Mean reversion · 3h
- CCTBBO Reversal Tracking StrategyPine Script · Mean reversion · 45m
- Multi Indicator Weighted Smart Trading StrategyPine Script · Mean reversion · 2d