Strategy vault / Trend following
EMA Tracking Strategy
The EMA tracking strategy is a trend strategy that uses the EMA indicator to track trends. It calculates the EMA value of prices and combines it with a percentage band to determine price trends and generate trading…
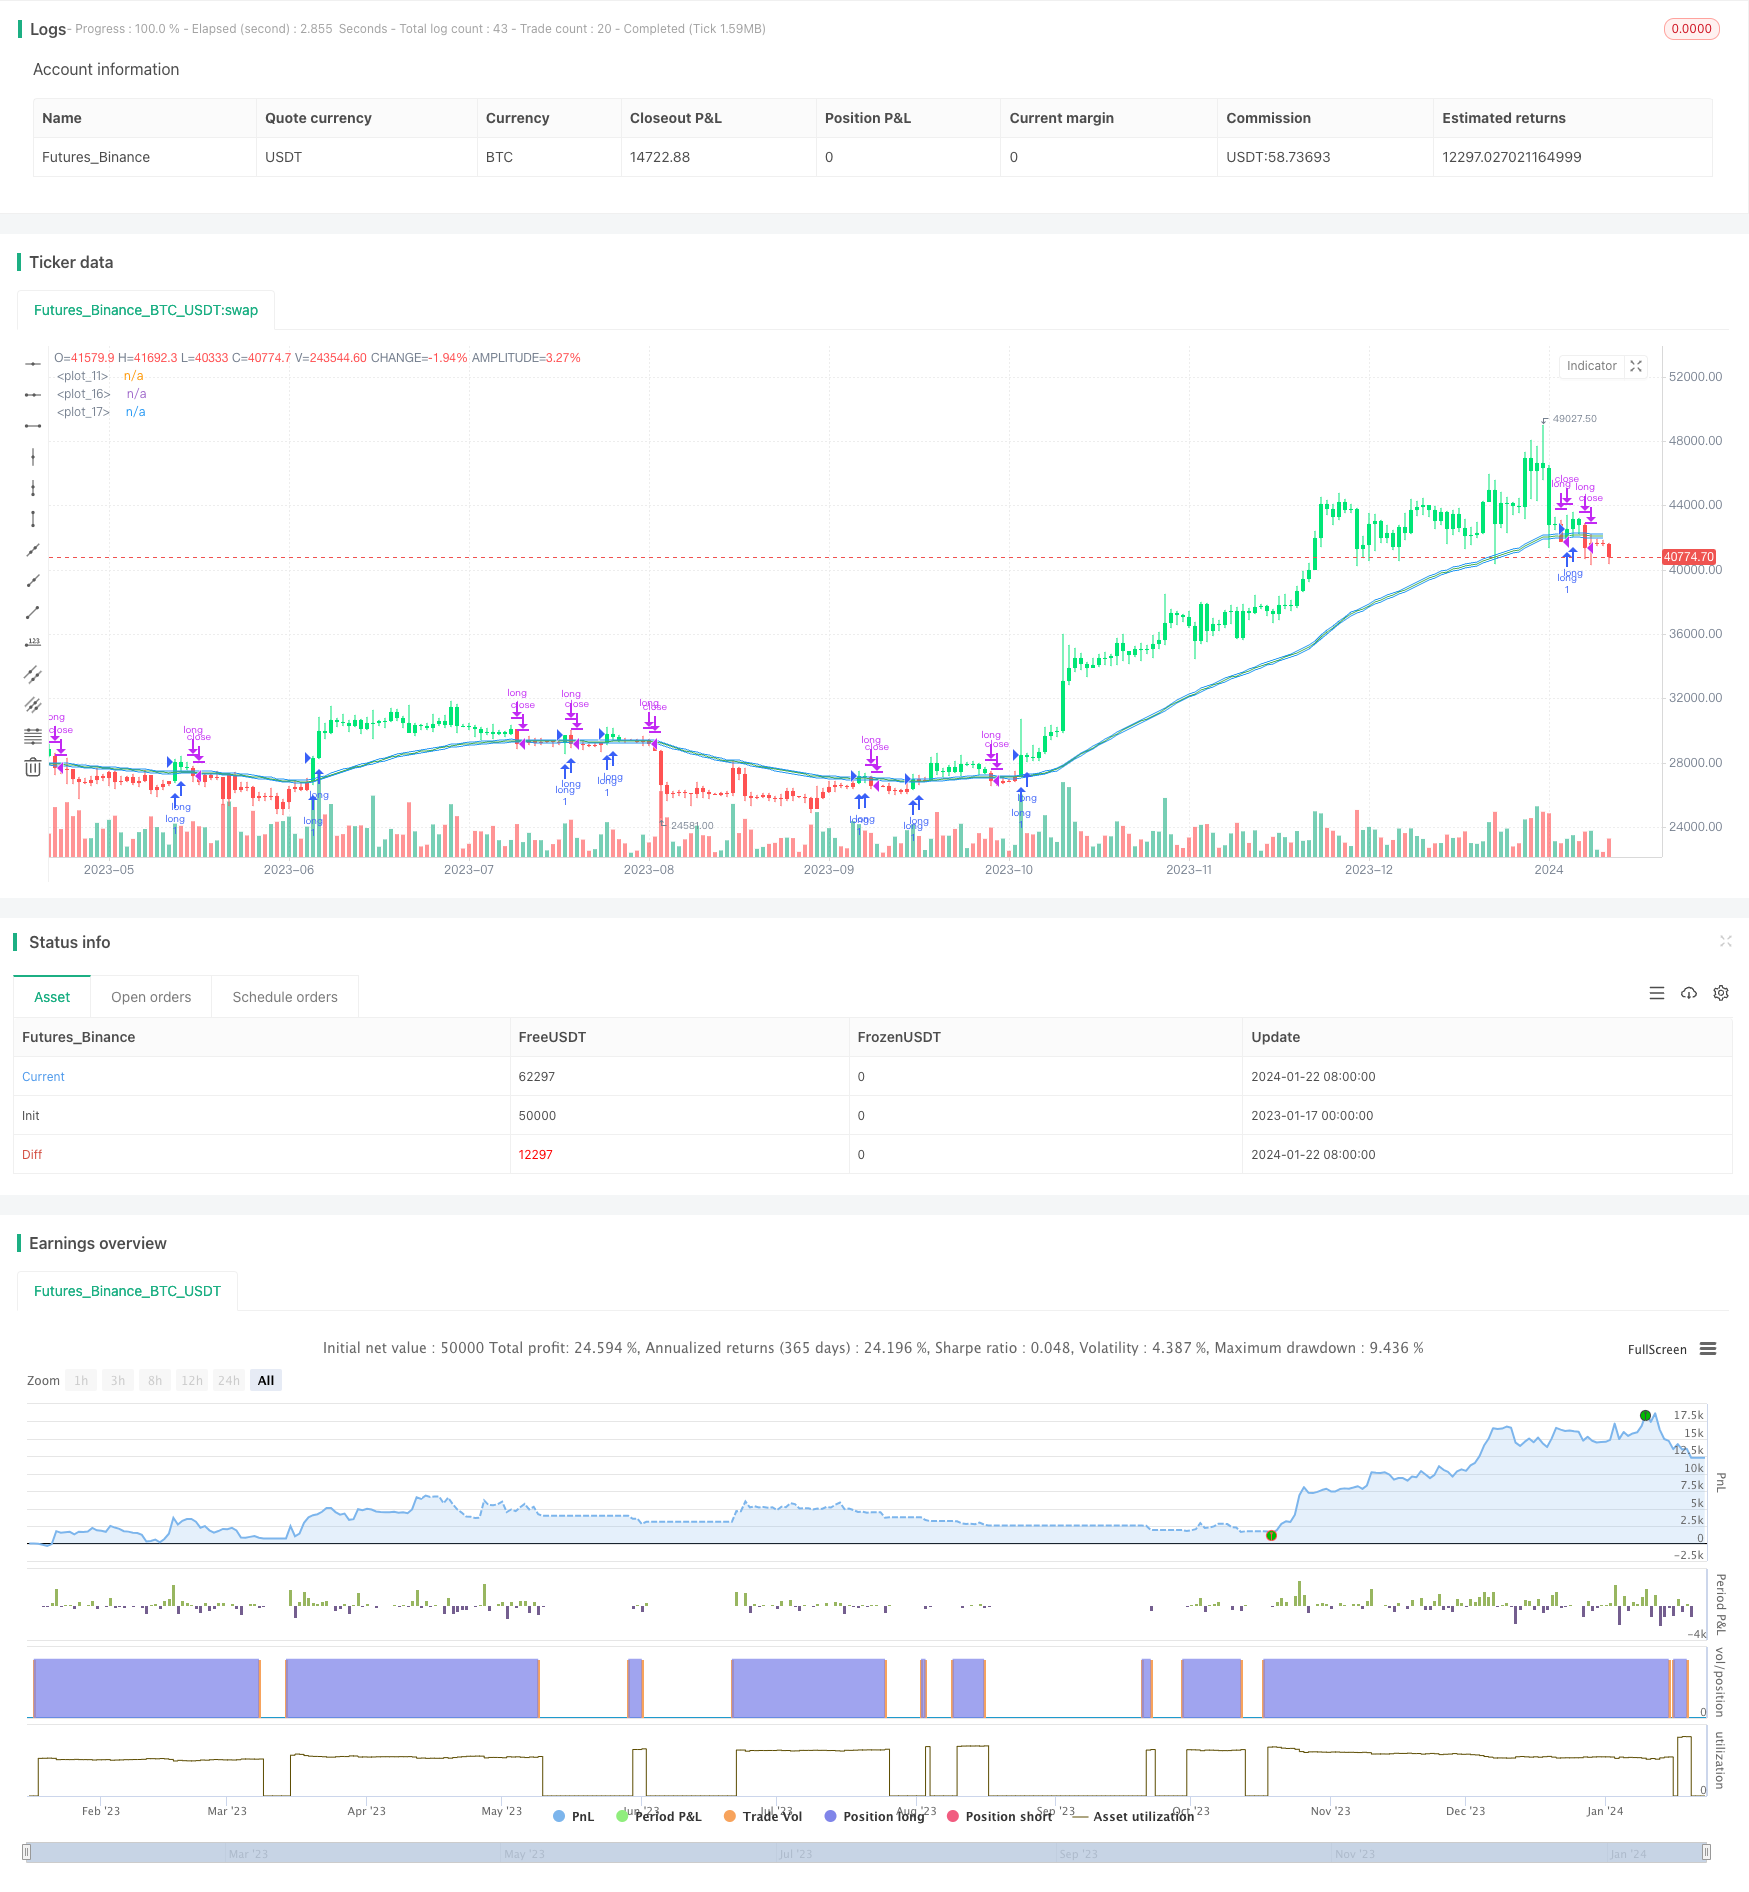
Overview
The EMA tracking strategy is a trend strategy that uses the EMA indicator to track trends. It calculates the EMA value of prices and combines it with a percentage band to determine price trends and generate trading signals.
Strategy Logic
The core indicator of this strategy is EMA. EMA stands for Exponential Moving Average, which is a trend tracking indicator. EMA calculates the current average price based on historical prices and the set time period. EMA also has the effect of smoothing prices.
The strategy first calculates the 50-period EMA value of prices as the main judgment indicator. Then based on a certain percentage of the EMA value, the upper and lower rails are set. Here it is set to ±0.3% of the EMA value. When the price breaks through the upper rail of the EMA, a buy signal is generated. When the price falls below the lower rail of the EMA, a sell signal is generated. This can track the trend changes within the EMA cycle.
Advantage Analysis
- Using EMA indicator to determine trends can avoid interference from price fluctuations
- EMA smooths prices and turns random volatility into clear trends for easy judgment
- Setting upper and lower rails of EMA forms a range band to reduce false signals
- The strategy logic is clear and easy to understand, and the parameters are relatively simple to adjust
Risk Analysis
- EMA indicator has lagging effect, signals are late at trend turning points
- Fixed percentage rails are prone to generating false signals during consolidation
- Backtest data overfitting risks, real price fluctuations may be greater
- No stop loss setting to control losses
Optimization Directions
- Add parameter optimization to find the optimal parameter combination
- Add stop loss mechanism to control maximum drawdown of the strategy
- Optimize the calculation method of upper and lower rails to reduce false signal rate
- Increase conditional filtering to avoid wrong entries during volatile markets
- Combine with other indicators for confirmation to improve strategy stability
Summary
The EMA tracking strategy has clear overall logic, judging price trends through EMA indicators and generating trading signals with range bands. The advantages are simple rules that are easy to understand and can avoid some noise. But there are also problems like limited tuning space, lagging signals, poor drawdown control, etc. Next steps could be improving it via means like combining multiple indicators, stop loss optimization, etc. to make the strategy more practical and stable.
Parameters
| Name | Default | What it controls |
|---|---|---|
| v_input_1_close | 0 | Data Array: close | high | low | open | hl2 | hlc3 | hlcc4 | ohlc4 |
| v_input_2 | 50 | EMA period |
| v_input_3 | 0.003 | Band % |
Source Pine Script
/*backtest
start: 2023-01-17 00:00:00
end: 2024-01-23 00:00:00
period: 1d
basePeriod: 1h
exchanges: [{"eid":"Futures_Binance","currency":"BTC_USDT"}]
*/

//@version=3
strategy(title="PingEMA50V.3 Piw", shorttitle="EMA50 Piw", overlay=true)

// input
src = input(title="Data Array",defval=close)
ema_period = input(title="EMA period", defval=50)
percent = input(title="Band %", type=float,defval=0.003)

// ema
ema50 = ema(src, ema_period)
plot(ema50, color=green)

// upper lower
upper = ema50 + (ema50*percent)
lower = ema50 - (ema50*percent)
plot(upper, color=blue)
plot(lower, color=blue)

// signal
buy = src > upper
sell = src < lower

// bar color
bcolor = buy ? lime : red
barcolor(color=bcolor)

// trade
if (buy)
    strategy.entry("long", strategy.long)
if (sell)
    strategy.close("long")
Published by ChaoZhang on the FMZ strategy square · last modified 2024-01-24. Collected in the Quant Trading Vault. Unvalidated research: re-test with your own data and costs before trusting it.
Build this with AgenKit
A spec is not a trading system. Paste this into your coding agent and AgenKit runs a specialist team — architecture, test-first build, risk gates, review — with paper trading on by default.
/agenkit build a production-grade trading bot with a backtest engine, risk controls and paper trading by default from strategies/EMA-Tracking-Strategy.md- npx agenkit install engineering-kit in your project
- Paste the command into your agent and approve each phase
- Get tests, backtest, risk controls and a paper-trading switch
Understand it first
Before you run this, read the lesson behind the idea and how to backtest it honestly. Specs like this one are the survivors of an unknown number of trials; deflate their results accordingly.
Related specs
- 200 EMA VWAP MFI Trend Following StrategyPine Script · Trend following · 1d
- 4 EMA Trend StrategyPine Script · Trend following · 1d
- ADX MA and EMA Long Only Trend Tracking StrategyPine Script · Trend following · 1d
- ATR Dynamic Trend Following and EMA Crossover Trading StrategyPine Script · Trend following · 1d
- ATR and Moving Average Crossover Hybrid StrategyPine Script · Trend following · 1h
- ATR and T3 Moving Average StrategyPine Script · Trend following · 5m