Empirical Mode Decomposition Based Quantitative Trading Strategy
This strategy is based on the Empirical Mode Decomposition (EMD) method to decompose the price series and extract features from different frequency bands, combined with the mean to generate trading signals. It is…
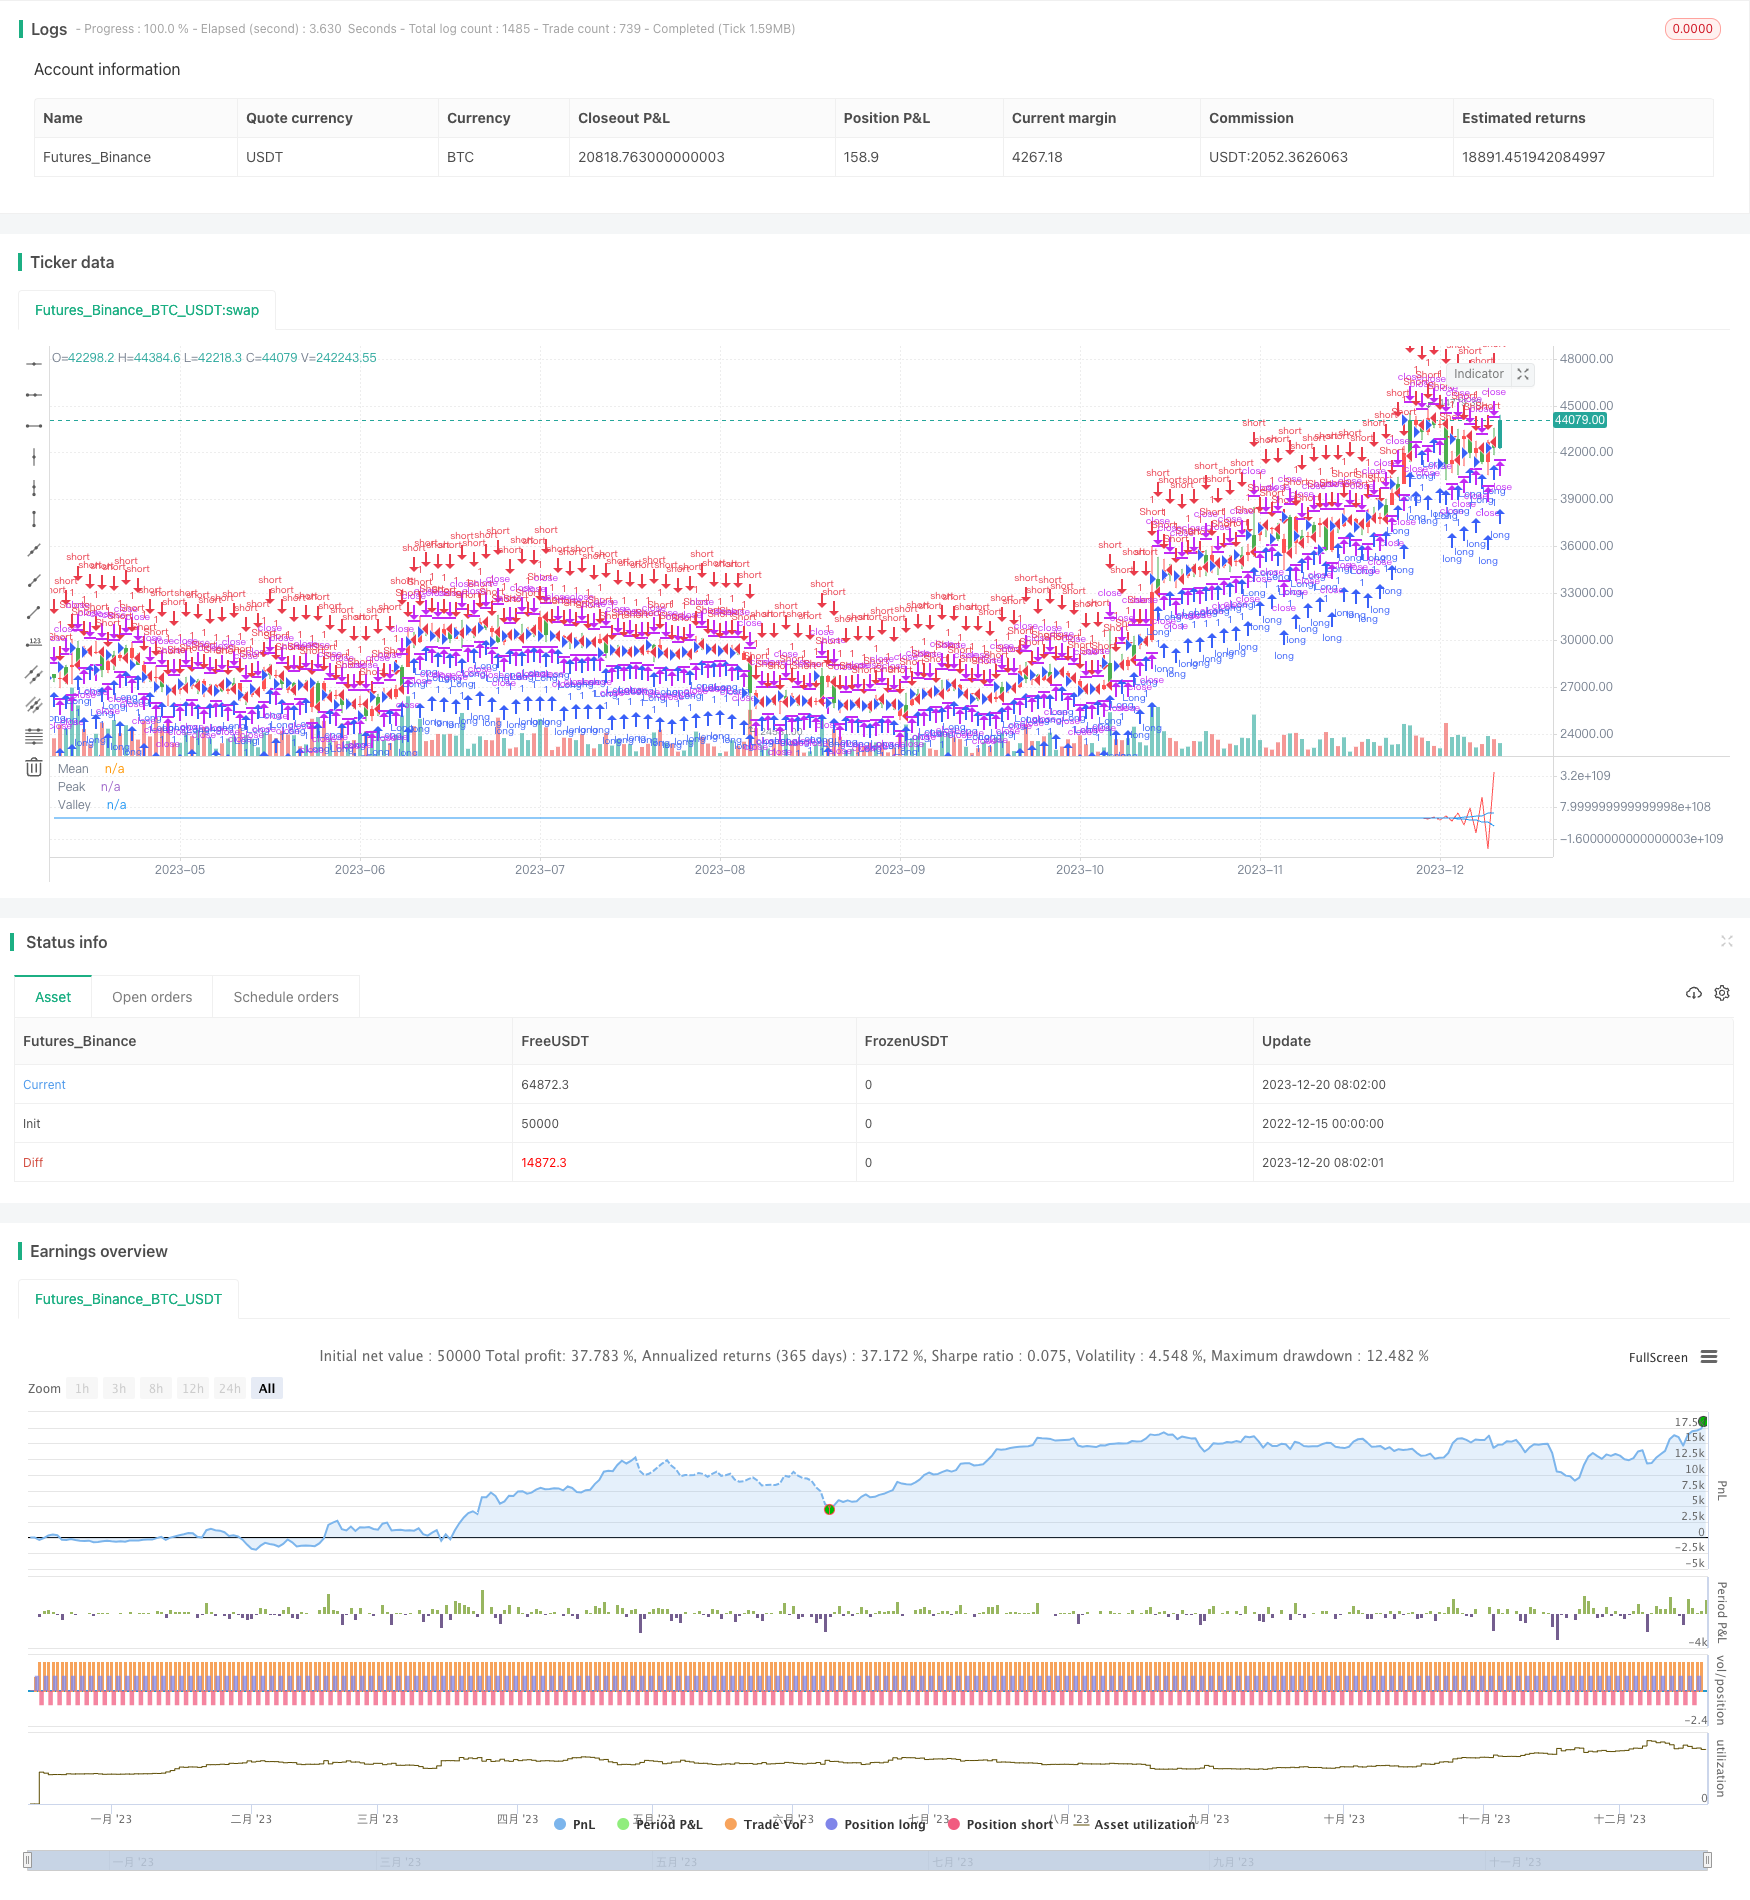
Overview
This strategy is based on the Empirical Mode Decomposition (EMD) method to decompose the price series and extract features from different frequency bands, combined with the mean to generate trading signals. It is mainly applicable for medium and long term holdings.
Strategy Logic
- Use the EMD method to bandpass filter the price and extract price fluctuations
- Calculate the moving average of peak and trough sequences
- Generate trading signals when the mean line exceeds a certain percentage of peak and trough lines
- Long or short based on trading signals
Advantage Analysis
- The EMD method can effectively decompose the price series and extract useful features
- The peak and trough lines control the strategy to trade only when the price fluctuation is greater than a certain amplitude
- Combined with the mean line, it can effectively filter out false breakouts
Risk Analysis
- Improper selection of EMD method parameters may lead to overfitting
- It takes a long cycle to form a transaction signal and cannot adapt to high frequency trading
- Unable to cope with market conditions with dramatic price fluctuations
Optimization Directions
- Optimize the parameters of the EMD model to improve adaptability to the market
- Combine other indicators as stop loss and take profit signals
- Try different price series as strategy input
Summary
This strategy uses the empirical mode decomposition method to extract features from the price series and generates trading signals based on the extracted features, realizing a stable medium and long term trading strategy. The advantage of this strategy is that it can effectively identify periodic features in prices and issue trading orders during large fluctuations. But there are also certain risks, and further optimization is needed to adapt to more complex market environments.
Parameters
| Name | Default | What it controls |
|---|---|---|
| v_input_1 | 20 | Length |
| v_input_2 | 0.5 | Delta |
| v_input_3 | 0.1 | Fraction |
| v_input_4 | false | Trade reverse |
Source Pine Script
/*backtest
start: 2022-12-15 00:00:00
end: 2023-12-21 00:00:00
period: 1d
basePeriod: 1h
exchanges: [{"eid":"Futures_Binance","currency":"BTC_USDT"}]
*/

//@version=2
////////////////////////////////////////////////////////////
//  Copyright by HPotter v1.0 12/04/2017
// The related article is copyrighted material from Stocks & Commodities Mar 2010
// You can use in the xPrice any series: Open, High, Low, Close, HL2, HLC3, OHLC4 and ect...
//
// You can change long to short in the Input Settings
// Please, use it only for learning or paper trading. Do not for real trading.
////////////////////////////////////////////////////////////
strategy(title="Empirical Mode Decomposition")
Length = input(20, minval=1)
Delta = input(0.5)
Fraction = input(0.1)
reverse = input(false, title="Trade reverse")
xPrice = hl2
beta = cos(3.1415 * (360 / Length) / 180)
gamma = 1 / cos(3.1415 * (720 * Delta / Length) / 180)
alpha = gamma - sqrt(gamma * gamma - 1)
xBandpassFilter = 0.5 * (1 - alpha) * (xPrice - xPrice[2]) + beta * (1 + alpha) * nz(xBandpassFilter[1]) - alpha * nz(xBandpassFilter[2])
xMean = sma(xBandpassFilter, 2 * Length)
xPeak =  iff (xBandpassFilter[1] > xBandpassFilter and xBandpassFilter[1] > xBandpassFilter[2], xBandpassFilter[1], nz(xPeak[1]))
xValley =  iff (xBandpassFilter[1] < xBandpassFilter and xBandpassFilter[1] < xBandpassFilter[2], xBandpassFilter[1], nz(xValley[1]))
xAvrPeak = sma(xPeak, 50)
xAvrValley = sma(xValley, 50)
nAvrPeak = Fraction * xAvrPeak
nAvrValley = Fraction * xAvrValley
pos = iff(xMean > nAvrPeak and xMean > nAvrValley, 1,
	     iff(xMean < nAvrPeak and xMean < nAvrValley, -1, nz(pos[1], 0)))
possig = iff(reverse and pos == 1, -1,
          iff(reverse and pos == -1, 1, pos))
if (possig == 1)
    strategy.entry("Long", strategy.long)
if (possig == -1)
    strategy.entry("Short", strategy.short)
barcolor(possig == -1 ? red: possig == 1 ? green : blue )
plot(xMean, color=red, title="Mean")
plot(nAvrPeak, color=blue, title="Peak")
plot(nAvrValley, color=blue, title="Valley")
Published by ChaoZhang on the FMZ strategy square · last modified 2023-12-22. Collected in the Quant Trading Vault. Unvalidated research: re-test with your own data and costs before trusting it.
Build this with AgenKit
A spec is not a trading system. Paste this into your coding agent and AgenKit runs a specialist team — architecture, test-first build, risk gates, review — with paper trading on by default.
/agenkit build a production-grade trading bot with a backtest engine, risk controls and paper trading by default from strategies/Empirical-Mode-Decomposition-Based-Quantitative-Trading-Strategy.md- npx agenkit install engineering-kit in your project
- Paste the command into your agent and approve each phase
- Get tests, backtest, risk controls and a paper-trading switch
Understand it first
Before you run this, read the lesson behind the idea and how to backtest it honestly. Specs like this one are the survivors of an unknown number of trials; deflate their results accordingly.
Related specs
- 5 Day Moving Average Channel Breakout Strategy Combined With Mileage ConceptPine Script · Breakout · 1d
- Adaptive Bollinger Breakout with Moving Average Quantitative Strategy SystemPine Script · Breakout · 1h
- Adaptive Multi Period Trading Strategy Based on Wave Trend Momentum BreakoutPine Script · Breakout · 2h
- Adaptive Trading Strategy Based on ADX IndicatorPine Script · Breakout · 1d
- Average Line Breakthrough StrategyPine Script · Breakout · 1d
- BB Breakout StrategyPine Script · Breakout · 1d