Strategy vault / Mean reversion
Enhanced Mean Reversion Strategy with Bollinger Bands and RSI Integration
This strategy is a mean reversion trading system that combines Bollinger Bands and Relative Strength Index (RSI). It identifies extreme price deviations from the mean and uses RSI overbought/oversold signals to…
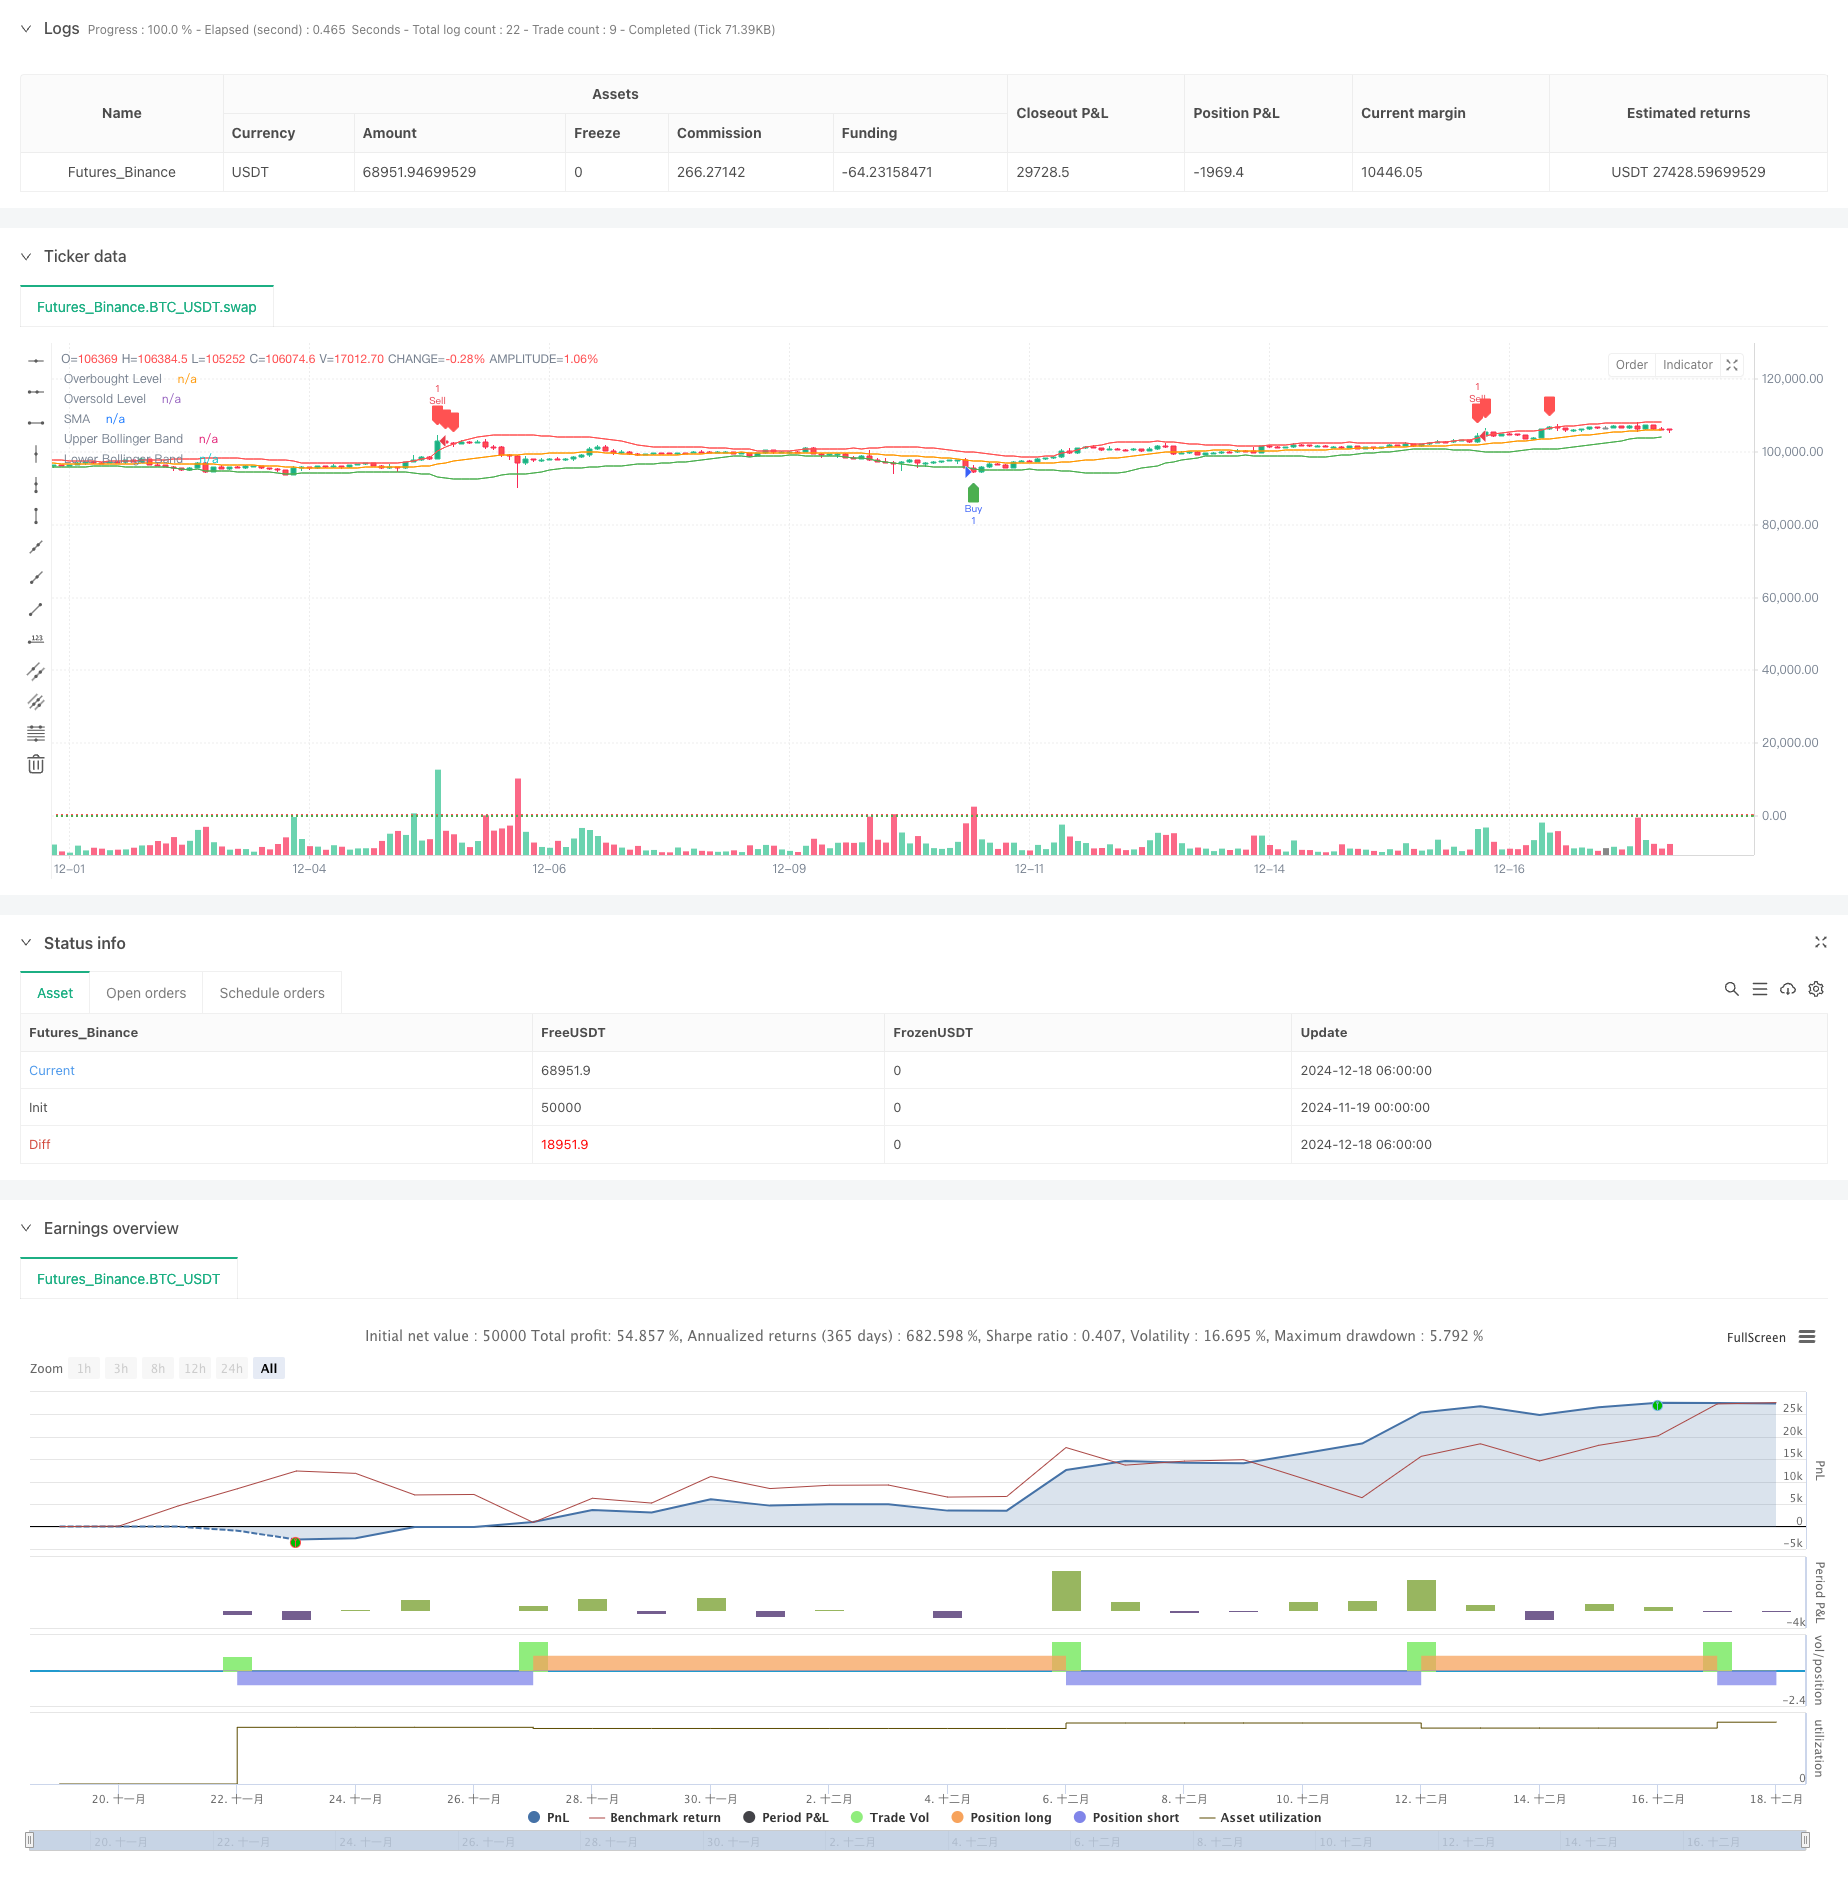
Overview
This strategy is a mean reversion trading system that combines Bollinger Bands and Relative Strength Index (RSI). It identifies extreme price deviations from the mean and uses RSI overbought/oversold signals to determine trading opportunities. Buy signals are generated when price breaks below the lower Bollinger Band and RSI is in oversold territory, while sell signals occur when price breaks above the upper Bollinger Band and RSI is in overbought territory.
Strategy Principle
The core logic is based on the mean reversion characteristic of financial markets. The implementation uses a 20-day Simple Moving Average (SMA) as the mean reference, with a standard deviation multiplier of 2.0 for Bollinger Band width calculation. A 14-day RSI is integrated as a supplementary indicator, with 70 and 30 set as overbought and oversold thresholds respectively. Trades are only triggered when price breaks the Bollinger Bands and RSI reaches extreme values, creating a dual confirmation mechanism that enhances strategy reliability.
Strategy Advantages
- Combines multiple technical indicators for more reliable trading signals
- Effectively filters false breakouts using RSI confirmation
- Highly adjustable parameters to adapt to different market conditions
- Clear strategy logic that is easy to understand and implement
- Comprehensive risk control mechanism
- Clean and efficient code implementation for easy maintenance and optimization
Strategy Risks
- May exit positions prematurely in trending markets, affecting returns
- Improper parameter selection can lead to delayed signals
- Potential for significant drawdowns during extreme market volatility
- Need to consider the impact of trading costs on strategy returns
- Strategy performance varies significantly across different market conditions
Optimization Directions
- Implement adaptive Bollinger Band width based on market volatility
- Add trend filters to reduce trading frequency in strong trend markets
- Optimize RSI parameters with adaptive periods
- Incorporate stop-loss and take-profit mechanisms to improve risk-reward ratio
- Consider adding volume indicators to enhance signal reliability
- Develop parameter optimization module for strategy auto-tuning
Summary
This strategy constructs a robust mean reversion trading system through the synergy of Bollinger Bands and RSI. The strategy design is reasonable with good scalability and adaptability. Through continuous optimization and improvement, the strategy's stability and profitability can be further enhanced. It is recommended to conduct thorough backtesting before live trading and adjust parameters according to specific market characteristics.
Source Pine Script
/*backtest
start: 2024-11-19 00:00:00
end: 2024-12-18 08:00:00
period: 2h
basePeriod: 2h
exchanges: [{"eid":"Futures_Binance","currency":"BTC_USDT"}]
*/

//@version=5
strategy("Mean Reversion Strategy", overlay=true)

// User Inputs
length = input.int(20, title="SMA Length")  // Moving Average length
stdDev = input.float(2.0, title="Standard Deviation Multiplier")  // Bollinger Band deviation
rsiLength = input.int(14, title="RSI Length")  // RSI calculation length
rsiOverbought = input.int(70, title="RSI Overbought Level")  // RSI overbought threshold
rsiOversold = input.int(30, title="RSI Oversold Level")  // RSI oversold threshold

// Bollinger Bands
sma = ta.sma(close, length)  // Calculate the SMA
stdDevValue = ta.stdev(close, length)  // Calculate Standard Deviation
upperBand = sma + stdDev * stdDevValue  // Upper Bollinger Band
lowerBand = sma - stdDev * stdDevValue  // Lower Bollinger Band

// RSI
rsi = ta.rsi(close, rsiLength)  // Calculate RSI

// Plot Bollinger Bands
plot(sma, color=color.orange, title="SMA")  // Plot SMA
plot(upperBand, color=color.red, title="Upper Bollinger Band")  // Plot Upper Band
plot(lowerBand, color=color.green, title="Lower Bollinger Band")  // Plot Lower Band

// Plot RSI Levels (Optional)
hline(rsiOverbought, "Overbought Level", color=color.red, linestyle=hline.style_dotted)
hline(rsiOversold, "Oversold Level", color=color.green, linestyle=hline.style_dotted)

// Buy and Sell Conditions
buyCondition = (close < lowerBand) and (rsi < rsiOversold)  // Price below Lower Band and RSI Oversold
sellCondition = (close > upperBand) and (rsi > rsiOverbought)  // Price above Upper Band and RSI Overbought

// Execute Strategy
if (buyCondition)
    strategy.entry("Buy", strategy.long)
if (sellCondition)
    strategy.entry("Sell", strategy.short)

// Optional: Plot Buy/Sell Signals
plotshape(series=buyCondition, location=location.belowbar, color=color.green, style=shape.labelup, title="Buy Signal")
plotshape(series=sellCondition, location=location.abovebar, color=color.red, style=shape.labeldown, title="Sell Signal")
Published by ChaoZhang on the FMZ strategy square · last modified 2024-12-20. Collected in the Quant Trading Vault. Unvalidated research: re-test with your own data and costs before trusting it.
Build this with AgenKit
A spec is not a trading system. Paste this into your coding agent and AgenKit runs a specialist team — architecture, test-first build, risk gates, review — with paper trading on by default.
/agenkit build a production-grade trading bot with a backtest engine, risk controls and paper trading by default from strategies/Enhanced-Mean-Reversion-Strategy-with-Bollinger-Bands-and-RSI-Integration.md- npx agenkit install engineering-kit in your project
- Paste the command into your agent and approve each phase
- Get tests, backtest, risk controls and a paper-trading switch
Understand it first
Before you run this, read the lesson behind the idea and how to backtest it honestly. Specs like this one are the survivors of an unknown number of trials; deflate their results accordingly.
Related specs
- Advanced 15 Minute Chart Trading Signal StrategyPine Script · Mean reversion · 3h
- Advanced Quantitative Trading Strategy Combining RSI Divergence and Moving AveragesPine Script · Mean reversion · 1h
- Bollinger Bands Stochastic RSI Extreme Strategy BBSR Extreme StrategyPine Script · Mean reversion · 1h
- Dual Moving Average RSI Synergy Options Quantitative Trading StrategyPine Script · Mean reversion · 1h
- Gods Bollinger Bands RSI Trading StrategyPine Script · Mean reversion · 1d
- Multi Indicator Reversal Point Capture Trading StrategyPine Script · Mean reversion · 1d