Enhanced Multi Indicator Momentum Trading Strategy
The Enhanced Multi-Indicator Momentum Trading Strategy is a quantitative trading approach that combines volume analysis, trend confirmation, and dynamic risk management. This strategy is primarily designed for…
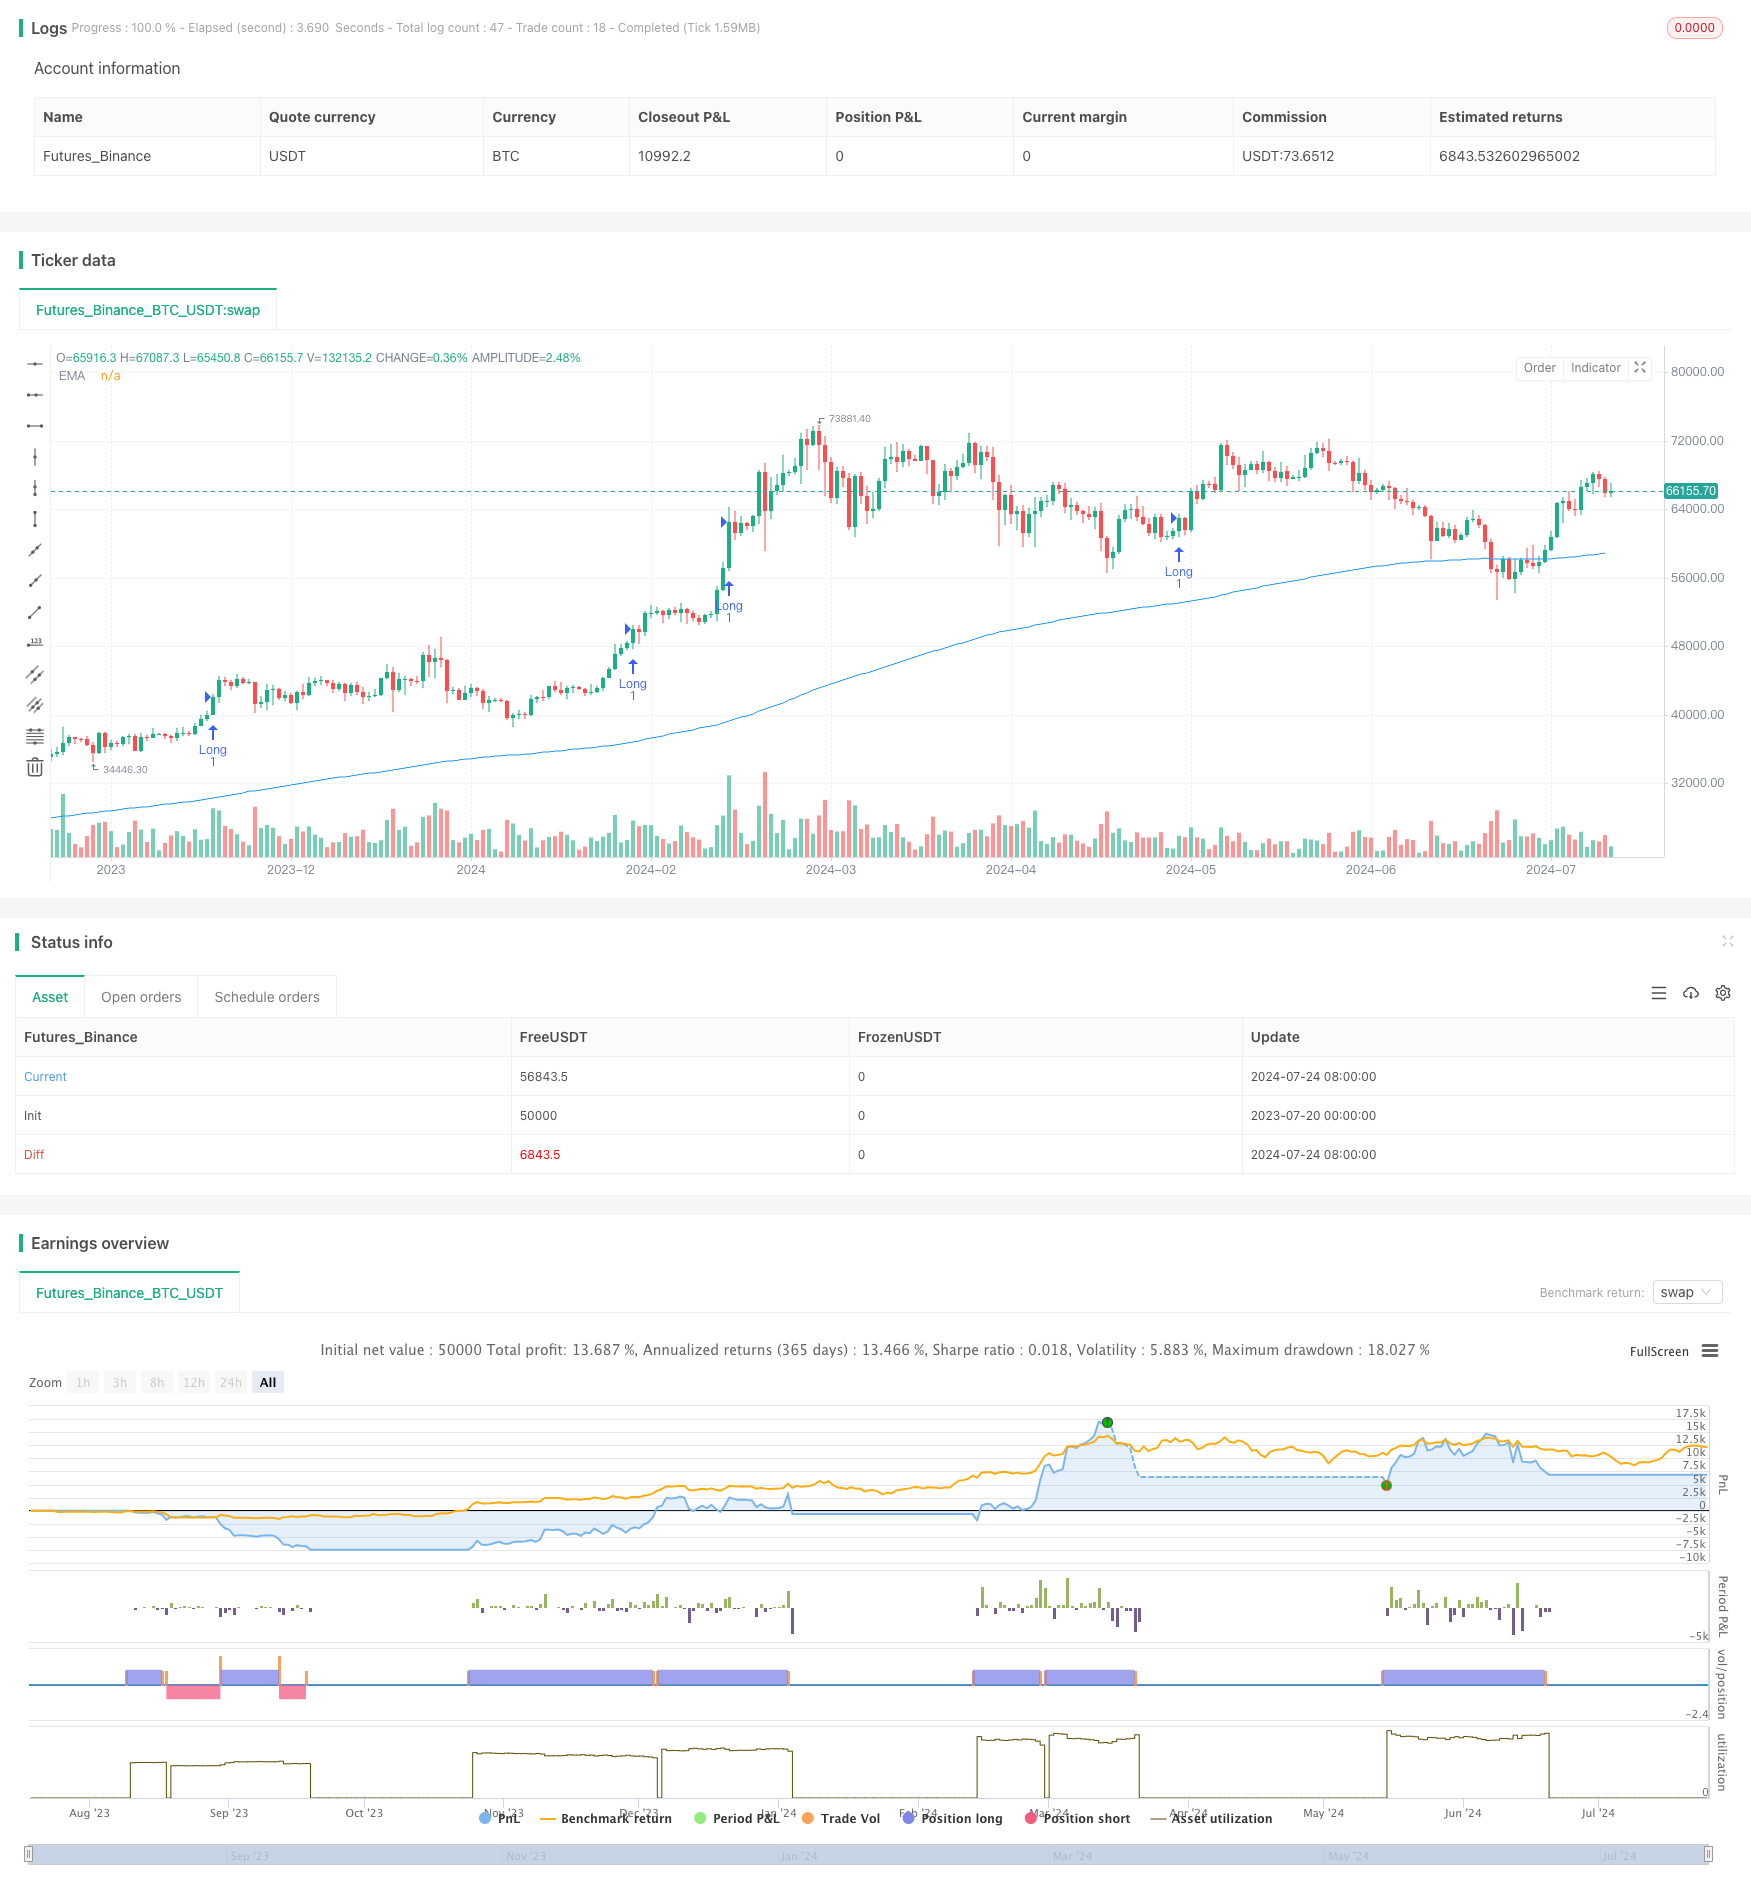
Overview
The Enhanced Multi-Indicator Momentum Trading Strategy is a quantitative trading approach that combines volume analysis, trend confirmation, and dynamic risk management. This strategy is primarily designed for high-volatility markets, identifying potential trading opportunities by analyzing consecutive candlestick volume changes, price trends, and market volatility. The strategy utilizes an Exponential Moving Average (EMA) to confirm overall market trends and uses the Average True Range (ATR) to set dynamic take-profit and stop-loss points, adapting to various market conditions.
Strategy Principles
Volume Analysis: The strategy focuses on the volume direction of three consecutive candlesticks and calculates the ratio of current volume to recent average volume. This helps identify abnormal volume increases that may indicate price breakouts or reversals.
Trend Confirmation: A 200-period Exponential Moving Average (EMA) is used to confirm the overall market trend. When the price is above the EMA, it's considered an uptrend; otherwise, it's a downtrend.
Entry Conditions:
- Long: Three consecutive up-candles with increasing volume, current volume 1.5 times higher than average, and price above the EMA.
- Short: Three consecutive down-candles with increasing volume, current volume 1.5 times higher than average, and price below the EMA.
Dynamic Risk Management: A 14-period Average True Range (ATR) is used to set take-profit and stop-loss points.
- Stop Loss: Set at 1.5 times ATR
- Take Profit: Set at 2.5 times ATR
Strategy Advantages
Multi-dimensional Analysis: Combines analysis of volume, price trends, and market volatility, increasing signal reliability.
Dynamic Risk Management: Uses ATR to set take-profit and stop-loss levels, automatically adjusting to market volatility and adapting to different market environments.
Trend Following: Confirms overall trend using EMA, reducing the risk of counter-trend trading.
Flexibility: Multiple parameters can be adjusted for different market conditions and trading instruments, providing strong adaptability.
Visualization: The strategy annotates entry points, take-profit, and stop-loss levels on the chart, allowing traders to intuitively understand and analyze.
Strategy Risks
False Breakout Risk: In ranging markets, frequent false breakout signals may lead to overtrading.
Slippage Risk: In highly volatile markets, actual execution prices may significantly differ from signal trigger prices.
Over-reliance on Technical Indicators: The strategy primarily relies on technical indicators, potentially overlooking fundamental factors.
Parameter Sensitivity: Strategy performance may be sensitive to parameter settings, with different parameter combinations potentially leading to significantly different results.
Trading Costs: The strategy does not consider trading costs, which may affect profitability in actual trading.
Strategy Optimization Directions
Incorporate Market Sentiment Indicators: Consider adding indicators such as RSI or MACD to better capture market overbought/oversold conditions and momentum changes.
Optimize Volume Analysis: Consider using more sophisticated volume analysis methods, such as On-Balance Volume (OBV) or Chaikin Money Flow (CMF), to provide more accurate volume signals.
Add Time Filters: Introduce trading time window concepts to avoid trading during low liquidity market periods.
Dynamic Parameter Adjustment: Consider using adaptive parameters that automatically adjust EMA periods, ATR multiples, etc., based on recent market conditions.
Incorporate Fundamental Data: Integrate some fundamental indicators or news event analysis to enhance the strategy's comprehensiveness.
Improve Take-Profit and Stop-Loss Mechanisms: Consider using trailing stops or support/resistance-based stop methods to better protect profits.
Add Filtering Conditions: Include additional filtering conditions, such as volume anomalies or price range volatility, to reduce false signals.
Conclusion
The Enhanced Multi-Indicator Momentum Trading Strategy provides a relatively comprehensive trading method for high-volatility markets by combining volume analysis, trend confirmation, and dynamic risk management. The strategy's strengths lie in its multi-dimensional analysis and dynamic risk management capabilities, but it also faces risks such as false breakouts and over-reliance on technical indicators. By introducing more indicators, optimizing parameter settings, and improving risk management methods, this strategy has the potential to further enhance its performance and adaptability. However, traders should still exercise caution when using this strategy, conduct thorough backtesting and live validation, and make necessary adjustments based on specific market conditions.
Source Pine Script
/*backtest
start: 2023-07-20 00:00:00
end: 2024-07-25 00:00:00
period: 1d
basePeriod: 1h
exchanges: [{"eid":"Futures_Binance","currency":"BTC_USDT"}]
*/

//@version=5
strategy("Improved Volume Based Strategy", overlay=true)

// Parameter
volumePeriod = input.int(3, "Volume Period", minval=2, maxval=5)
atrPeriod = input.int(14, "ATR Period")
atrMultiplierSL = input.float(1.5, "ATR Multiplier for Stop Loss")
atrMultiplierTP = input.float(2.5, "ATR Multiplier for Take Profit")
emaPeriod = input.int(200, "EMA Period")

// Indicator calculation
atr = ta.atr(atrPeriod)
ema = ta.ema(close, emaPeriod)

// Determine the direction of volume
volumeUp = close > open
volumeDown = close < open

// Check continuityKDirection of line volume
consecutiveUpVolume = volumeUp and volumeUp[1] and volumeUp[2]
consecutiveDownVolume = volumeDown and volumeDown[1] and volumeDown[2]

// Calculate volume multiplier
volumeRatio = volume / ta.sma(volume, volumePeriod)

// Admission conditions
longCondition = consecutiveUpVolume and volumeRatio > 1.5 and close > ema
shortCondition = consecutiveDownVolume and volumeRatio > 1.5 and close < ema

// Execution strategy
if (longCondition)
    stopLoss = low - atr * atrMultiplierSL
    takeProfit = high + atr * atrMultiplierTP
    strategy.entry("Long", strategy.long)
    strategy.exit("Exit Long", "Long", stop=stopLoss, limit=takeProfit)
    labelText = "Many:" + str.tostring(close, "#.##") + " Multiplier:" + str.tostring(volumeRatio, "#.##") + " \ntake profit:" + str.tostring(takeProfit, "#.##") + " \nStop loss:" + str.tostring(stopLoss, "#.##")
    label.new(bar_index, low - atr * 2, text=labelText, color=color.green, textcolor=color.white, style=label.style_label_up)

if (shortCondition)
    stopLoss = high + atr * atrMultiplierSL
    takeProfit = low - atr * atrMultiplierTP
    strategy.entry("Short", strategy.short)
    strategy.exit("Exit Short", "Short", stop=stopLoss, limit=takeProfit)
    labelText = "Empty:" + str.tostring(close, "#.##") + " Multiplier:" + str.tostring(volumeRatio, "#.##") + " \ntake profit:" + str.tostring(takeProfit, "#.##") + " \nStop loss:" + str.tostring(stopLoss, "#.##")
    label.new(bar_index, high + atr * 2, text=labelText, color=color.red, textcolor=color.white, style=label.style_label_down)

// Draw indicators
plot(ema, color=color.blue, title="EMA")
Published by ChaoZhang on the FMZ strategy square · last modified 2024-07-26. Collected in the Quant Trading Vault. Unvalidated research: re-test with your own data and costs before trusting it.
Build this with AgenKit
A spec is not a trading system. Paste this into your coding agent and AgenKit runs a specialist team — architecture, test-first build, risk gates, review — with paper trading on by default.
/agenkit build a production-grade trading bot with a backtest engine, risk controls and paper trading by default from strategies/Enhanced-Multi-Indicator-Momentum-Trading-Strategy.md- npx agenkit install engineering-kit in your project
- Paste the command into your agent and approve each phase
- Get tests, backtest, risk controls and a paper-trading switch
Understand it first
Before you run this, read the lesson behind the idea and how to backtest it honestly. Specs like this one are the survivors of an unknown number of trials; deflate their results accordingly.
Related specs
- KST EMA Momentum Trend Following StrategyPine Script · Momentum · 1d
- Momentum Strategy Based on DEMA and EMA Crossover with ATR Volatility FilterPine Script · Momentum · 1h
- Momentum Trend Optimization Combination StrategyPine Script · Momentum · 1h
- Moving Average Candle Regression StrategyPine Script · Momentum · 15m
- Multi EMA Trend Momentum Trading Strategy with Risk Management SystemPine Script · Momentum · 1h
- Multi Indicator Trend Momentum Trading Strategy with Dynamic Risk Management SystemPine Script · Momentum · 1h