Strategy vault / Mean reversion
Ergotic Dual rail Reverse MACD Quantitative Trading Strategy
This strategy is a dual-rail reverse MACD quantitative trading strategy. It draws on the technical indicators described by William Blau in his book "Momentum, Direction and Divergence" and expands on them. The…
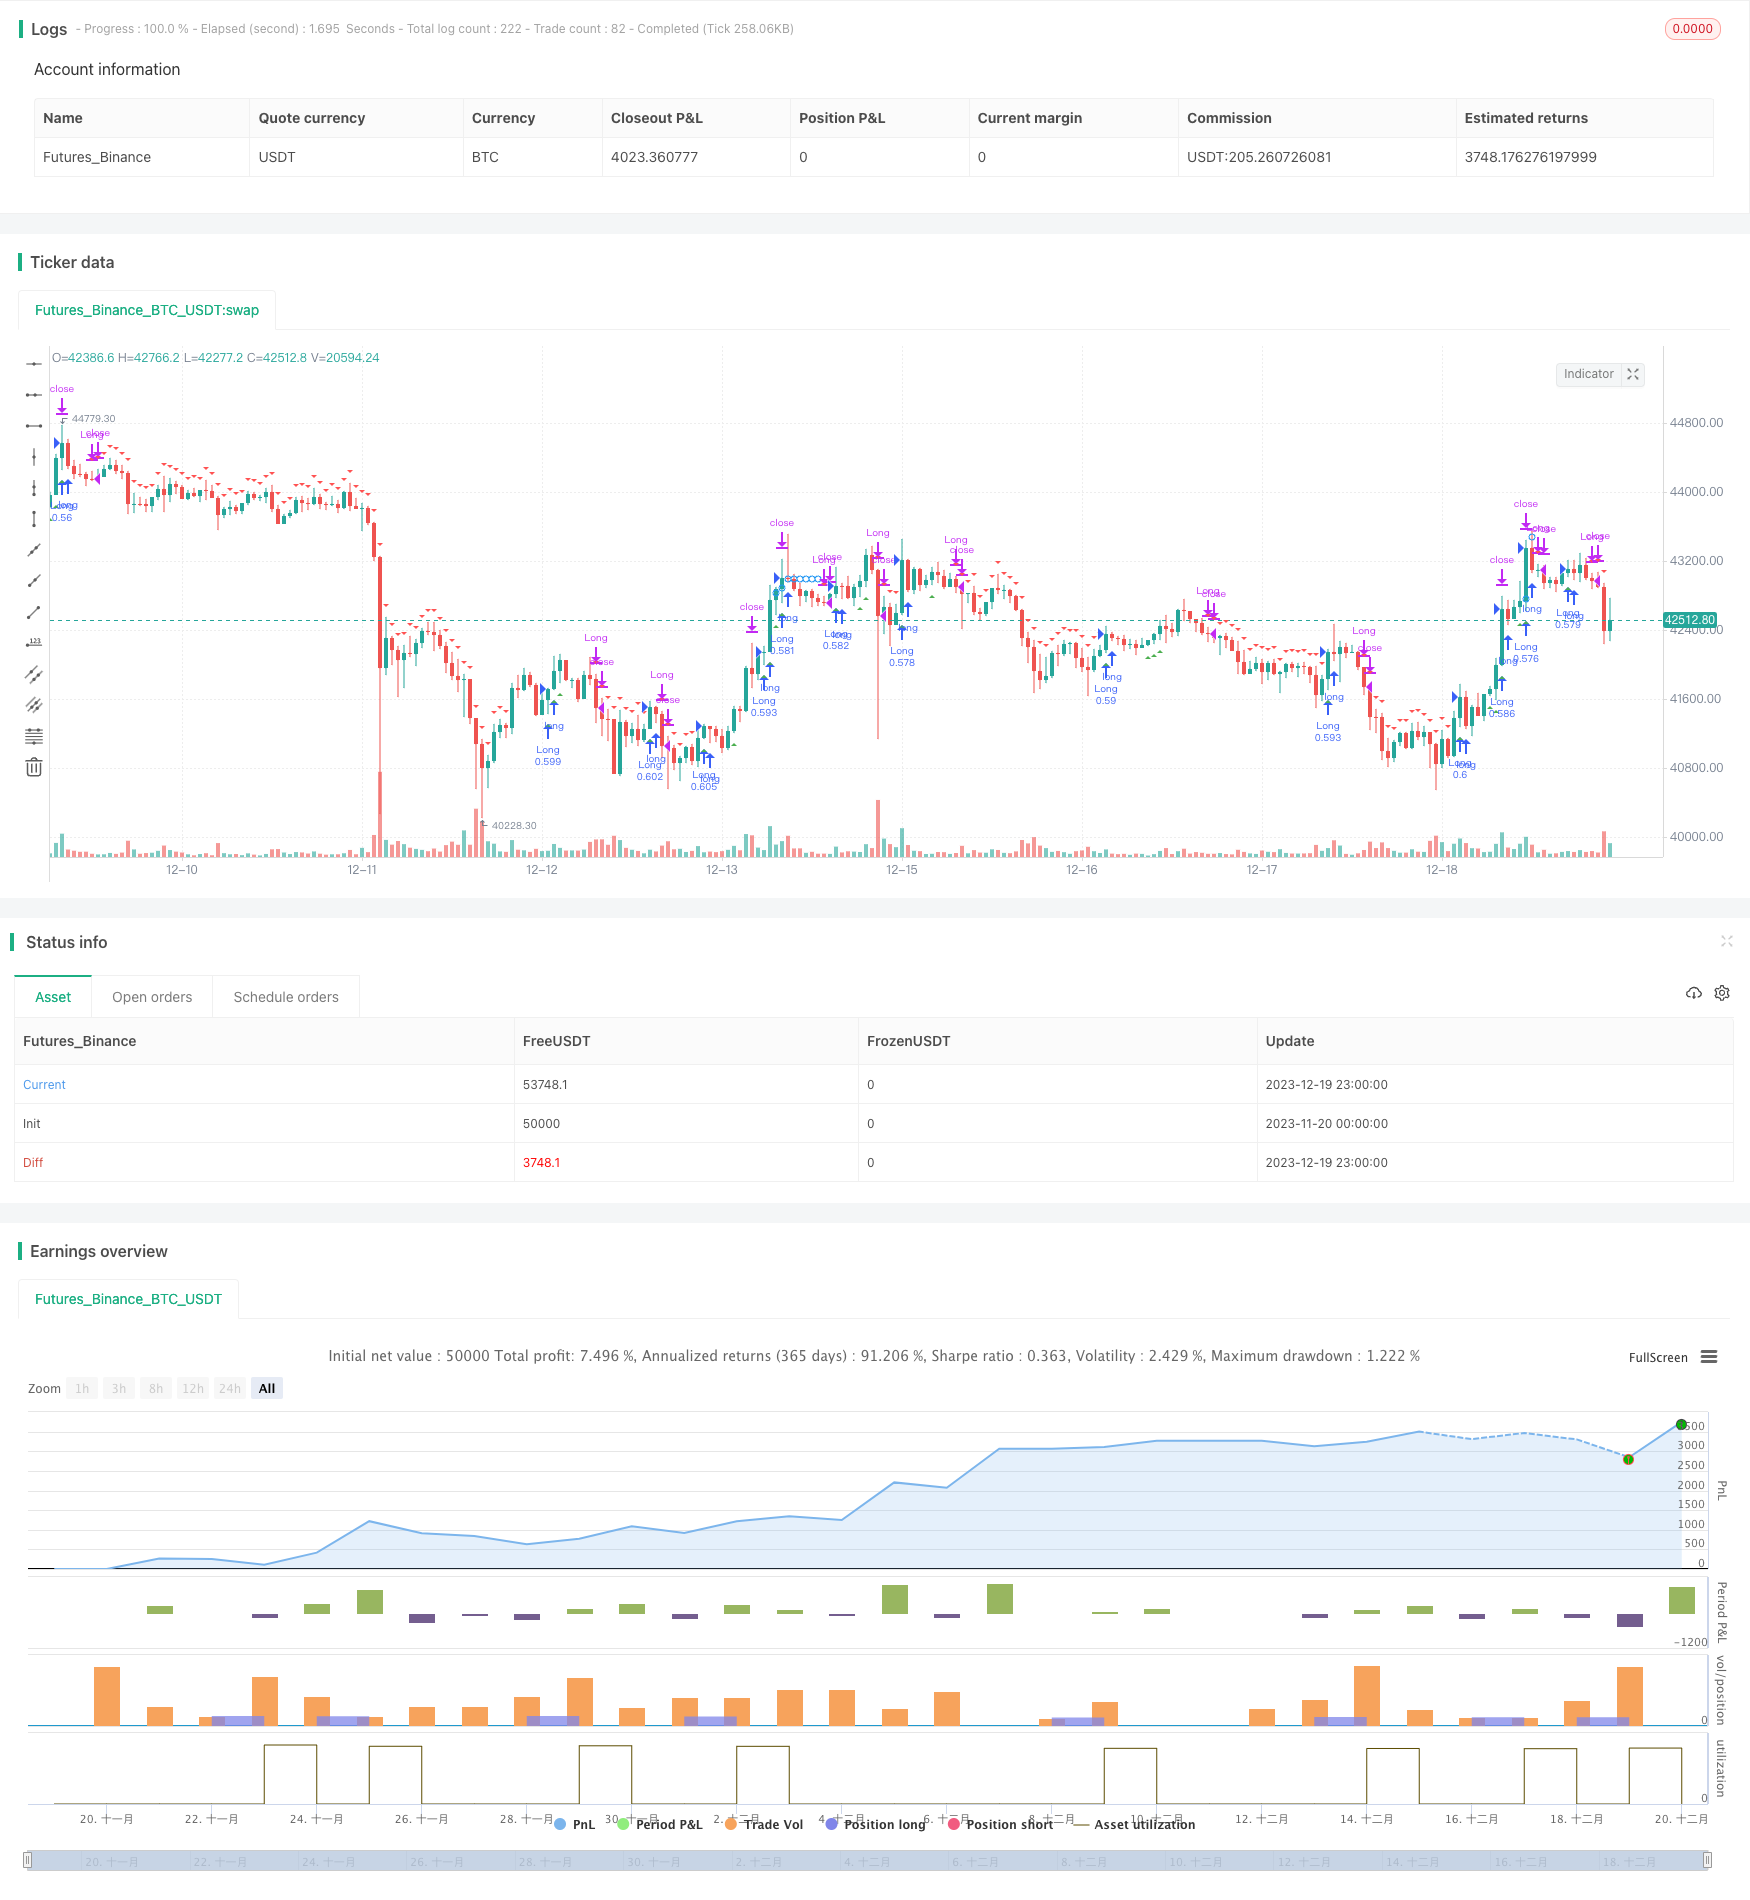
Overview
This strategy is a dual-rail reverse MACD quantitative trading strategy. It draws on the technical indicators described by William Blau in his book "Momentum, Direction and Divergence" and expands on them. The strategy also has backtesting capabilities and can incorporate additional features like alerts, filters, trailing stop loss, etc.
Principles
The core indicator of this strategy is MACD. It calculates the fast moving average EMA(r) and slow moving average EMA(slowMALen), then computes their difference xmacd. It also calculates the EMA(signalLength) of xmacd to get xMA_MACD. A long signal triggers when xmacd crosses above xMA_MACD, and a short signal triggers on a cross below. The key aspect of this strategy is the reverse trading signals, i.e. the relationship between xmacd and xMA_MACD is opposite to that of the conventional MACD indicator, which is also where the name "Reverse MACD" comes from.
In addition, the strategy incorporates trend filters. When a long signal fires, if the bullish trend filter is configured, it will check if the price is increasing. Similarly, the short signal checks for a downward price trend. RSI and MFI indicators can also be used to filter out signals. A stop loss mechanism is included to prevent losses beyond a threshold.
Advantage Analysis
The biggest advantage of this strategy is the powerful backtesting capabilities. You can choose different trading instruments, set the backtest timeframe, and optimize the strategy parameters based on specific instrument data. Compared to a simple MACD strategy, it incorporates trend and overbought/oversold analysis to filter out some identical signals. The dual-rail reverse MACD is different from the traditional MACD, allowing it to capitalize on some opportunities that the traditional MACD may miss.
Risk Analysis
The primary risk of this strategy comes from the reverse trading logic. While reverse signals can capture some opportunities missed by traditional signals, it also means forfeiting some conventional MACD entry points, necessitating careful assessment. Moreover, the MACD itself is prone to generating false bullish signals. The strategy may result in excessive trades and increased costs during choppy, directionless markets.
To mitigate risks, parameters can be optimized - tuning the moving average lengths; combining trends and indicator filters avoids signals in choppy markets; raising stop loss distances ensures capped losses on individual trades.
Optimization Directions
The strategy can be improved in several aspects:
- Adjust fast and slow rail parameters, optimize moving average lengths, backtest to find optimal parameter sets for specific instruments
- Add or tune trend filters, judge from backtest results whether it improves return
- Test different stop loss mechanisms, fixed or trailing, to determine the better performer
- Try combining other indicators like KD, Bollinger Bands to set additional filter conditions and ensure signal quality
Summary
The dual-rail reverse MACD quantitative strategy builds upon the classic MACD indicator with extensions and improvements. With flexible parameter configurations, abundant filter choices, and powerful backtesting functionality, it can be tuned to suit different trading instruments. Hence it is an intriguing and promising quantitative trading strategy worthy of further exploration.
Parameters
| Name | Default | What it controls |
|---|---|---|
| v_input_1_close | 0 | source: close | high | low | open | hl2 | hlc3 | hlcc4 | ohlc4 |
| v_input_2 | 0 | strategyType: Long Only | Long & Short | Short Only |
| v_input_3 | 7 | From Month |
| v_input_4 | true | From Day |
| v_input_5 | 2018 | From Year |
| v_input_6 | 12 | To Month |
| v_input_7 | true | To Day |
| v_input_8 | 2030 | To Year |
| v_input_9 | 144 | R (32,55,89,100,144,200) |
| v_input_10 | 6 | slowMALen |
| v_input_11 | 6 | signalLength |
| v_input_12 | false | Trade reverse (long/short switch) |
| v_input_13 | true | Long only if price has increased |
| v_input_14 | false | Short only if price has decreased |
| v_input_15 | 2 | trending_price_length |
| v_input_16 | false | trending_price_with_ema |
| v_input_17 | 3 | trending_price_ema |
| v_input_18 | 14 | rsi_length |
| v_input_19 | 14 | RSI Sell Cutoff (Sell only if >= #) |
| v_input_20 | 82 | RSI Buy Cutoff (Buy only if <= #) |
| v_input_21 | false | Long only if RSI has increased |
| v_input_22 | 2 | trending_rsi_length |
| v_input_23 | 14 | mfi_length |
| v_input_24 | 14 | mfi_lower |
| v_input_25 | 82 | mfi_upper |
| v_input_26 | false | Long only if MFI has increased |
| v_input_27 | 2 | trending_mfi_length |
| v_input_28_hlc3 | 0 | TSL source: hlc3 | high | low | open | hl2 | close | hlcc4 | ohlc4 |
| v_input_29 | 5 | Use different timeframe for stop trigger? Uncheck box above. |
| v_input_30 | 3 | tslTrigger |
| v_input_31 | 0.6 | tslStop |
| v_input_32 | 7 | Stop Loss % |
| v_input_33 | 1.8 | Take Profit % |
Source Pine Script
/*backtest
start: 2023-11-20 00:00:00
end: 2023-12-20 00:00:00
period: 1h
basePeriod: 15m
exchanges: [{"eid":"Futures_Binance","currency":"BTC_USDT"}]
*/

//@version = 3
////////////////////////////////////////////////////////////
//  Copyright by HPotter v1.0 09/12/2016
// This is one of the techniques described by William Blau in his book
// "Momentum, Direction and Divergence" (1995). If you like to learn more,
// we advise you to read this book. His book focuses on three key aspects
// of trading: momentum, direction and divergence. Blau, who was an electrical
// engineer before becoming a trader, thoroughly examines the relationship
// between price and momentum in step-by-step examples. From this grounding,
// he then looks at the deficiencies in other oscillators and introduces some
// innovative techniques, including a fresh twist on Stochastics. On directional
// issues, he analyzes the intricacies of ADX and offers a unique approach to help
// define trending and non-trending periods.
// Blau`s indicator is like usual MACD, but it plots opposite of meaningof
// stndard MACD indicator.
//
// You can change long to short in the Input Settings
// Please, use it only for learning or paper trading. Do not for real trading.
//
//
// 2018-09 forked by Khalid Salomão
// - Backtesting
// - Added filters: RSI, MFI, Price trend
// - Trailing Stop Loss
// - Other minor adjustments
//
////////////////////////////////////////////////////////////
strategy(title="Ergotic MACD Backtester [forked from HPotter]", shorttitle="Ergotic MACD Backtester", overlay=true, pyramiding=0, default_qty_type=strategy.cash, default_qty_value=25000, initial_capital=50000, commission_type=strategy.commission.percent, commission_value=0.15, slippage=3)


// === BACKTESTING: INPUT BACKTEST RANGE ===
source = input(close)
strategyType = input(defval="Long Only", options=["Long & Short", "Long Only", "Short Only"])

FromMonth = input(defval = 7, title = "From Month", minval = 1, maxval = 12)
FromDay   = input(defval = 1, title = "From Day", minval = 1, maxval = 31)
FromYear  = input(defval = 2018, title = "From Year", minval = 2017)
ToMonth   = input(defval = 12, title = "To Month", minval = 1, maxval = 12)
ToDay     = input(defval = 1, title = "To Day", minval = 1, maxval = 31)
ToYear    = input(defval = 2030, title = "To Year", minval = 2017)

start     = timestamp(FromYear, FromMonth, FromDay, 00, 00)
finish    = timestamp(ToYear, ToMonth, ToDay, 23, 59)
window()  => true // window of time verification

// === STRATEGY ===

r = input(144, minval=1, title="R (32,55,89,100,144,200)") // default 32
slowMALen = input(6, minval=1) // default 32
signalLength = input(6, minval=1)
reverse = input(false, title="Trade reverse (long/short switch)")

//hline(0, color=blue, linestyle=line)

fastMA = ema(source, r)
slowMA = ema(source, slowMALen)
xmacd = fastMA - slowMA
xMA_MACD = ema(xmacd, signalLength)

pos = 0
pos := iff(xmacd < xMA_MACD, 1,
	   iff(xmacd > xMA_MACD, -1, nz(pos[1], 0)))
possig = 0
possig := iff(reverse and pos == 1, -1,
          iff(reverse and pos == -1, 1, pos))

// === FILTER: price trend ====
trending_price_long = input(true, title="Long only if price has increased" )
trending_price_short = input(false, title="Short only if price has decreased" )
trending_price_length = input( 2, minval=1 )
trending_price_with_ema = input( false )
trending_price_ema = input( 3, minval=1 )
price_trend = trending_price_with_ema ? ema(source, trending_price_ema) : source
priceLongTrend() => (trending_price_long ? rising(price_trend, trending_price_length) : true)
priceShortTrend() => (trending_price_short ? falling(price_trend, trending_price_length) : true)

// === FILTER: RSI ===
rsi_length = input( 14, minval=1 )
rsi_overSold = input( 14, minval=0, title="RSI Sell Cutoff (Sell only if >= #)" )
rsi_overBought = input( 82, minval=0, title="RSI Buy Cutoff (Buy only if <= #)" )

vrsi = rsi(source, rsi_length)
rsiOverbought() => vrsi > rsi_overBought
rsiOversold() => vrsi < rsi_overSold

trending_rsi_long = input(false, title="Long only if RSI has increased" )
trending_rsi_length = input( 2 )
rsiLongTrend() => trending_rsi_long ? rising(vrsi, trending_rsi_length) : true

// === FILTER: MFI ===
mfi_length = input(14, minval=1)
mfi_lower = input(14, minval=0, maxval=50)
mfi_upper = input(82, minval=50, maxval=100)
upper_s = sum(volume * (change(source) <= 0 ? 0 : source), mfi_length)
lower_s = sum(volume * (change(source) >= 0 ? 0 : source), mfi_length)
mf = rsi(upper_s, lower_s)

mfiOverbought() => (mf > mfi_upper)
mfiOversold() => (mf < mfi_lower)

trending_mfi_long = input(false, title="Long only if MFI has increased" )
trending_mfi_length = input( 2 )
mfiLongTrend() => trending_mfi_long ? rising(mf, trending_mfi_length) : true

// === SIGNAL CALCULATION ===
long  = window() and possig == 1 and rsiLongTrend() and mfiLongTrend() and not rsiOverbought() and not mfiOverbought() and priceLongTrend()
short = window() and possig == -1 and not rsiOversold() and not mfiOversold() and priceShortTrend()

// === trailing stop
tslSource=input(hlc3,title="TSL source")
//suseCurrentRes = input(true, title="Use current chart resolution for stop trigger?")
tslResolution = input(title="Use different timeframe for stop trigger? Uncheck box above.", defval="5")
tslTrigger = input(3.0) / 100
tslStop = input(0.6) / 100

currentPrice = request.security(syminfo.tickerid, tslResolution, tslSource, barmerge.gaps_off, barmerge.lookahead_off)

isLongOpen = false
isLongOpen := nz(isLongOpen[1], false)
entryPrice=0.0
entryPrice:= nz(entryPrice[1], 0.0)
trailPrice=0.0
trailPrice:=nz(trailPrice[1], 0.0)

// update TSL high mark
if (isLongOpen )
    if (not trailPrice and currentPrice >= entryPrice * (1 + tslTrigger))
        trailPrice := currentPrice
    else
        if (trailPrice and currentPrice > trailPrice)
            trailPrice := currentPrice

if (trailPrice and currentPrice <= trailPrice * (1 - tslStop))
    // FIRE TSL SIGNAL
    short:=true // <===
    long := false

// if short clean up
if (short)
    isLongOpen := false
    entryPrice := 0.0
    trailPrice := 0.0

if (long)
    isLongOpen := true
    if (not entryPrice)
        entryPrice := currentPrice

// === BACKTESTING: ENTRIES ===
if long
    if (strategyType == "Short Only")
        strategy.close("Short")
    else
        strategy.entry("Long", strategy.long, comment="Long")

if short
    if (strategyType == "Long Only")
        strategy.close("Long")
    else
        strategy.entry("Short", strategy.short, comment="Short")

//barcolor(possig == -1 ? red: possig == 1 ? green : blue )
//plot(xmacd, color=green, title="Ergotic MACD")
//plot(xMA_MACD, color=red, title="SigLin")

plotshape(trailPrice ? trailPrice : na, style=shape.circle, location=location.absolute, color=blue, size=size.tiny)

plotshape(long, style=shape.triangleup, location=location.belowbar, color=green, size=size.tiny)
plotshape(short, style=shape.triangledown, location=location.abovebar, color=red, size=size.tiny)

// === Strategy Alert ===
alertcondition(long, title='BUY - Ergotic MACD Long Entry', message='Go Long!')
alertcondition(short, title='SELL - Ergotic MACD Long Entry', message='Go Short!')

// === BACKTESTING: EXIT strategy ===
sl_inp = input(7, title='Stop Loss %', type=float)/100
tp_inp = input(1.8, title='Take Profit %', type=float)/100

stop_level = strategy.position_avg_price * (1 - sl_inp)
take_level = strategy.position_avg_price * (1 + tp_inp)

strategy.exit("Stop Loss/Profit", "Long", stop=stop_level, limit=take_level)Published by ChaoZhang on the FMZ strategy square · last modified 2023-12-21. Collected in the Quant Trading Vault. Unvalidated research: re-test with your own data and costs before trusting it.
Build this with AgenKit
A spec is not a trading system. Paste this into your coding agent and AgenKit runs a specialist team — architecture, test-first build, risk gates, review — with paper trading on by default.
/agenkit build a production-grade trading bot with a backtest engine, risk controls and paper trading by default from strategies/Ergotic-Dual-rail-Reverse-MACD-Quantitative-Trading-Strategy.md- npx agenkit install engineering-kit in your project
- Paste the command into your agent and approve each phase
- Get tests, backtest, risk controls and a paper-trading switch
Understand it first
Before you run this, read the lesson behind the idea and how to backtest it honestly. Specs like this one are the survivors of an unknown number of trials; deflate their results accordingly.
Related specs
- Intraday Single Candle Indicator Combo Short Term Trading StrategyPine Script · Mean reversion · 1d
- 15 MIN BTCUSDTPERP BOTPine Script · Mean reversion · 45m
- Hourly Fluctuation Trading StrategyPine Script · Mean reversion
- Multi factor Quantitative Trading Strategy 440526Pine Script · Mean reversion · 4h
- Advanced 15 Minute Chart Trading Signal StrategyPine Script · Mean reversion · 3h
- Dynamic Adaptive Multi Timeframe Trend Following and Range Reversal Hybrid StrategyPine Script · Mean reversion · 2d